Sorry, there were no results found for “”
Sorry, there were no results found for “”
Sorry, there were no results found for “”
As a project manager, understanding the overall layout and timescale of your projects is key to your success. This is where Gantt charts come into play.
These valuable visual tools provide a comprehensive overview of a project timeline, allowing you to plan workflows effectively, allocate resources, and track progress.
However, crafting the perfect Gantt chart may feel like a hurdle if you’re new to this game.
To help, we’ve curated a list of 20 Gantt chart examples covering various projects and industries. To make things even more interesting, we’ve woven in priceless insights to help you harness the power of Gantt charts for project management needs.
So, buckle up as we explore various Gantt chart examples and templates and see how they can help create a transparent and organized project management strategy.
A traditional Gantt chart, at a glance, can be intimidating.
Is it a horizontal bar chart with lines? A stacked bar chart with time?
Basically, a Gantt chart is a simple project timeline in the form of a bar chart. The top part displays the time frame, and the left side of the chart lists the project tasks and activities.
Check out our article on Gantt charts vs timelines if you want to know the differences.
The purpose of a Gantt chart is to help you:
You can plot every individual task, event, outcome, and progress in your project on this horizontal bar chart.
Gantt charts are effective tools for project managers, HRs, team leaders, CEOs, CTOs, consultants, general managers, marketing teams, and so on.
Honestly, anyone who wants an instant picture of a project timeline can benefit from a Gantt chart.
Here are some of the ways in which Gantt charts are used in different industries and functions.
Gantt chart diagrams basically show all your project tasks along with their timelines using two axes. Here is a breakdown of what the different parts of a Gantt chart are. These components remain constant, irrespective of what you use the Gantt chart for.
Also Read: How to create a Gantt chart
Here are 20 examples of Gantt charts in project management for various use cases.
Gantt charts are a must for all types of project management. It can be a helpful visual that lets you break down your project plan and activities day by day.
You can:
And since everything is plotted right on the chart, neither your team nor clients need to ask you for project updates.
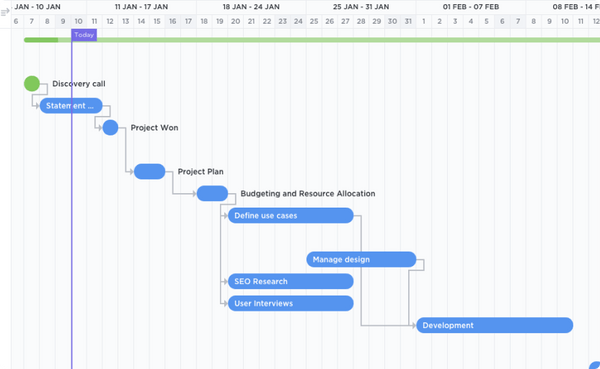
ClickUp’s Simple Project Management Gantt Chart Template is a visual tool that helps project managers and teams track project timelines, tasks, and dependencies.
This template offers an easy-to-use interface that allows users to create tasks, assign them to team members, set priorities, and add dependencies. Users can also adjust timelines and resources as necessary, providing real-time updates and alerts to keep everyone on the same page.
“The bathroom will be ready in a week.”
“Construction will begin in 3 weeks.”
We’ve all heard the site manager or engineer say that.
And as a construction project manager, if these responses make you scoff, you know construction projects often don’t meet deadlines.
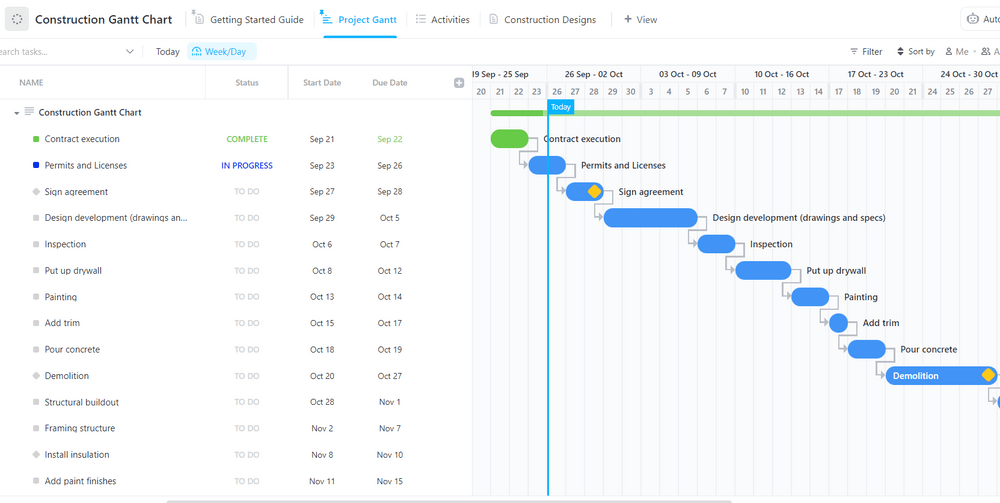
Fortunately, a simple Gantt chart is perfect for keeping construction projects on schedule and ensuring crew members, clients, and subcontractors are in the loop.
Just ask Jennifer Vollbrecht, PMP certified Project Manager and Principal Consultant at JVC.
We use Gantt charts to highlight critical tasks and use a three-week lookahead to communicate upcoming milestones on our construction projects. Gantt Charts are a great way to visualize many moving parts and pieces during construction.
I send the Gantt chart out to all project stakeholders a few days prior to a status meeting so that it can be reviewed, and everyone comes to the meeting prepare to discuss their upcoming activities.
Check out ClickUp’s Construction Gantt Chart Template for your next construction project.
Going through piles of resumes, handling onboarding, updating policies, streamlining interview processes… being in HR is no easy task.
However, with Gantt charts at your disposal, you’ll be able to tackle most human resource tasks with ease.
Use it to:
ClickUp’s Employee Onboarding Template includes a Gantt Chart View to help you plan a timeline of the onboarding process and set deadlines for each task. Create sections and tasks for each new employee and ensure that you go through each task with them. This way, you can ensure each new employee fits in with the team easily.
Make your own human resource management Gantt chart on ClickUp! Start with our templates for human resources.
Bonus: Resource leveling templates!
An IT Roadmap is used to create and communicate strategic plans for IT initiatives for the organization. This lets you track, monitor, and share information about the impacts of the IT projects to their respective stakeholders.
With a Gantt chart, you can strategically:
ClickUp’s IT Roadmap Gantt Template helps teams stay organized and efficient by providing an easy-to-use visualization of your entire project plan.
Are you a marketer who keeps finishing tasks only to find more things on your to-do list?
You need Gantt charts.
Use it to plan marketing campaigns, visualize your strategy, set marketing goals and milestones, etc., and observe how much time you can save on planning.
You also end up saving time on communication by sharing a Gantt chart for your team and stakeholders to track the goal’s progress.
The best part?
You and your team can plan continuously since marketing project management tools like ClickUp offer interactive Gantt charts that update in real-time.
Here’s an example:

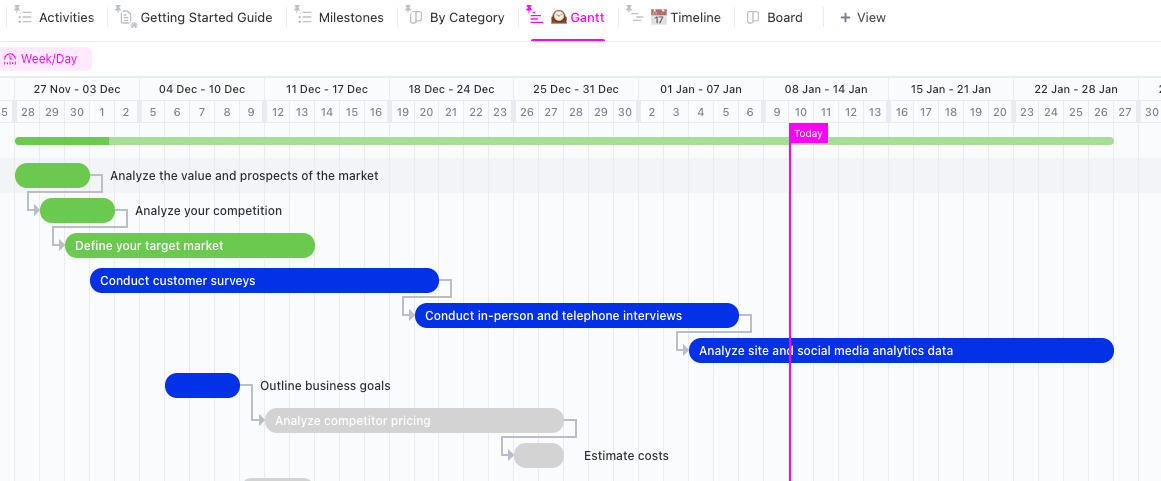
Product roadmaps and Gantt charts are like Sundays and brunch. A perfect fit, minus the Mimosas.
And with a Gantt chart, there’s no better place to plan your product development, launches, and manufacturing.
You can track:
A Gantt chart is a real blessing for a complex project that relies on multiple teams and departments.
Here’s an example of a product launch roadmap:
The Product Launch Checklist Template made by ClickUp keeps all your activities and milestones on track for an effective product launch plan. Use this Gantt Chart to monitor each stage of your product’s development process.
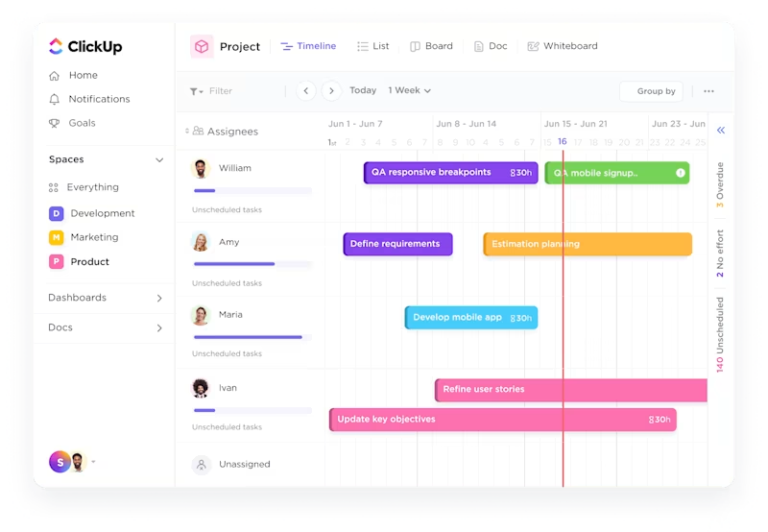
📮 ClickUp Insight: 31% of managers prefer visual boards, while others rely on Gantt charts, dashboards, or resource views.
But most tools force you to pick one. If the view doesn’t match the way you think, it just becomes another layer of friction. With ClickUp, you don’t have to choose. Switch between AI-powered Gantt charts, Kanban Boards, Dashboards, or Workload View in a single click. And with ClickUp AI, you can auto-generate tailored views or summaries based on who’s looking—whether it’s you, an exec, or your designer.
💫 Real Results: CEMEX sped up product launches by 15% and cut communication delays from 24 hours to seconds using ClickUp.
Lights, camera, Gantt!
Yes, even media teams can benefit from Gantt charts.
You can easily:
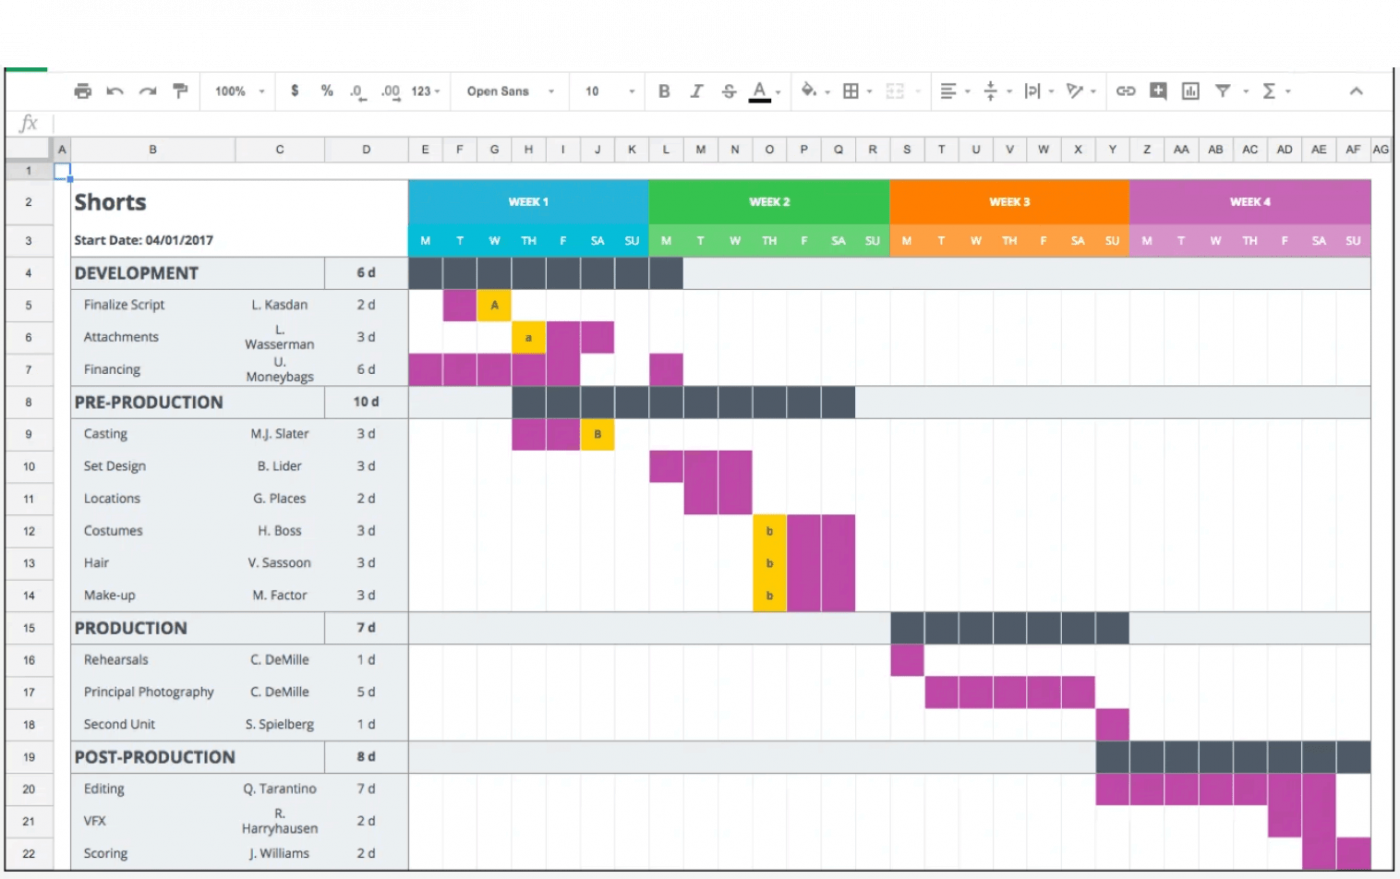
Whether it’s a YouTube video or a motion picture, a simple Gantt chart can help you deliver blockbuster content.
Here’s a simple video production Gantt chart example:
Social media is… modern-day oxygen?
A lot of us live and breathe it.
And some of us even have built a career around it. This involves tracking social media posts, content, engagement, and so much more.
But how can you do all that without succumbing to a scrolling frenzy?
Create a social media planner in a Gantt chart to plan campaigns, collaborate with the social media team, and ensure you’re posting on schedule.
You can even collaborate with your team to create the entire social media timeline with details of:
Got to be on your toes if you want to break the internet, right?
Here’s an example:
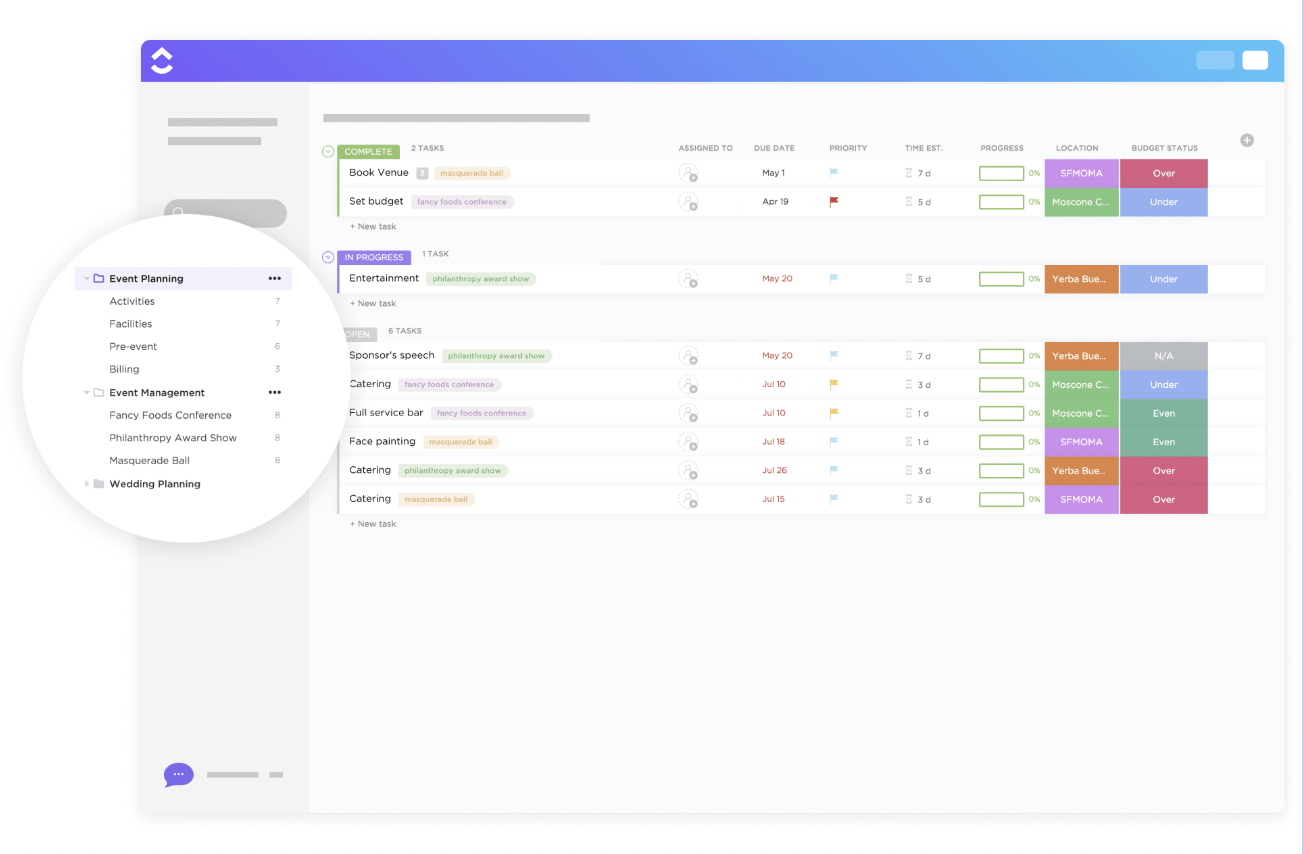
Event planners have tons of details to juggle to ensure events go smoothly.
And once the ticket sales pick up?
You need all the help you can get.
That’s where Gantt charts come in. Use it to break down your event plan into all the granular details. You can even group tasks by planning phase or vendor.
ClickUp’s Singular Event Planning Template helps you effortlessly plan an event, whether for business or personal use. Included are RSVP management, vendor selection, budgeting, and to-do task management.
Fun fact: You can even promote your event with a Gantt chart.
Create a promotional strategy and schedule tasks on the timeline to create all the hype you need for your launch event.
Make people show up for the venue you fought for!
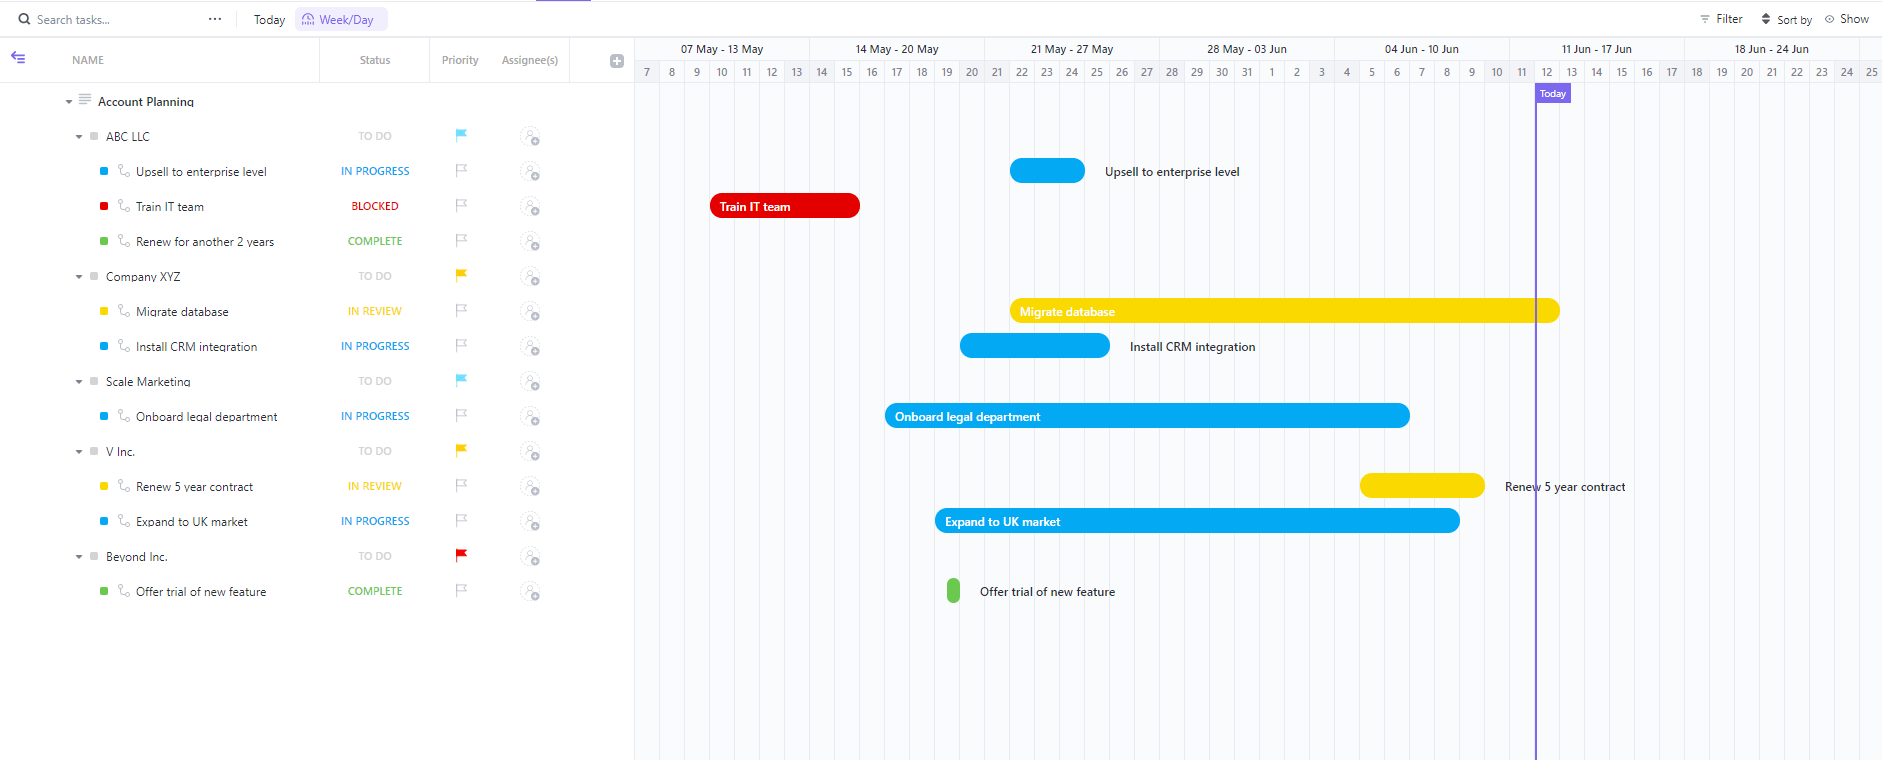
Let’s take an example: your client has appointed you to help them achieve their goals.
However, they’re new clients and need a little more reassurance from you (the consultant) regarding progress.
No worries. You can show your client that you have a practical roadmap to success with a Gantt chart.
ClickUp’s Account Planning Gantt Chart Template is useful for setting up tasks, assigning resources, and tracking progress over time.
Divide all the tasks between your team and the client’s team. You can also refer back to the chart during weekly huddles with the client to ensure you’re both singing the same song.
Bonus: Time tracking software for consultants
Surprised to see this on the Gantt chart example list?
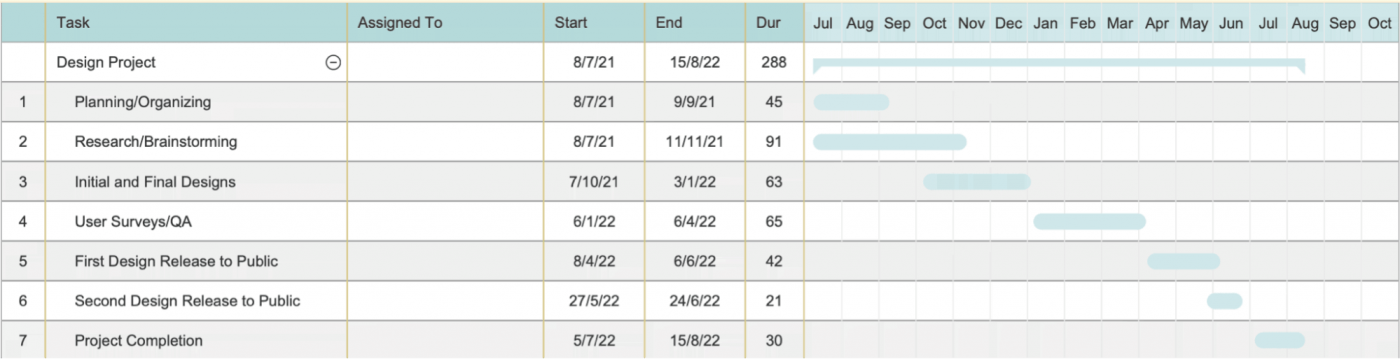
Well, designers and teams can use Gantt charts too.
From design planning and drawing to approving final designs and showing them to the world, Gantt charts can be helpful throughout the design workflow. You can also easily plan your design launch and track bookings.
And who knows, the Gantt way might just land you on the Milan runway.
Here’s a general design project Gantt chart example:
Check out these SmartDraw alternatives!
Whether you’re a business that creates websites or a company that develops apps for others, a Gantt chart can be your go-to.
Use it to layout and visualize the steps in the development process. It can include everything from designing the app’s looks to its features such as:
Since you’ll have to work with different people, departments, and more, Gantt charts can improve your chances of getting it done correctly and more quickly.
The Web Pages Gantt Chart Template by ClickUp is designed for app and web page development projects. It’ll help you plan and execute workflows across design and development and give you a way to visualize timelines and progress.
Successful launch, here we come!
Marcos Isaias, PMP certified Project Manager at Claro has this to say about using Gantt charts in mobile app development:
By having a collaborative exercise over the Gantt chart with the team, we often discover unseen tasks and validations missing to have a successful and quality application.It has helped us identify hidden tasks that would have caused delays if not mapped correctly. For example, we often plan QA for the software but maybe [forget to do the same] for the servers that would hold it.
Plan and execute them with Gantt charts. Track things like dates, times, contacts, subjects, etc.
You can manage everything related to your emails, contacts, and leads on a single chart, so you don’t miss sales opportunities or waste time.
ClickUp’s A/B Testing Gantt Template is the perfect resource for organizing and executing your A/B testing goals for winning email campaigns.
This template includes detailed task lists, resource allocation tracking, and progress tracking so that you can easily monitor the success of your campaigns.
When it comes to software development, a Gantt chart is like a cake cutter. It can help you visualize your project by cutting it into smaller working stages that you easily eat manage.
ClickUp’s Waterfall Management Template is designed to help you visualize, document, and track the steps of a software development project. Create tasks with 27 different custom statuses such as Closed, Open, In Progress, and more to keep track of the progress of each step in the project. Use the Gantt chart in ClickUp to easily track the duration and progress of each task.
And that’s not all.
Gantt charts are also perfect for software bug tracking. 🐛
A Gantt chart lets your team submit bug reports and track issues while developers quickly get to the bottom of the problems. You can even set priorities so everyone knows which bugs to exterminate first.
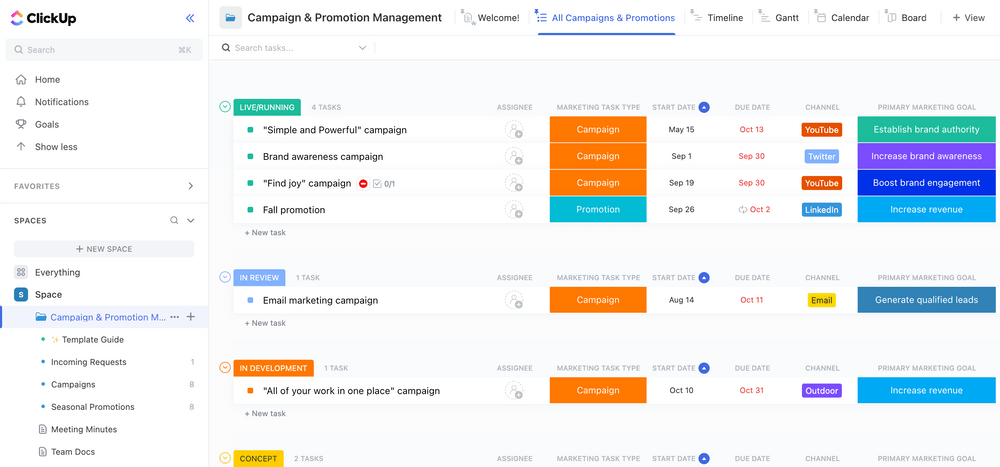
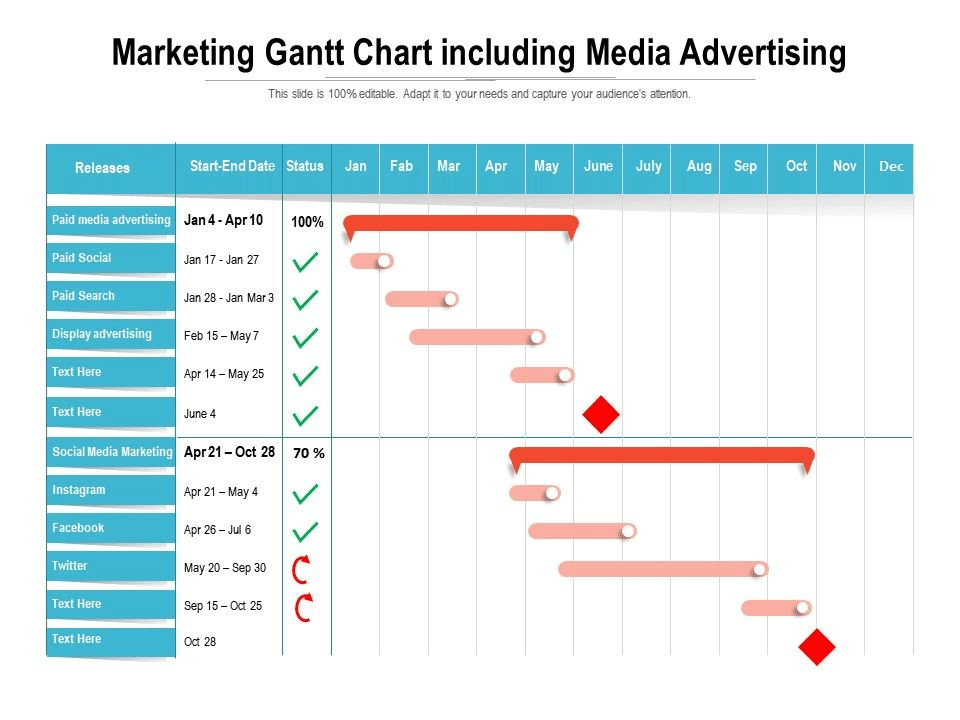
If you want people—especially the right ones—to find you, digital marketing must be your top priority. It can be advertising through social media, SEO, email marketing, etc.
With a Gantt chart, you can plot the start date, end date, budgets, tasks, and subtasks for all of your digital marketing strategies.
ClickUp’s Campaign & Promotion Management Gantt Template makes it easier to plan, execute, and monitor your campaigns in one place. Utilize 11 different custom attributes such as Audience Funnel, Channel, Draft Date, Launch Date, and Marketing Task Type, to save vital information about your campaigns and promotions.
The Gantt View will help you visualize the progress of tasks and monitor their timeline.
Bonus: Check out this guide on marketing project management!
Remember when education was all about classrooms, libraries, whiteboards, and last-minute exams preps? Well, most of that remains, except digitization has taken over.
Whiteboards are digital, libraries are a Google search away, and semester planning happens on Gantt charts. Teachers and students can track their semesters, programs, and exam dates on them.
Pro-tip for history teachers: Gantt charts are perfect for a visual representation of the timeline of historical events.
Make your own education Gantt chart on ClickUp and check out our templates for students!
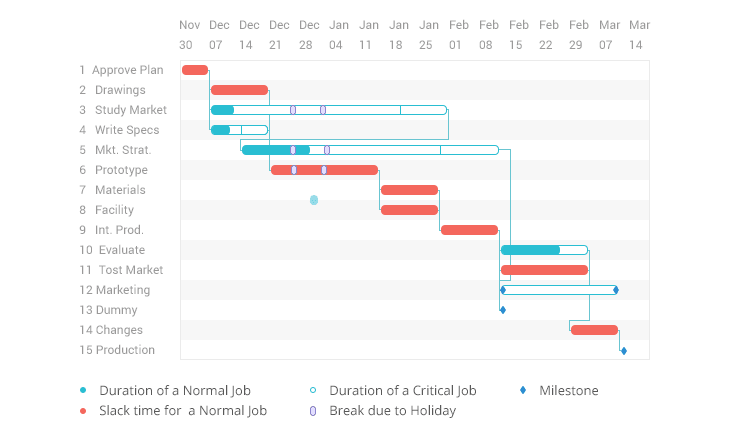
Try this Gantt Chart Template in Excel to structure out big and small educational projects for your class. It uses a simple visual representation to show how a project will be managed over time.

If you’re on the sales team, you must know:
And a whole lot more.
Don’t worry; a Gantt chart ensures you don’t miss such money-making opportunities. You can track all your sales, contacts, leads, customer onboarding, deal progress, etc.
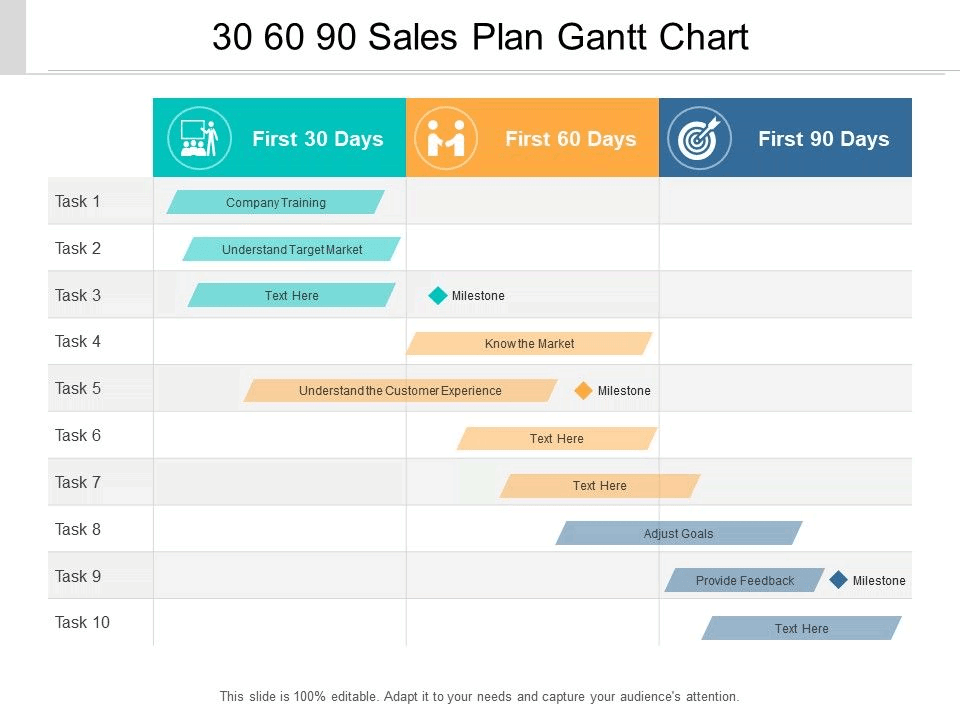
Nothing slips through the cracks because the chart holds everything you need to know.
Now all you have to worry about is waiting for a prospect to call you back.
(Sorry, even Gantt charts can’t help you there)
Bonus: RACI Chart Examples!
Sure, money might make the world go round. But it shouldn’t spin your head.
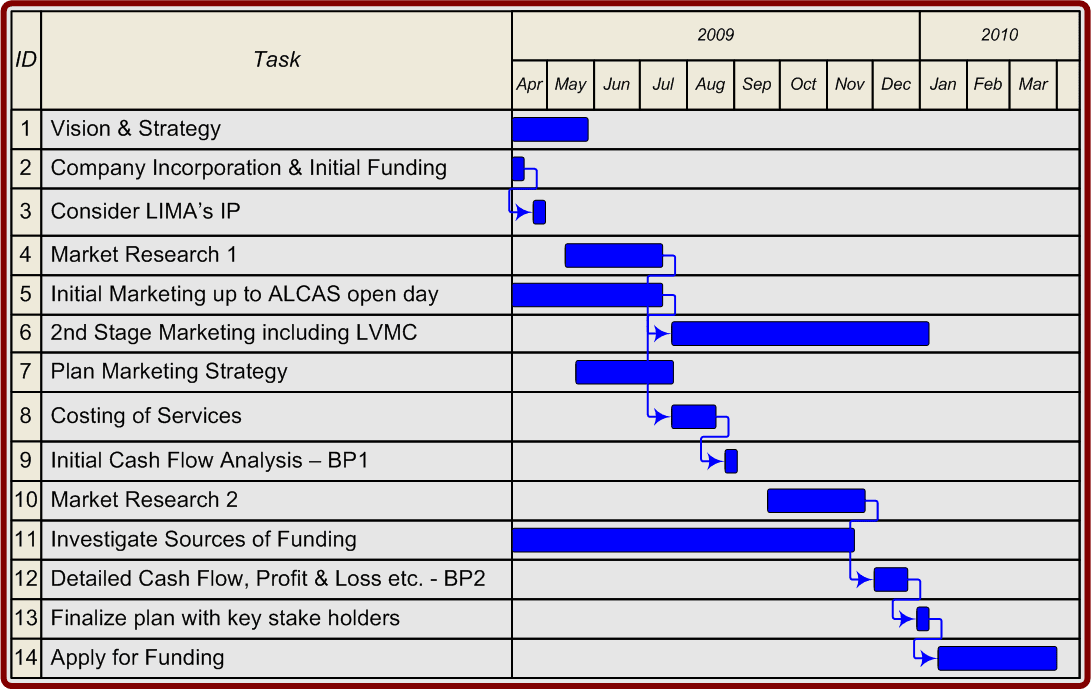
And that’s why many financial institutions and banks use Gantt charts.
A bank manager is a good example of someone who can track their tasks, plans, customer service, team performance, etc., on a Gantt chart.
It can also help prepare new banking products such as loans, deposits, and credit cards. It’s also a great tool to manage marketing campaigns in banks.
Here’s an example:
If you’re on a team that publishes a steady stream of content, deadlines are always on to you.
With Gantt charts, you’re always prepared for deadlines. Use it as an editorial calendar to see what’s coming up next on the schedule.
ClickUp’s Blog Management Template makes it easy to bring all of your ideas, posts, and timelines into one place—just plug in your content and go!
Pre-built Lists organize posts and assets, and Custom Fields bring all due dates, URLs, and files in one place! You can organize specific task groups by month and article and set milestones to track final approvals and “go-live” dates.
Gantt timelines are essential for project planning and tracking. They help teams visualize tasks, timelines, and dependencies in one place for better collaboration.
ClickUp’s Gantt Timeline Template is designed to make project planning easier. Open separate views such as Monthly, Yearly, and Weekly so that all the information is easy to access and organized. Use 3 different custom attributes such as Completion, Duration, and Phases to help visualize a timeline and easily manage tasks.
To sum it up, having a Gantt chart for your project management is as important as carrying a map on your road trip.
You can create Gantt charts in Microsoft Word, Excel, PowerPoint, Google Sheets, and more.
But if you don’t want to be “wifi down-level” frustrated, you should do what smart people do.
Create Gantt charts using a project management tool!
Usually, with such tools, all you have to do is create a task list and add the start and end dates. The tool then works its magic to display your project tasks over time as intuitive Gantt charts.
But which tool should you use? Explore the 13 best online Gantt chart software to find the right one.
To save you time, we’ll give you the answer right here.
The only online Gantt chart tool you require is ClickUp. It’s one of the world’s highest-rated productivity tools used by teams in several companies worldwide.
And you can create a simple (and pretty!) Gantt chart with ClickUp’s Gantt Chart view in three easy steps:
Modify what you see in your Gantt charts using the expandable and collapsible side menu.
You can use the chart to:
Check out these Gantt chart template options!
As these Gantt chart examples have shown you, a Gantt chart can take any project, industry, or team to the next level.
You can create one in PowerPoint, use an Excel Gantt chart, or even download a Gantt chart template.
But nothing beats ClickUp’s three-step Gantt chart maker.
With ClickUp, you can customize it to fit your needs, manage resources, dependencies, and so much more with ease. Additionally, this Gantt chart software can do more than just Gantt charts, it can be your time tracker, task manager, flowchart maker, proofing tool… just name it.
Join ClickUp for free to create awesome Gantt charts for any project or industry.

Praburam Srinivasan
Max 26min read
Praburam Srinivasan
Max 9min read
Praburam Srinivasan
Max 17min read

© 2026 ClickUp