10 Gantt Chart Alternatives to Manage Work and Increase Project Success


Sorry, there were no results found for “”
Sorry, there were no results found for “”
Sorry, there were no results found for “”
Gantt charts are powerful visual tools to illustrate a project schedule, but are they a one-size-fits-all for every project? The short answer is no, and that’s great news for project managers!
We have alternatives to Gantt charts that are just as effective but less complicated for project management. ⭐️
As a project manager, you need the right tools to coordinate and organize a project’s schedule, processes, and resources. In this article, we’ll cover ten awesome Gantt chart alternatives for project management to get the outcome you want!
In ClickUp’s Gantt charts guide, we took a detailed look at creating and reading Gantt charts—a popular project management tool to show tasks or events against time.
After Henry Gantt first introduced the concept, it was used for heavy construction projects like building the Hoover Dam in the United States. Today, this working tool is adopted for all kinds of project management systems, including Scrum and Agile.
In essence, Gantt charts show all the tasks that need to be done and how they relate to each other over a period of time. Here are the pros of using Gantt chart software:
On the flip side, Gantt charts can quickly complicate a project for a team, and here’s why:

Each project will have its own unique requirements, scope, resources, budget, and goals. However, here are three significant signs you need a Gantt chart alternative:
🪧 No team member to own and maintain the project Gantt chart from start to finish
🪧 No extra time to educate your team on how to use Gantt charts
🪧 No firm grasp on the order of tasks and milestones
While these are clear signals a Gantt chart won’t set you up for success, all is not lost! Some alternatives will serve your team and project better (minus the confusion and complications that can come with Gantt charts).
Lists are typically the go-to to kick things off! They’re versatile and can be as detailed as needed to create a work breakdown structure. Especially when task priorities force teams to adjust (and this happens almost every day), lists can be changed quickly to reflect the most critical information needed to stay on track.
Even so, similar to Gantt charts, lists aren’t a one-size-fits-all project management tool. For example, if you know you’ll have to track dependencies for your project, lists won’t make this clear for your intended audience.
👉 To learn more about lists, check out our How to Create a Project Plan in 5 Steps article!
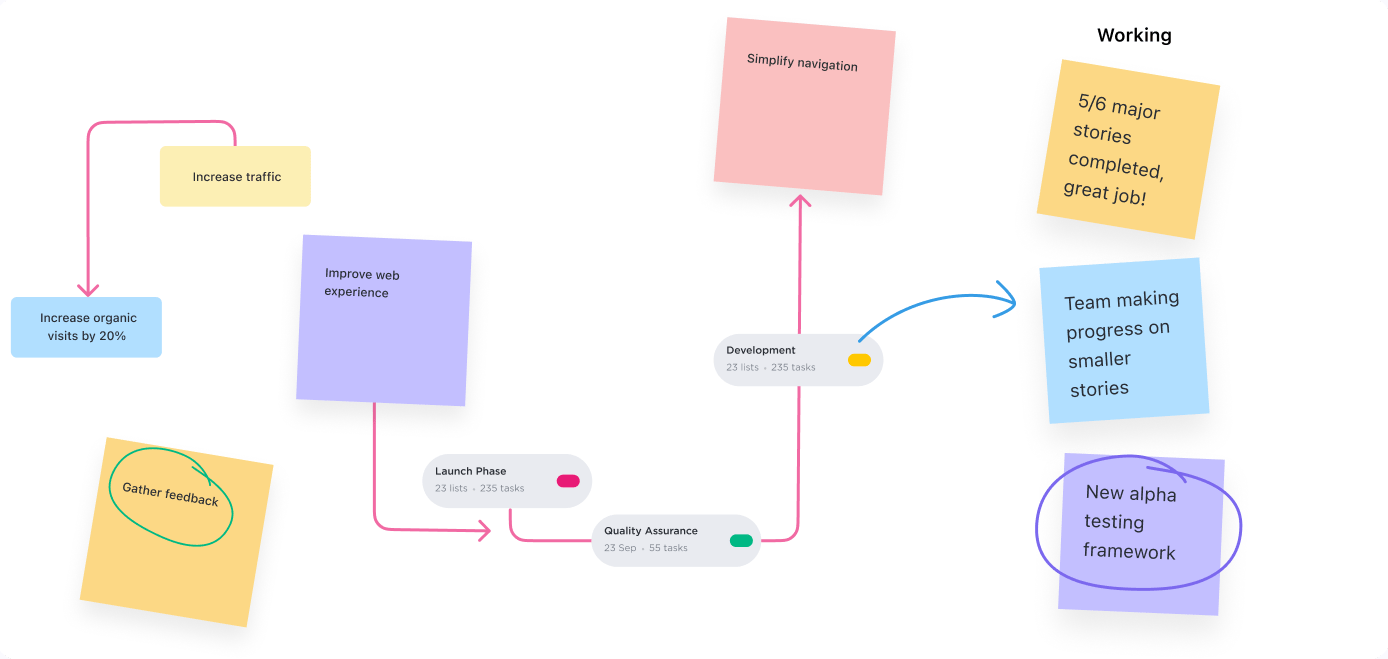
Whiteboards are the perfect tool for brainstorming sessions to align teams faster on work that needs to be done. Inside an office, a physical whiteboard can promote quick problem solving between individuals around the board.
Even as teams move to remote or hybrid working environments, whiteboards have an essential role to play when it comes to collaboration. The rise of collaborative whiteboard solutions has filled the void for how distributed teams brainstorm and conjure up ideas. With the global interactive whiteboards market expected to reach $2.31 Bn by 2025, it’s clear just how popular these tools are.
—Zeb Evans, CEO of ClickUp
👉 Learn how to connect ideas to your workflow faster with ClickUp Whiteboards!

A Kanban board is a workflow visualization tool best for projects that do not necessarily need prioritization or dependency strategies. Instead, Kanban boards help limit the work in progress per workflow status. A card (representing the task) moves through each column (representing the workflow status) from left to right until it reaches the DONE status. Kanban boards are flexible for managing these types of projects:
👉 Get more inspiration from our Kanban board examples article and learn more about the differences between Kanban and Gantt charts.
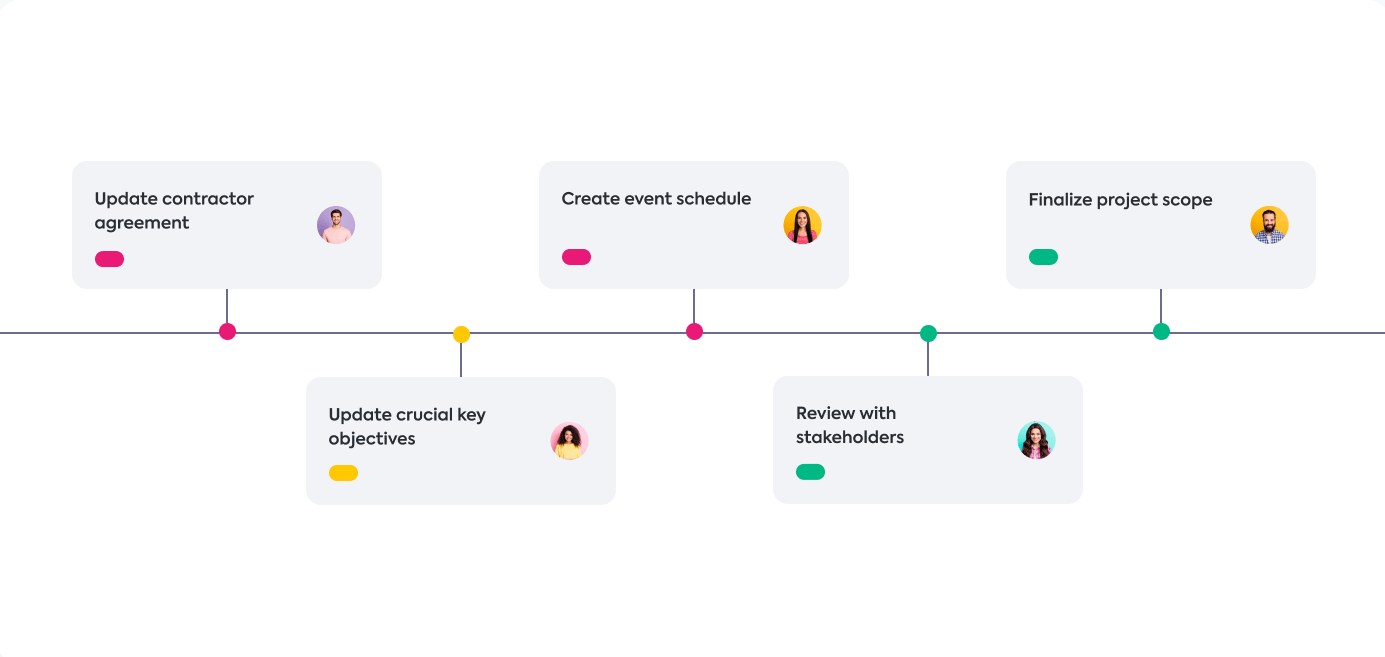
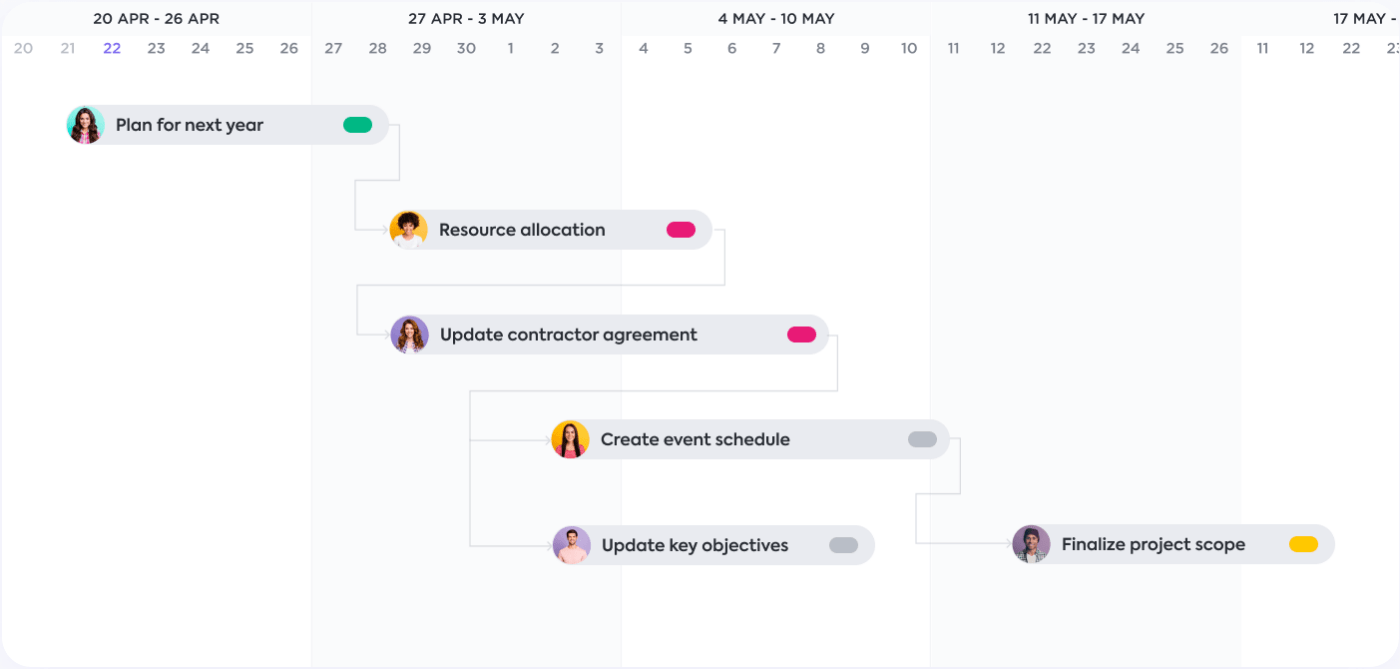
Timelines and Gantt charts may look similar, but the main difference is that a Gantt chart displays a detailed sequence of tasks and their dependencies on a two-dimensional chart. A project management timeline shows a chronological order of tasks and their due dates on a linear line!
Ultimately, deciding whether to use a Gantt chart or timeline comes down to what you want to communicate to your audience. For example, if you’re going to show a brief overview of a project’s life cycle, a timeline is enough. On the other hand, timelines would produce more questions than answers if you need to specify task dependencies and the complexity of a project.
👉 Get the answers to all your questions about Gantt charts vs timelines!
The next Gantt chart alternative on our list is a tool called mind maps, which are ideal for visually brainstorming ideas. At the core of a mind map, a central idea or question is typically at the center of the page. Lines are drawn from the center outward to connect related ideas. From those ideas, lines are drawn to relate a new level of ideas, and it goes on and on.
Mind maps are not typically used past the initial brainstorming, so everyone can freely generate ideas without worrying about being buttoned up. You can get started with a piece of paper and pencil or use software to level up your mind map creations.
Here are a few mind map resources with examples to see in action!

A Scrum board (or Sprint board) is a visual representation of the work to be done in a single Sprint. A Sprint is a time-boxed iteration during which a team completes a specific project section. Scrum boards equip teams by:
While Scrum boards improve team efficiency and communication, this Gantt chart alternative might be difficult for non-agile teams to adopt and successfully implement. Without a Scrum master or familiarity with agile project management, there’s a chance Scrum boards will do more harm than good to your project.
👉 Learn how to build and use a Scrum board with ClickUp’s ultimate guide!
Documents are the most straightforward alternative to Gantt charts. Docs help organize roles and responsibilities, budget notes, the scope of work, communication plan, charter, meeting notes, and more. Project managers can be as descriptive as needed with documents, eventually building a library of essential project management documents.
However, the downside of using documents for project management is that action items or tasks can quickly get lost or forgotten if buried within a document.
👉 Discover the best Google Docs alternatives for advanced collaboration options!
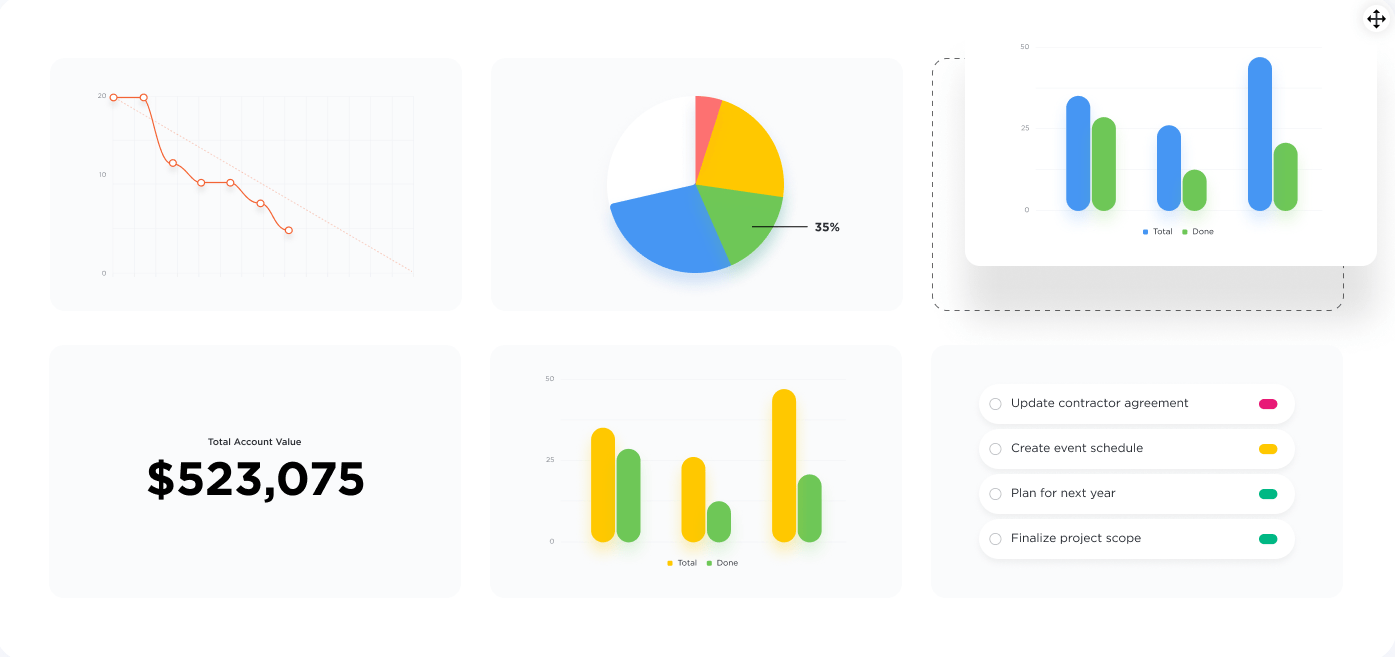
Dashboards combine different sources of information, metrics, and key performance indicators (KPIs) into a single view. They can combine text and visual widgets—pie charts, sorted lists, bar graphs—to give teams real-time data and make informed project decisions. You can build better versions of the same dashboard over time with minimal effort as KPIs shift or team members change.
👉 Follow our 5-step guide to creating powerful dashboards!
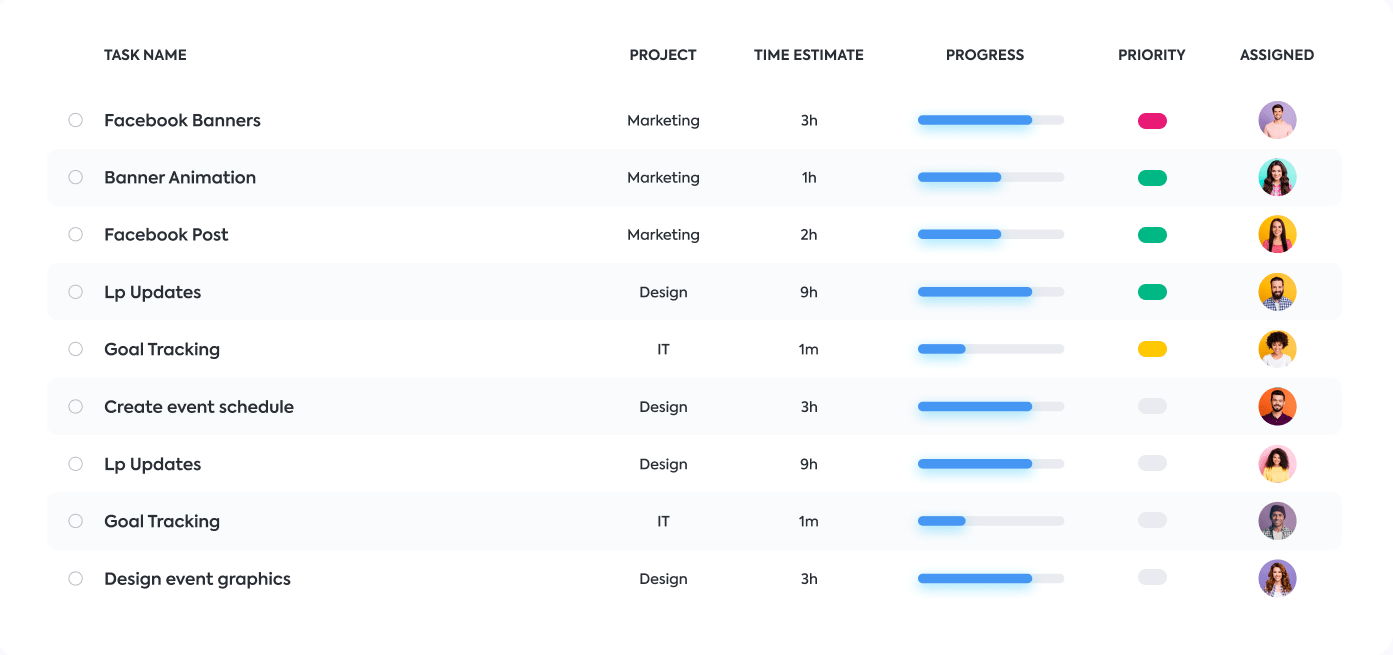
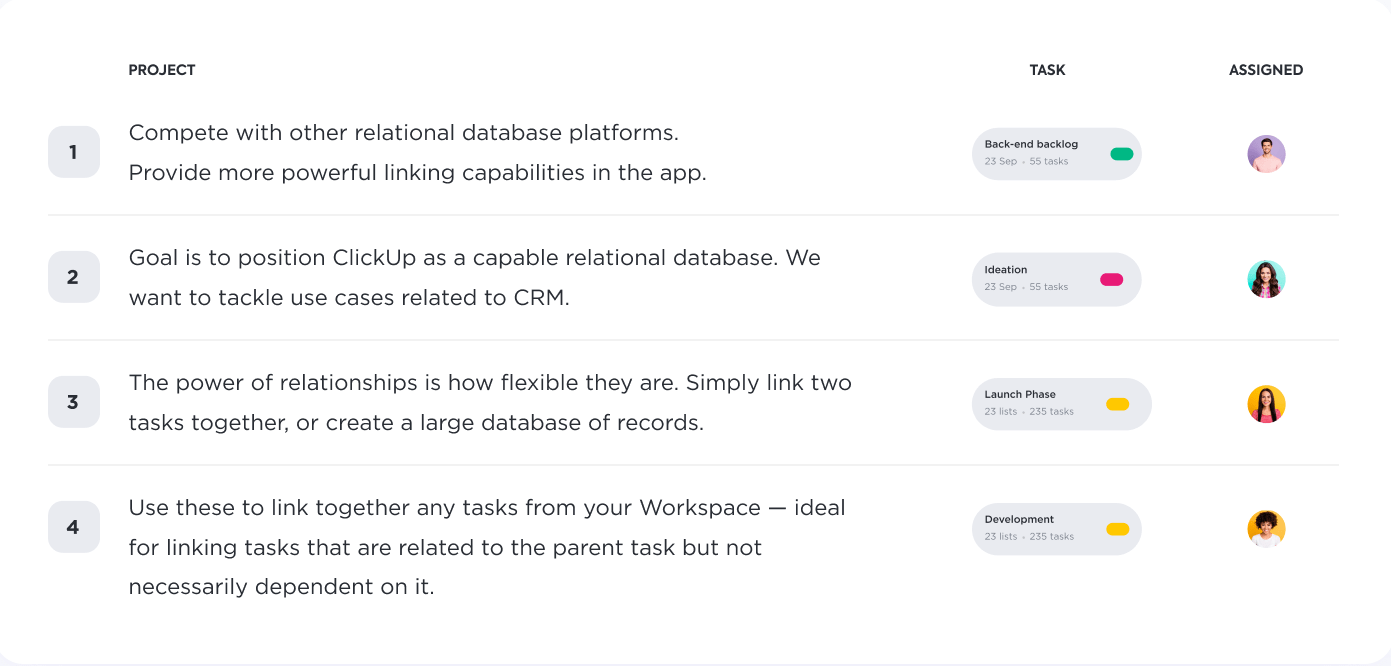
We’ve come a long way since basic Excel spreadsheets. Tables in modern project management software now come with advanced features, making it easier (and aesthetically pleasing!) for those who prefer a spreadsheet-style of management. Combined with the power of templates, teams can instantly upload information to the tool and create a comprehensive project schedule.
The weakness of using tables is evident when projects are large, complex, and involve creating elaborate formulas to collaborate with cross-functional teams. However, this won’t be an issue if you know you have the resources to assign all the data entry work!
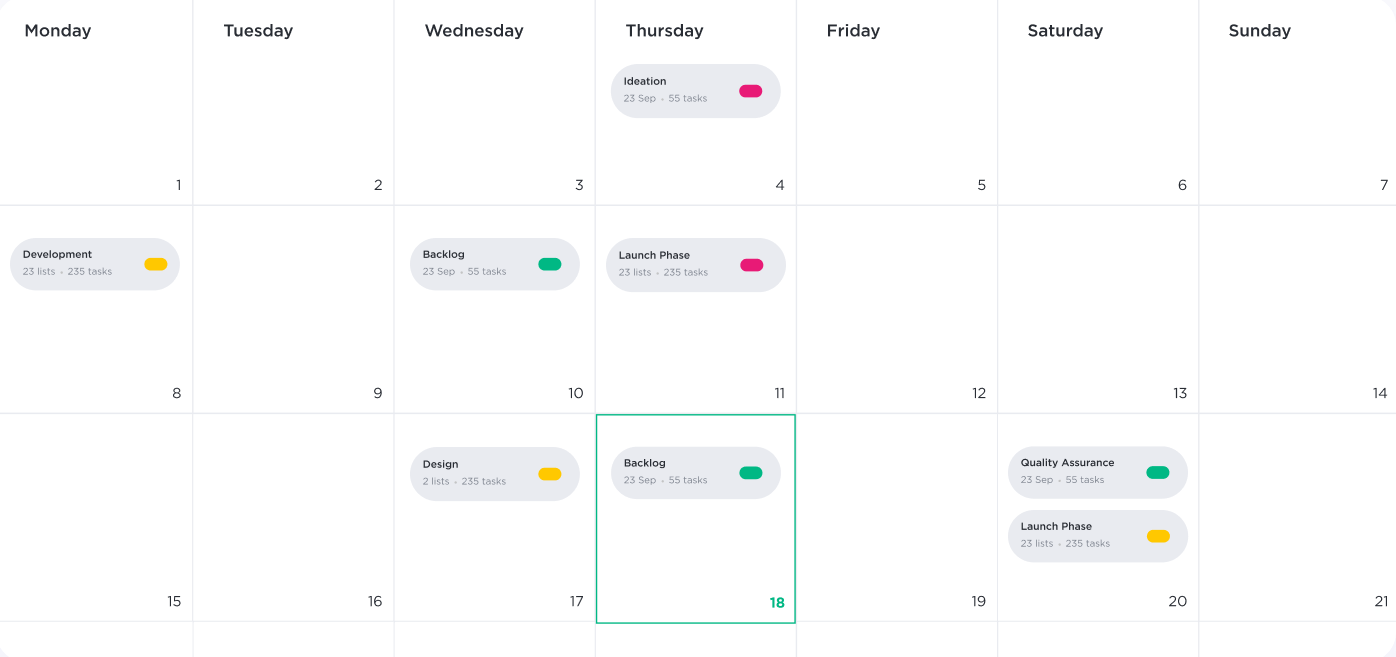
Calendars have and will always be relevant. Everyone is familiar with a calendar because it can be used for both general purposes and project management. With a calendar in front of us, we can plan and organize around other key deadlines and events to avoid overcommitting resources.
This Gantt chart alternative is versatile enough to be used in different ways: planning, resource allocation, tasks, and base templates. However, it’s best for simple projects with no task dependencies and viewing status/check-in meetings.
👉 Learn how a project calendar can support your project!
There you have it! Ten Gantt chart alternatives to give you and your team the flexibility to structure different projects. 🛠 🚀
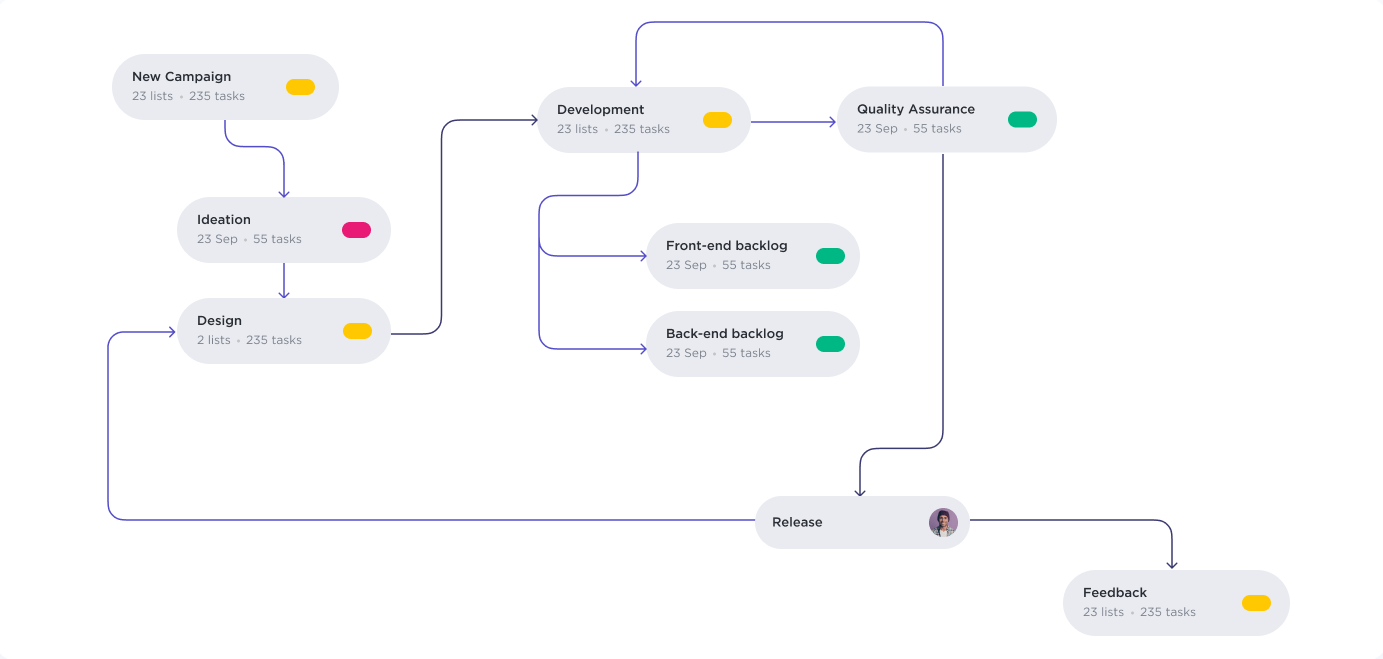
You’ve got a concept, and you’re ready to lay out all the work that needs to be done. Do you create a list? Draw a flowchart? Organize a timeline? Which tool will display your project data most accurately and compellingly?
Here are a few scenarios to narrow down your options:
| 💭 The team is in the initial planning phase | 🤝 The project has task dependencies, milestones, and cross-functional teams | 🤹♀️ The team is juggling multiple projects at once |
|---|---|---|
| ✅ Mind Maps ✅ Flowcharts ✅ Calendars❌ Kanban boards ❌ Dashboards ❌ Tables | ✅ Scrum Boards ✅ Dashboards ✅ Flowcharts❌ Whiteboards ❌ Calendars ❌ Timelines | ✅ Kanban boards ✅ Scrum Boards ✅ Dashboards❌ Whiteboards ❌ Mind Maps ❌ Timelines |
| 💰 The stakeholders want to see project scope, cost, and resource management | 🤖 The team has moderate to advanced experience with project management software | ⚡️ The team favors less structure for better collaboration |
|---|---|---|
| ✅ Dashboards ✅ Flowcharts ✅ Documents❌ Whiteboards ❌ Mind Maps ❌ Timelines | ✅ Kanban boards ✅ Scrum boards ✅ Dashboards ✅ Flowcharts ✅ Tables | ✅ Whiteboards ✅ Mind Maps ✅ Flowcharts❌ Scrum boards ❌ Documents ❌ Timelines |
The examples above confirm the choice isn’t a decorative decision, nor is it personal. Suppose your project management tool doesn’t help your intended audience retain and proactively take action. In that case, you’ll likely get off to a rocky start.
Although, who said you had to use only one tool? 🤓
Our teams at ClickUp and ClickUp users around the world prefer organizing their projects from different angles:
With a diverse set of project management tools packed into our productivity platform, you and your team will have everything you need right at your fingertips. Get started with ClickUp for free today! ⚡️

Praburam Srinivasan
Max 22min read

Manasi Nair
Max 20min read
Praburam Srinivasan
Max 24min read

© 2026 ClickUp


