Sorry, there were no results found for “”
Sorry, there were no results found for “”
Sorry, there were no results found for “”
The best WBS software works in one of two ways. It either draws a tidy tree of boxes, or it keeps that tree connected to the work after kickoff. So ask one thing: after you build the plan, does it stay put or keep changing? Your answer points to the right tool, helping you lock in clear project requirements, which research links to 97% higher project success rates.
Some plans barely move. You map the deliverables, share a clean picture, and the job is essentially finished. In this case, a straightforward diagram tool covers it.
Other plans shift constantly. Crews fall behind, or budgets move halfway through the project. For that kind of work, you need software that continuously updates the entire structure as conditions change.
The best work breakdown structure (WBS) software below spans both approaches, and we identify what each one excels at so you can match it to the way your own projects operate.
| Tool | Best for | Standout feature | Pricing* | Where it falls short |
|---|---|---|---|---|
| Microsoft Project | Complex WBS modeling in large enterprises | Auto-shifts every downstream date the moment early work slips and rolls costs and hours up each summary task, so sprawling plans stay accurate without manual cleanup | Project Standard: $679.99; Project Professional: $1,129.99 (one-time); Server Subscription: Custom pricing | Real ramp-up period; the on-premise server model suits teams with a dedicated admin |
| WBS Schedule Pro | Visual chart planning in engineering teams | Links a top-down diagram view straight to task sheets and exports clean XML into MS Project, with standalone WBS and PERT editions so you skip paying for views you never open | WBS or PERT Version: $199/license; full version: $349/license (1-4 licenses) | Export-based sharing rather than live links, so cloud-first teams pair it with MS Project |
| ClickUp | Real-time WBS tracking in scaling project teams | Turns every WBS level into a task carrying an owner, due date, dependency, and status, so progress rolls up the tree on its own with no separate schedule file to maintain | Free; paid plans start at $7/user/mo | More platform than a solo user with a one-time static chart actually needs |
| GanttPRO | Timeline-driven WBS mapping in mid-sized teams | Drag-and-drop nesting builds a visual timeline anyone can update in the browser, and a public URL shows clients progress without buying a seat | Core: $7/user/mo; Advanced: $10/user/mo; Business: $17/user/mo; Enterprise: $30/user/mo (billed annually) | Nudging one task can auto-shift every other date across the whole plan |
| Lucidchart | Outcome-focused diagramming in cross-functional teams | Builds clean visual trees anyone can open in a browser, syncs layouts with Google Sheets, and converts diagram shapes into Jira tickets | Free; Individual: $9/user/mo; Team: $10/user/mo (billed annually); Enterprise: Custom pricing | No automated scheduling logic or timeline calculations |
| MindView | Brainstorm-driven WBS planning in administrative teams | Swaps a mind map into a Gantt or timeline view with a click, and a built-in panel checks that small tasks actually add up to full project scope | MindView Suite: $340/year | Palette built for clarity over range; Gantt view takes a few weeks to read fluently |
| Canva | Visual whiteboard mapping in creative teams | Open whiteboard for flexible project maps with color-coded health blocks, in-canvas comments, and brand updates pushed across many files at once | Free; Pro: $18/user/mo; Business: $25/user/mo; Enterprise: Custom pricing | Tuned for design files, so very heavy boards run best split across canvases |
| Visual Paradigm | Text-to-WBS coding in software development teams | Write plain Mermaid or PlantUML, and it draws the WBS tree as you type, then drops the chart into Markdown pages inside a synced cloud workspace | Modeler: $72; Standard: $228; Professional: $420; Enterprise: $1,068 (billed annually) | Needs a stable connection, so fully offline teams lose access |
| Jira | Cross-functional task tracking in agile development teams | Wires each ticket to the code pipeline, maps status across boards and timelines, and stretches through 3,000 add-ons plus capacity forecasting | Free; Standard: $900; Premium: $1,850 (billed annually); Enterprise: Custom pricing | No built-in tree-structured visual WBS charts or mind maps |
| ProjectManager | Multi-view WBS tracking in distributed teams | Links Gantt, kanban, and workload views to one data pool and updates six project-health metrics as members log daily progress | Team: $15/user/mo; Business: $28/user/mo (billed annually); Enterprise: Custom pricing | Dense interface at portfolio scale; mobile app is built for status, not planning |
Our editorial team follows a transparent, research-backed, and vendor-neutral process, so you can trust that our recommendations are based on real product value.
Here’s a detailed rundown of how we review software at ClickUp.
Good WBS software needs seven things: real nesting depth, enforcement of the 100% rule, deliverable-first structure, connection to execution, a Gantt Chart handoff, spreadsheet import, and AI-assisted generation. Most tools cover two or three. The ones that cover all seven are the ones where the scope stays honest after kickoff.
Ten tools made this list: Microsoft Project, WBS Schedule Pro, ClickUp, GanttPRO, Lucidchart, MindView, Canva, Visual Paradigm, Jira, and ProjectManager. Some draw the tree; others run the work after you draw it. Every pick below gets the same breakdown.
Microsoft Project fits large teams that need a strict work breakdown structure with tight control over task dependencies. When early work runs late, it automatically shifts every date that follows. Say a city planner links road work to pipe laying. When the paving crew falls behind, Project pushes the plumbing schedule to match. That automatic tracking keeps your full timeline accurate, so you never recalculate dates by hand.
To build that structure, Project organizes work into summary tasks and smaller subtasks beneath them. Each summary folder rolls up the costs and hours from the items it contains, so you see totals at a glance. Drag a task, and you change its place in the hierarchy; open the custom sidebar, and your team edits data fields in seconds. On long, sprawling projects, this keeps the plan readable.
That structure also travels well. Because Project links to the Microsoft suite, your team can pin tasks straight to their calendars and push project details into email or spreadsheets. The same work never gets logged twice.
Where Microsoft Project falls short: The depth that makes Project strong on complex plans comes with a real ramp-up period, and most teams get there faster with a dedicated admin. The on-premise server model uses file check-in/check-out, which is a different rhythm than teams coming from cloud tools will expect.
Skip Microsoft Project if: Your team has no dedicated admin and needs people productive in the first week.
Why a G2 reviewer appreciates Microsoft Project:
The connections to the rest of the MS suite, make project an outstanding option. It pins tasks to your schedule, learn from emails, and overall the best way to connect calendar to tasks.
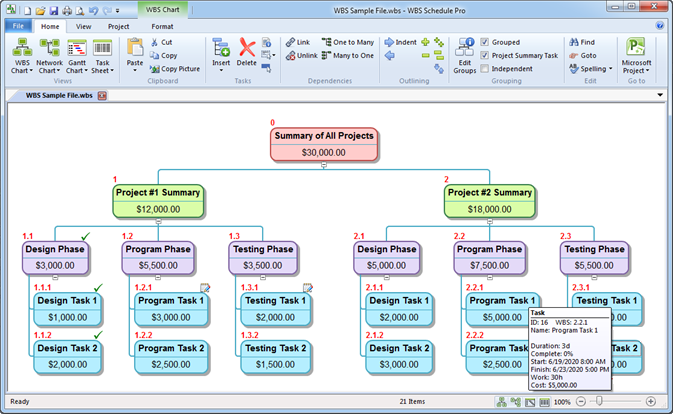
WBS Schedule Pro handles visual diagram breakdowns by linking top-down charts directly to task sheets. A project manager can map a new project by drawing major blocks in the WBS diagram view. They can then switch to the list view to add detailed resources. This structure helps teams shift between the big picture and minor details.
There are also standalone editions to lower procurement costs. If a team only needs hierarchical mapping, the WBS Version disables Gantt views. Another option is the PERT Version, which limits the workspace to network diagrams. Teams can avoid paying for formatting styles they don’t use.
This WBS tool also functions as a visual builder for other systems. Users can build their charts here and export data to Microsoft Project through XML files. This process creates clean graphics for large physical layouts and plotter prints.
Note: These are starting prices for your first licenses, and the cost rises as you add more. Already use WBS Schedule Pro (WBS Version) or WBS Schedule Pro (PERT Version)? You can upgrade to the full WBS Schedule Pro software for $150.
Where WBS Schedule Pro falls short: Reviewers describe the interface as functional rather than modern, a reasonable trade for a focused desktop tool at this price. Sharing is built around file exports rather than live links, so cloud-first teams will route work through MS Project or a browser tool.
Skip WBS Schedule Pro if: Your team relies heavily on instant web collaboration and cloud sharing tools.
What this G2 reviewer likes about WBS Schedule Pro:
Ability to switch back and forth from viewing all the different pre-canned reports. It is a solid system that let’s you work visually and in a list mode. Going back and forth between big picture and detail is made easy.
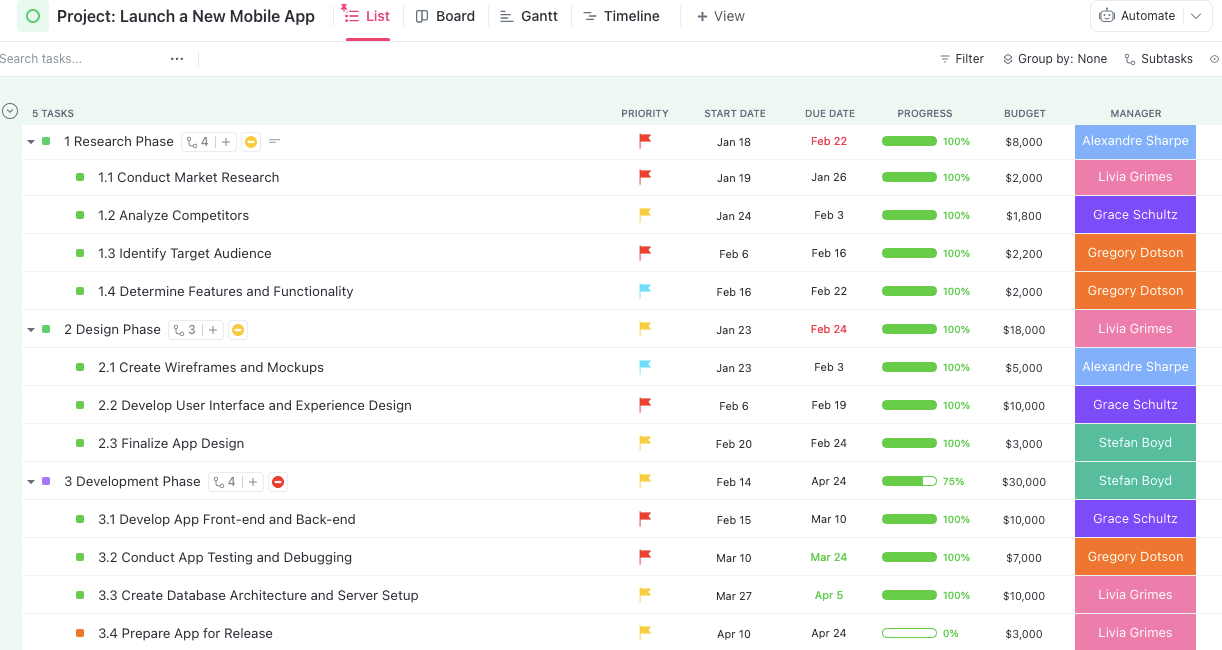
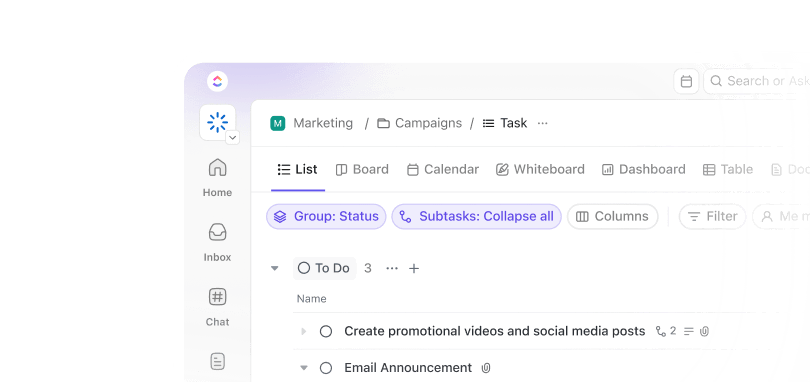
ClickUp handles WBS planning by turning every level of project scope into a task that the team works inside. The platform organizes work through a hierarchy of ClickUp Spaces, Folders, Lists, and nested subtasks that map directly onto WBS levels.
A project manager sets up Level 1 as a dedicated List, breaks Level 2 into parent tasks for each deliverable, and nests Level 3 work packages as subtasks beneath them. Every element carries an owner, a due date, a dependency link, and an auto-updating status.
Take a product team launching a customer portal. They create a List called Portal Launch and add parent tasks for each major output, like login, billing, dashboard, and help docs. Then break each one into subtasks that team members can pick up.
Tag every item with its WBS code (1.1, 1.2.3) using ClickUp Custom Fields, so progress rolls up to the parent on its own. This way, the team always sees how each deliverable stands in real time. Spot which work packages block others downstream by opening a Gantt Chart View of that same List.
Where ClickUp falls short: The platform offers more power than a solo user with a short checklist needs. Teams coming from a single-purpose charting tool may need a few days to set up their workspace before it feels natural.
Skip ClickUp if: Your project only needs a static visual chart for a one-time proposal, with no plans to track the work after delivery.
This G2 reviewer shared their feedback on ClickUp:
The Space > Project > List & other view formats hierarchy is very helpful to manage multiple projects at the same time. It’s really customizable and integrates well with other software, like Microsoft 365 apps, HubSpot, Figma, and more.
I’m starting to explore Brain 2 and the concept of having the LLM available where you do work + with full context of your and your team’s work, sounds like a no-brainer.
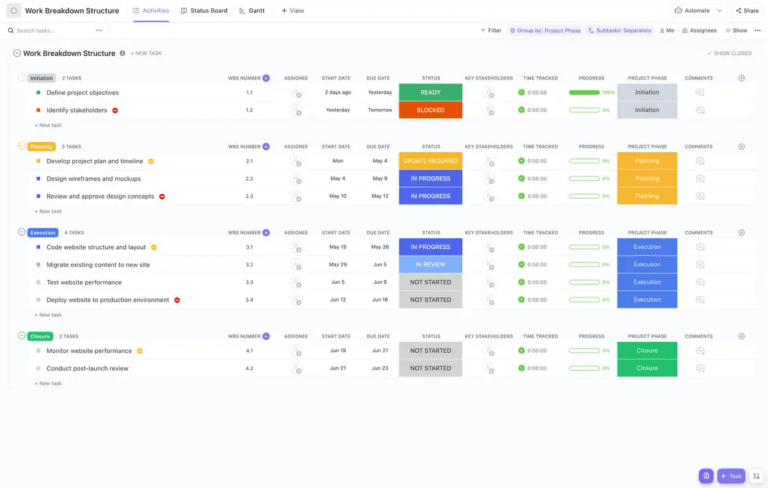
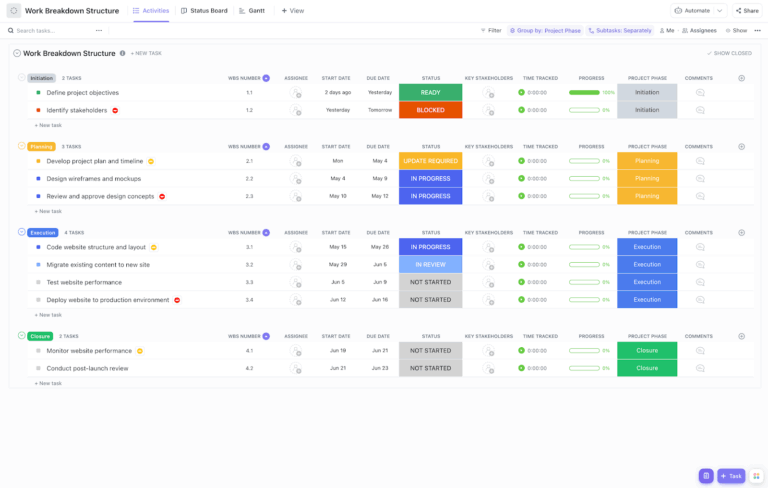
Use a ready-made WBS template and skip the blank-page problem entirely. The ClickUp Work Breakdown Structure Template comes pre-built with Custom Statuses, fields for budget, project phase, and remaining effort hours, plus five ready views. Import it into any Space and start assigning work packages in seconds instead of building the hierarchy from scratch.
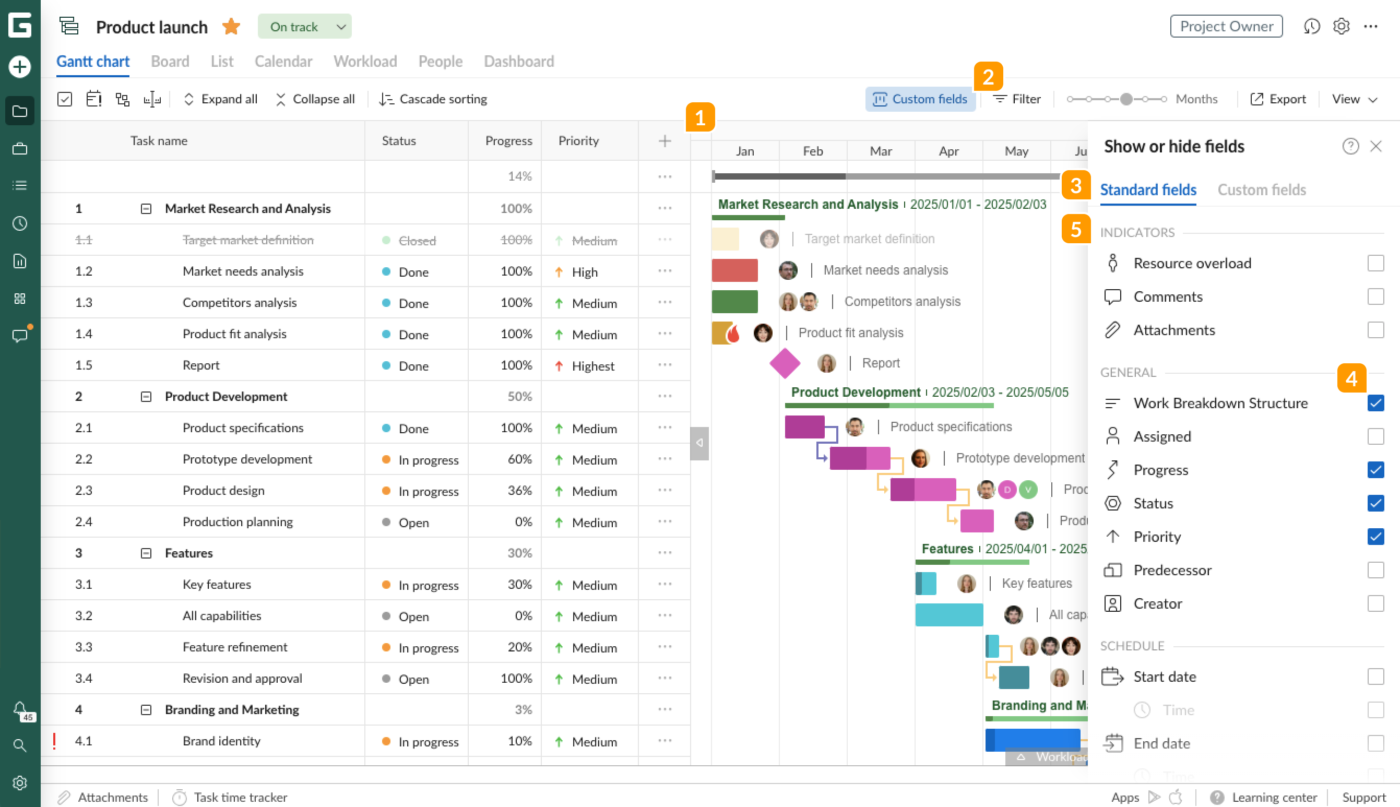
GanttPRO is a browser-based scheduling tool that breaks big goals into deeply nested subtasks. Take a marketing agency planning a 14-month rebrand for a retail client. The manager adds “Brand identity” as a Level 2 deliverable, then nests logo system, packaging refresh, and in-store signage beneath it, each with its own work packages. Drag the parent bar, and the whole branch moves with it.
That nesting happens on the timeline itself, so a multi-year program splits into quarterly milestones in minutes. Priorities, due dates, and reference files all live on the same screen, and dynamic dashboards keep every team member looking at one set of deadlines. Resource costs sit inside the task structure, so budget rolls up alongside the schedule.
Sharing reaches past your own team. The agency manager spins up a public URL and sends it to the retail client, who watches progress in real time without buying a seat. For agencies and consultancies reporting to external stakeholders every week, that one link replaces a recurring status deck.
Where GanttPRO falls short: Dependency logic is aggressive by design, so moving one task to a weekend can cascade start and end dates across the plan. That’s what you want on a live schedule and disruptive while you’re still drafting, so most teams set dependencies after the structure settles.
Skip GanttPRO if: Your team requires highly customized workflows or extensive text formatting controls before exporting reports.
What this G2 reviewer thinks about GanttPRO:
Honestly, the best part about GanttPRO is how it handles dependencies without making things over-complicated. In my day-to-day work, things shift constantly, and being able to drag one task and have the entire timeline adjust automatically is a huge lifesaver. It’s a lot more intuitive than fighting with a spreadsheet all day.
If your team needs to map project outcomes, Lucidchart builds clean visual trees. It’s a cloud-based tool that converts deliverables into clear hierarchies. Anyone can access these diagrams from a standard web browser.
Take an engineering group mapping their senior design project: they work right on the canvas, click to duplicate boxes, and organize tasks in seconds. Link the file to Google Sheets, and the layout updates itself whenever the numbers change.
Once the map is ready, it becomes more than a picture. Connect it to your engineering trackers, and Lucidchart turns the diagram shapes into active Jira tickets. Development starts straight from the visual you just built. And when you need to share it outside the tool, Lucidchart exports the finished chart to a high-quality PDF.
Lucidchart vs. Lucidspark for WBS
Lucidspark is Lucid’s whiteboard half: use it to brainstorm deliverables and project scope as sticky notes, then export the board straight into Lucidchart rather than rebuilding it. Lucidspark discovers the work; Lucidchart documents it as a stakeholder-ready tree.
Where Lucidchart falls short: Bulk editing favors shape colors over typography, so font-size changes across a large tree happen shape by shape. Performance is strongest on focused diagrams; very large canvases with many simultaneous editors run heavier.
Skip Lucidchart if: You need automated scheduling logic and timeline calculations, which is a different category of tool.
See what this G2 reviewer likes about Lucidchart:
I appreciate that Lucid Visual Collaboration Suite is an easy and free way to create WBS charts. It’s got an intuitive interface which makes moving things around and duplicating items simple, and I can change colors and fonts easily. I also like the option to export graphs to high-quality PDF files, and the initial setup is very straightforward, requiring just a quick login.
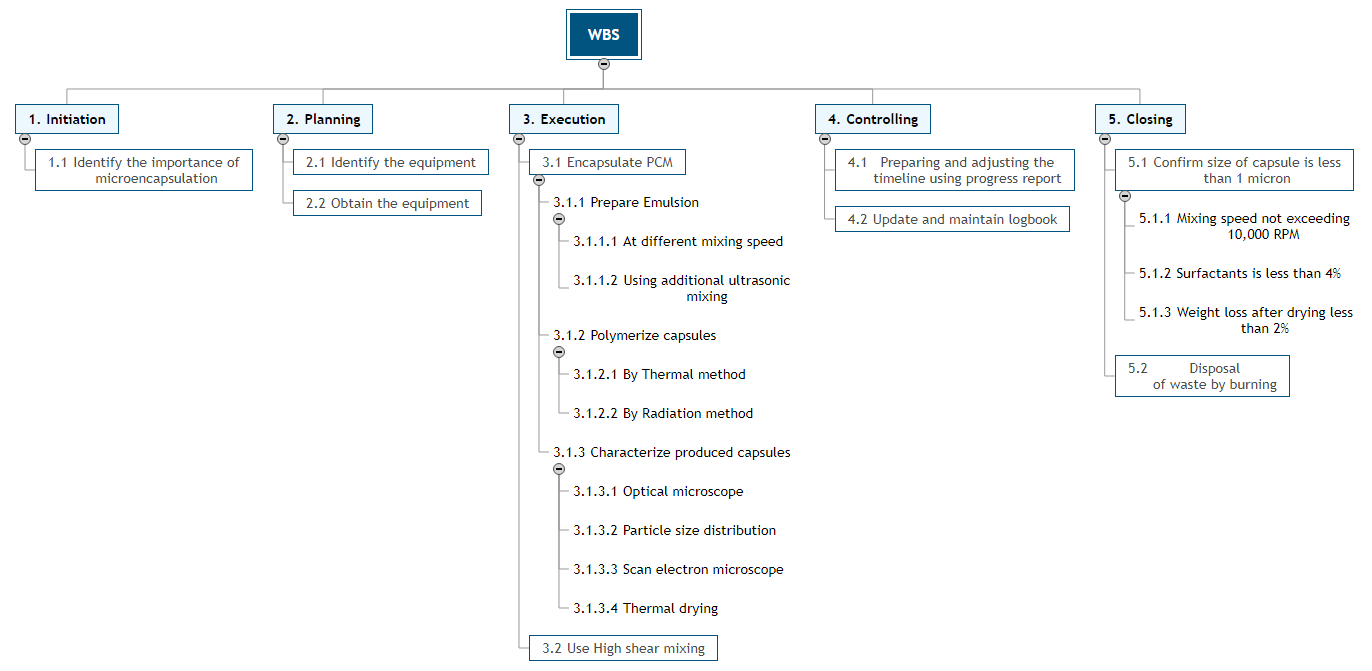
MindView turns digital mind maps into clear project schedules. The tool replaces paper sticky notes with a visual tree, which makes it useful in the messy first meeting where scope is still an argument rather than a plan.
Take a proposal team at a government contracting firm responding to an RFP. They open a blank map, branch out the required response sections (technical approach, past performance, pricing narrative, compliance matrix), then assign a writer to each branch directly on the node. Meanwhile, the software calculates total work using a built-in panel. This step ensures small tasks add up to the main project scope.
This WBS software offers six interchangeable layouts to show data to partners. Users can also swap their visual map into a built-in Gantt Chart or project timeline view. This move puts your data into active tracking, so you won’t re-type text.
Where MindView falls short: The Gantt view takes a few weeks to read fluently if you’re coming from a dedicated scheduling tool. The color palette is built for clarity over range, which suits internal planning better than design-led client decks.
Skip MindView if: Your maps double as presentation assets and need deep color control.
Hear about MindView from this G2 reviewer:
The editing features are straightforward. We can use this in meetings and share across our administrative team. This also gives a solid presentable to the Business Development team in our weekly meetings. We can track who needs to gather information and assign responsibilities or contacts to staff to keep us on track for a concise proposal or contract document.
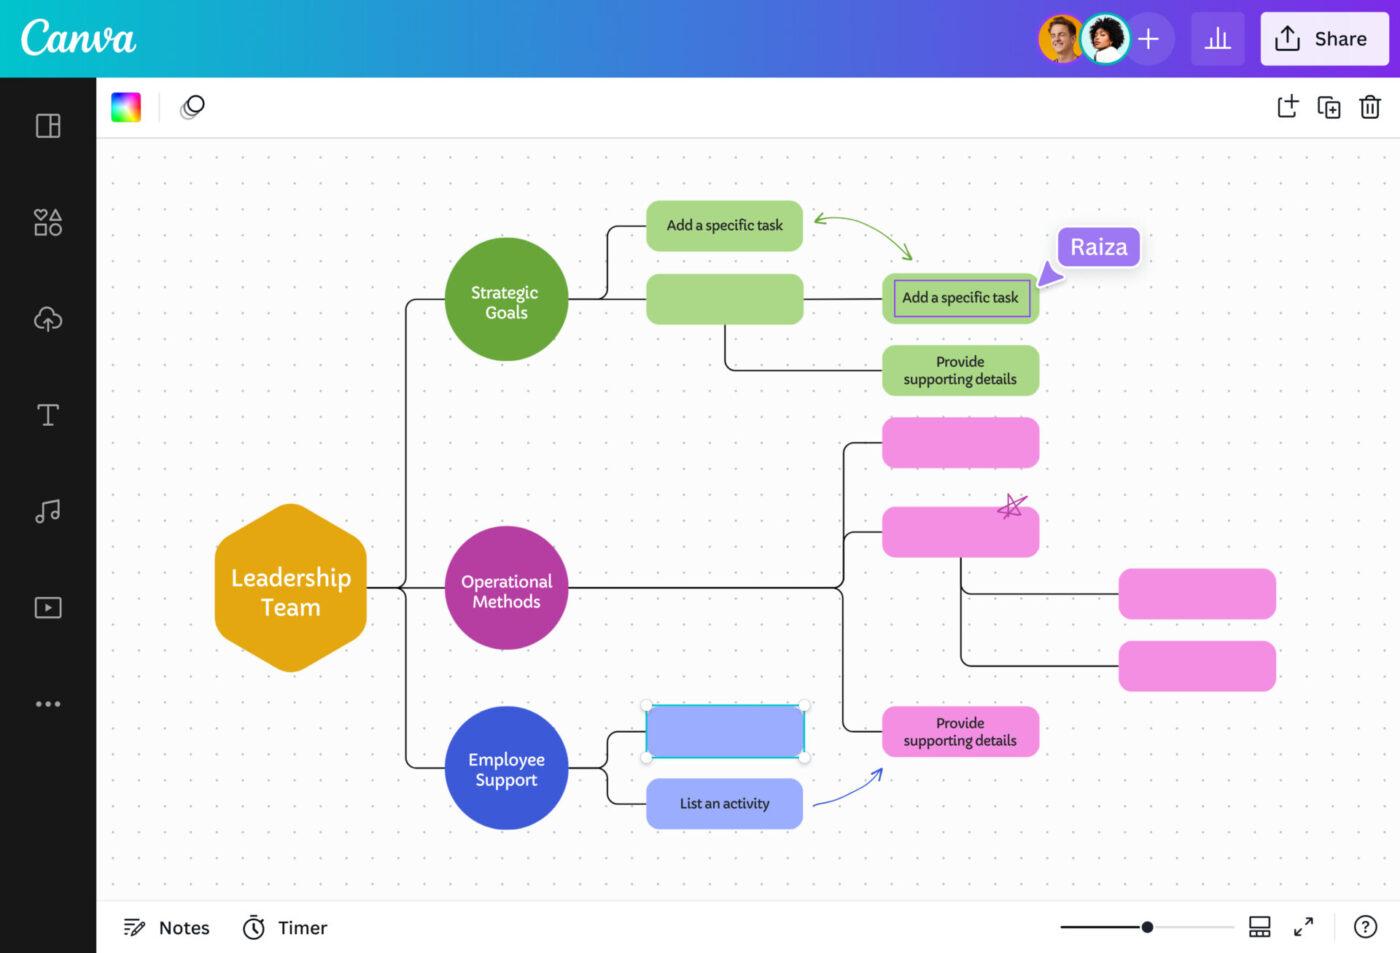
Canva Whiteboards gives teams an open canvas to build project maps without rigid lines or a fixed hierarchy. That looseness is the point: early scoping conversations rarely fit into a template.
For example, a marketing leader can quickly build a launch plan using simple shapes. The system lets team members color blocks to show project health. Delayed parts turn red, while on-track items stay green. Distributed teams can drop virtual notes and tag workers in comments. This keeps feedback inside the design file to reduce extra chat messages.
The whiteboard connects to the rest of Canva, which is where it earns its place for creative teams specifically. When the client shifts a campaign goal, a brand kit update pushes new text styles and colors across every asset at once. The finished map embeds into decks and docs for stakeholder review.
Where Canva falls short: The editor is tuned for design files, so boards heavy with layers or embedded video run best when split across several canvases. Layout controls are approachable rather than precise, and teams needing exact vector work may need to switch to dedicated design software.
Skip Canva if: Your team requires strict vector tools or layered files for Adobe programs.
Check out this G2 reviewer‘s experience with Canva:
It’s free, simple, and easy to use. Unlike the complexity of most Photoshop tools, I find Canva to be much simpler and more straightforward. I like its intuitive drag and drop interface which makes creating professional looking designs quick, even without graphic design experience.
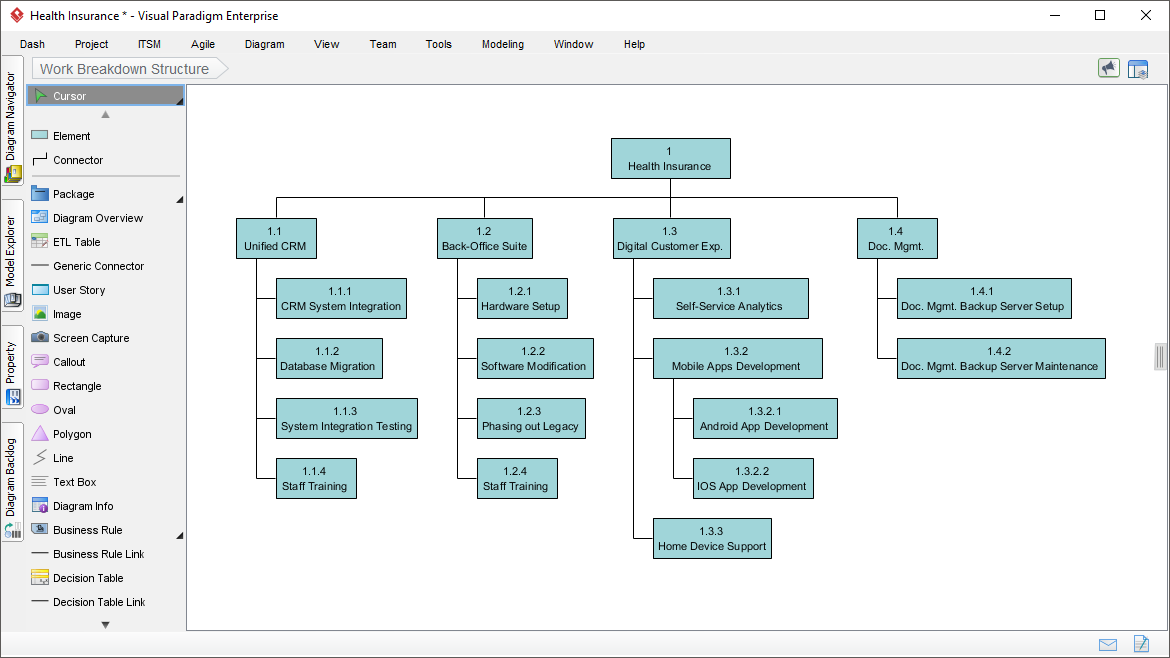
Visual Paradigm was built to connect desktop engineering tools with web collaboration spaces. Its in-house tool, VPasCode, is for developers who prefer text-to-chart setups. Teams can write plain code using Mermaid or PlantUML rules to build a WBS block graph fast. This text layout reduces manual shape dragging to keep documentation moving.
For example, a software lead can write technical rules for a billing tool inside the code editor. The tool draws the chart trees on the side of the screen as they type. Teams can save these files inside a shared cloud drive that syncs across web browsers and local computer tools.
The OpenDocs tool also lets teams drop these charts right into Markdown pages. This design keeps software needs and auto-updating diagrams connected inside one workspace. It helps remote groups coordinate tech designs from a single workspace.
Visual Paradigm sells its desktop app in two different ways, and you pick one:
Subscription = you pay every year and keep getting updates.
Perpetual = you pay once, own that version forever (updates only for year one).
Where Visual Paradigm falls short: The interface gets slow when rendering huge or complex project maps. Connector placement may need manual correction on dense diagrams.
Skip Visual Paradigm if: Your team works offline or on unreliable connections.
See what this G2 reviewer appreciates about Visual Paradigm:
Visual Paradigm Online makes creating professional diagrams remarkably straightforward, thanks to its intuitive drag-and-drop interface. I also appreciate the real time collaboration features, which make working with remote teams both seamless and efficient. Furthermore, the fact that it is a cloud-based platform is a major benefit, as it enables me to access my projects from anywhere—a convenience I truly value.
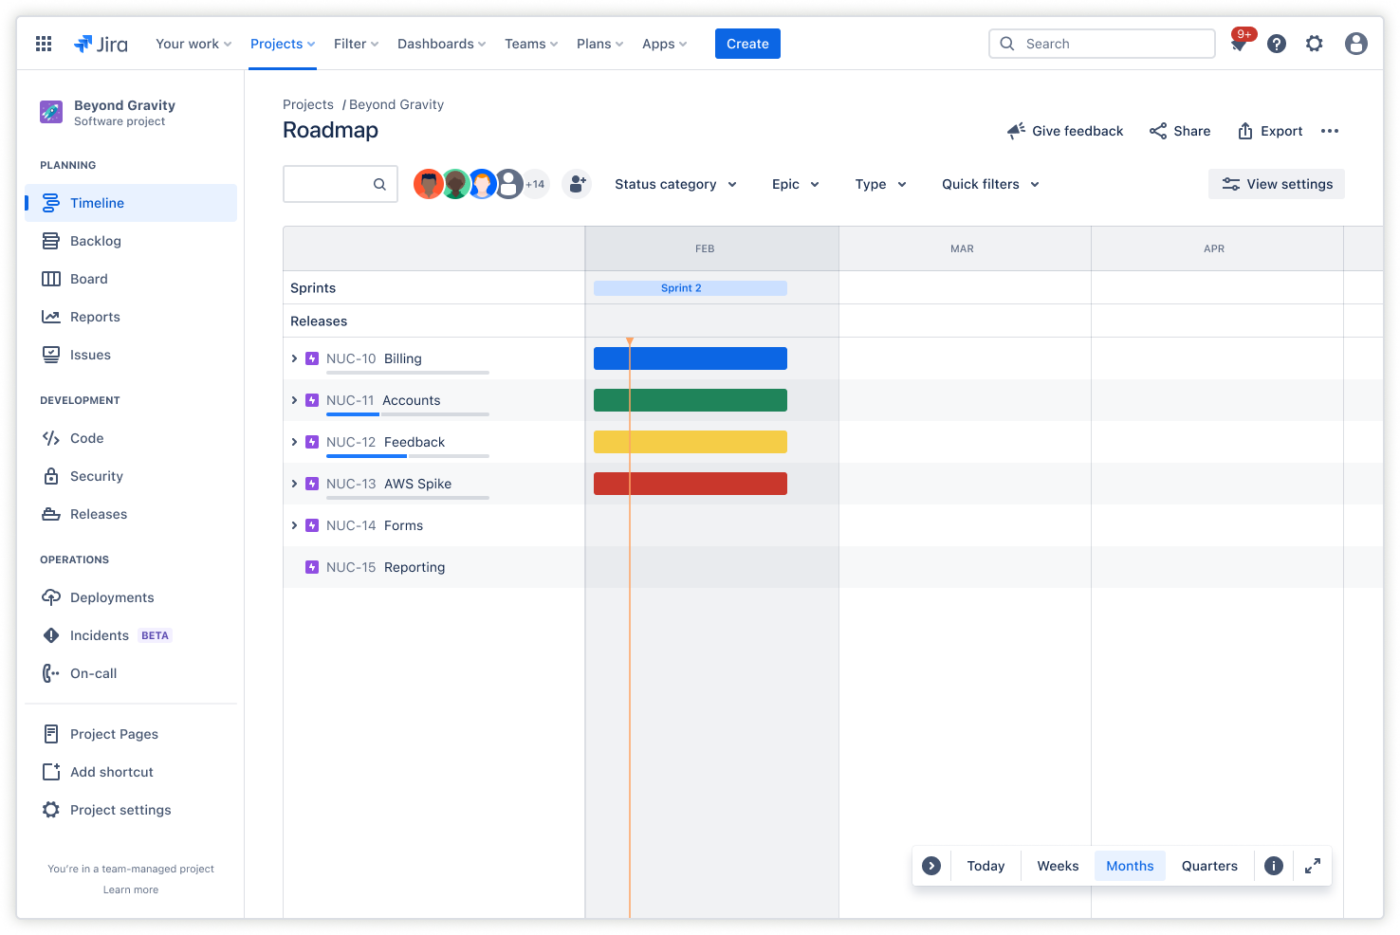
Jira fits teams that track software sprints, connecting each ticket straight to their code pipeline. Work and progress stay in one place. It maps status changes across boards, lists, and timelines, and IT admins can build custom fields that match how a specific team actually works.
Picture a consulting group running client help tickets during a launch. When the task nears its due date, Jira alerts whoever owns it. That live tracking means you stop calling meetings just to ask where things stand.
The platform reaches well beyond your own setup, too. It links tasks to outside tools through 3,000 add-ons. And premium plans add capacity views that show team workload across every project. From there, managers build quick scenarios to forecast the best and worst paths before committing to a plan.
Where Jira falls short: Atlassian iterates on the UI regularly, so established workflows need periodic revisiting. CSV exports carry issue data cleanly but leave comments behind unless an admin configures it, worth knowing before you rely on exports for reporting.
Skip Jira if: Your team requires traditional, tree-structured visual WBS charts or mind maps built directly into the core user interface.
Hear about Jira from this G2 reviewer:
What I like best about Jira is its ability to bring structure and visibility to complex workflows. It makes it easy to track tasks, bugs, and progress across a team in a very organized way. Features like customizable boards (Scrum/Kanban), detailed ticketing, and clear status tracking help everyone stay aligned on priorities and deadlines.
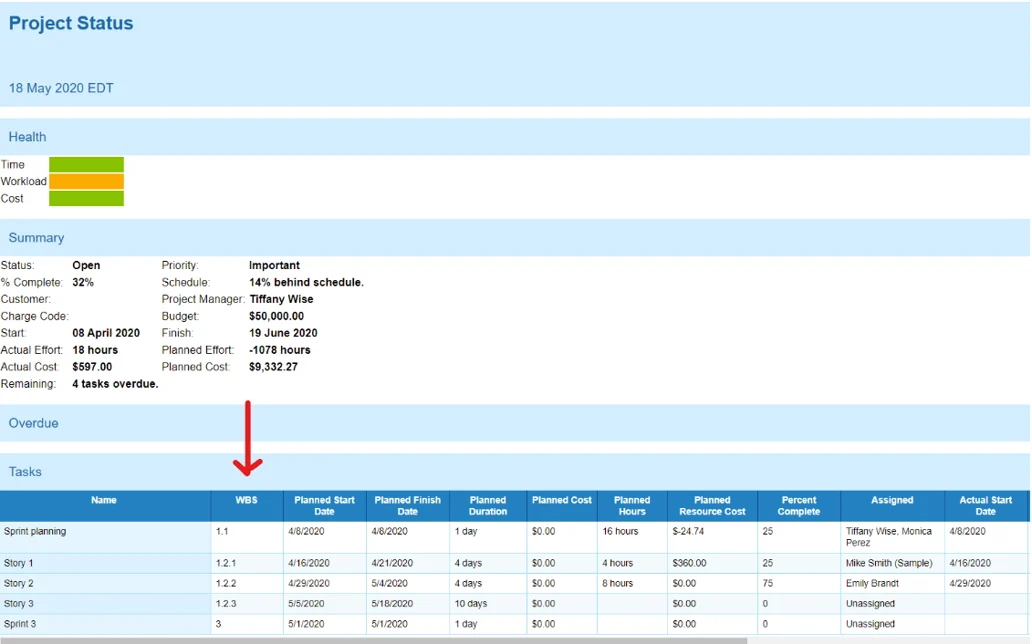
Built to serve teams with different work styles, ProjectManager links separate views to one data pool. Engineers can track task paths on a Gantt timeline. Creative teams can view those same tasks on kanban boards. This setup prevents communication gaps between groups.
For example, a manager can set a baseline after adding task costs and hours. As team members update their daily progress, the system changes six health metrics. This calculation helps you spot project delays fast, eliminating the status-check meeting.
Taking the breakdown ahead is straightforward. The tool imports legacy Microsoft Project plans and Excel sheets, so you don’t need to rebuild an inherited WBS from memory. Deadlines sync with Google tools, and updates push to Slack channels, keeping remote crews current without a standing call.
Where ProjectManager falls short: The interface carries a lot at once, which is the cost of connecting six views to one data pool, and gets denser as your portfolio grows. The mobile app is built for logging progress and checking status rather than reproducing the desktop experience.
Skip ProjectManager if: Your team only needs simple task checklists without advanced tracking data.
This G2 reviewer shared what they like about ProjectManager:
What I Like most about ProjectManager how easy it is to track task and manage team collaboration in one place. The dashboard and real time updates stay on top of progress without constantly following up. It really simplifies planning and keeps everything organized.
Whether a WBS software qualifies as a diagram tool or a complete system depends on what happens after kickoff.
Drawing tools (Lucidchart, Canva, Visual Paradigm) produce a chart you present once, then retype into a task tracker to start real work. Execution platforms (ClickUp, Microsoft Project, Jira, ProjectManager) keep the breakdown itself as the plan. In this case, owners, dates, dependencies, and status sit on the same tree you decomposed. The first type goes stale the moment work starts; the second updates as conditions change.
The failure shows up as a second copy. You draw a clean three-level WBS, hand it off in a meeting, and open a separate tool to assign the actual tasks. By week two, nobody touches the diagram because the real work has moved. The WBS becomes fiction, and scope drifts without anyone noticing. A Work Breakdown Structure system should never sit as a static document because deliverables shift, budgets move, and the breakdown has to move with them.
The deeper cost is lost traceability. When the WBS lives apart from execution, you lose the thread that connects each deliverable back to the business need that justified it. Elizabeth Larson, PMP and CEO of Watermark Learning, explains this for PMI:
Without traceability, scope creep is usually rampant, surprises are common, defects are the norm, and the resulting rework often extends the project schedule and increases the budget.
PMI’s own Pulse of the Profession data backs this up: 47% of unmet project goals trace directly to poor requirements management. And 5% of project dollars go to waste when teams lose that connection between what they approved and what they deliver.
A worked example makes the split concrete. Take a B2B SaaS customer portal launch, broken down deliverable-first:
In a diagram tool, that tree is a slide you present during kickoff. In an execution platform, each Level 3 package carries an owner, a due date, and a dependency, and progress rolls up to Level 1 automatically. Same breakdown, same three levels, but only the second version tells you on Tuesday whether ‘billing integration’ is on track or blocking the launch.
Here is how our team builds that breakdown in ClickUp:
The decision comes down to what happens after the breakdown is built. If it stays a picture, pick a diagram tool. If it becomes the plan your team executes, pick a platform that tracks owners, dates, and status on the same tree. Here’s the shortcut by scenario.
When a WBS software is the wrong tool entirely: Not every project needs a formal hierarchy. Agile work with deliberately fluid scope goes out of date by the second sprint, and a prioritized backlog serves better. A three-person, four-week project rarely needs decomposition at all; a deliverable-organized task list does the same job with less setup.
What comes after the WBS: The breakdown defines scope, not schedule. Once you finish decomposing, the work moves into sequencing, ownership, and tracking. That’s where a project management chart picks up the timeline, and a resource breakdown structure maps who delivers what.
Ready to turn a static breakdown into a plan your team runs? Get started with ClickUp for free.
The 8/80 rule is a sizing guideline: a work package should take no fewer than 8 hours and no more than 80 hours of effort. Anything smaller is micromanagement; anything larger should be decomposed further. It’s a rule of thumb, not a hard limit, and works alongside the 100% rule to keep packages estimable.
The project manager owns the WBS, but it’s built with the project team and subject-matter experts during the planning phase. Involving the people who will do the work produces more accurate decomposition and buy-in on scope. The finished WBS becomes part of the project scope baseline.
Yes, several tools now draft a first-pass WBS from a project brief, including ClickUp Brain, Lucidchart’s AI diagramming, and Canva’s Magic Design. Treat the output as a starting point, not a final plan: AI is good at proposing a deliverable tree but can’t enforce the 100% Rule or judge whether the scope is complete.
Yes, you can build a basic work breakdown structure in Excel using an indented outline or a numbered hierarchy. It works for small, simple projects and costs nothing to start. The limitation is that a spreadsheet does not track dependencies, ownership, or progress well, so most teams outgrow it and import the WBS into dedicated software as the project scales.
The five steps of WBS: define the project scope and end deliverable; identify the major deliverables at Level 2; decompose each deliverable into smaller components; break those down into work packages small enough to estimate and assign; and document each element, often in a WBS dictionary. The guiding principle is the 100% Rule, where every level captures the full scope of its parent.
WBS software helps teams build, organize, and manage a deliverable-based project hierarchy, turning project scope into a structured work breakdown. It ranges from diagramming tools that draw the chart to full project platforms where each WBS element carries an owner, a date, and a status. The best WBS software keeps the breakdown connected to the actual work.
A work package is the lowest level of a WBS: a deliverable small enough to estimate for cost and duration and assign to a single owner. It’s where planning stops and execution begins, because each package can be scheduled, budgeted, and tracked on its own. Packages roll up into the deliverables above them.

Manasi Nair
Max 27min read
Manasi Nair
Max 24min read
Manasi Nair
Max 30min read

© 2026 ClickUp