
Interested in learning about Gantt chart milestones?
We’ve all seen milestones at some point.
And while the ones that you usually see on a highway are becoming obsolete, Gantt chart milestones are definitely here to stay.
When you’re plotting a Gantt chart, milestones mark important points along your project timeline. These could signal the start or end date of a project phase or highlight any other key events.
They’re crucial checkpoints that let you know if your project is on the right track and you aren’t going off-course!
In this article, you’ll learn what Gantt chart milestones are, their benefits, and how to use them with a project management tool.
This Article Contains:
Let’s begin.
What Are Gantt Chart Milestones?
Gantt chart milestones are checkpoints used to specify important points along your project schedule when it’s visualized on a Gantt chart. The data points can be essential dates and deadlines, start and finish points, or other key events in your project.
So is a task considered a milestone in a Gantt chart?
Nope.
A task and a Gantt chart milestone are two entirely different concepts.
And since milestones and checkpoints sound like something out of a video game, let’s use one to illustrate this point.
For example, let’s say you’re playing a zombie apocalypse game where a Gantt chart highlights your game progress.
Now that’s a fun activity!
The project tasks on this Gantt chart would represent things like destroying zombies, collecting awesome power-ups, heroically saving people, etc.
On the other hand, a milestone in this Gantt chart would show every level you clear in the game. For example, let’s say you’ve collected enough points to eliminate the zombies for good. That’s a milestone in the game as it’s a key event marking significant progress.
Why use a Gantt chart?
If you’re a project manager, a project’s success largely rests in your hands.
You’re in charge of:
- Deciding who does what, when, and how
- Ensuring that project activities stay on track
- How much money and time is spent on a completed task
- What pizza your team gets to order when celebrating completion
Phew, no pressure at all!
One way to stay ahead of the schedule is to be an oracle.
Predict the future and act accordingly. Easy.
But are you an oracle?
Yeah, didn’t think so.
So your next best choice is to go for a project management tool like a Gantt chart.
A Gantt chart is a type of bar chart that highlights project progress over time with every task represented by a horizontal bar, each having varying lengths based on task duration.
Here’s what it looks like:
Why not use a milestone chart instead?
A milestone chart only shows you the end date for completing a task or for achieving particular objectives.
Since that alone is insufficient to account for a project’s assignees, dependencies, and other key parts, it’s best to create a Gantt chart with milestones for efficient project management.
How do you create a Gantt chart?
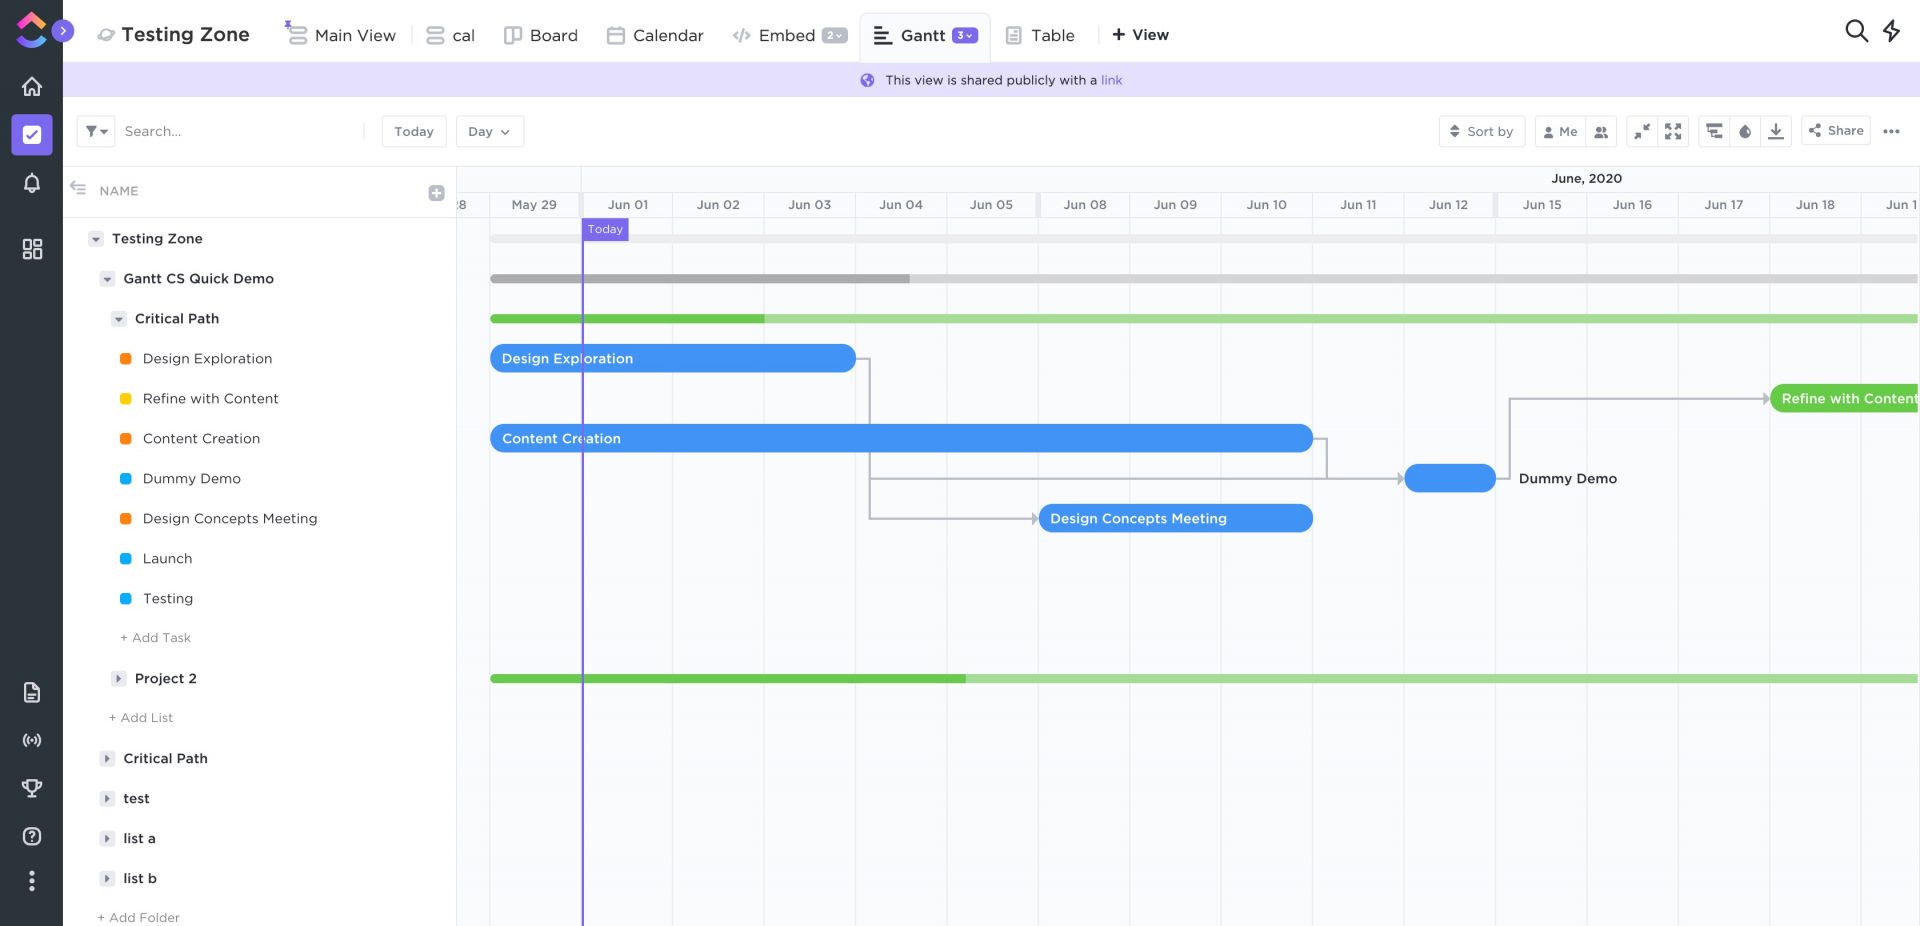
To create a beautiful and simple Gantt chart that is also fun to use, use ClickUp’s Gantt Chart view.
ClickUp’s online Gantt chart software offers you a complete view of your entire project plan.
With ClickUp, you can:
- Instantly identify a dependent task (a task dependency is shown using arrows between two tasks)
- Check the task duration by referring to the calendar displayed on the X-axis
- Visualize the work breakdown structure
- Instantly move projects and task dependency chains on your Gantt chart with the Reschedule Dependency feature
- Remap the start date and end date automatically when you make schedule adjustments
- Identify the critical path for any group of tasks
No matter what you throw at it, ClickUp’s Gantt charts can handle it all!
Bonus: See some more examples of Gantt charts and learn more about using Gantt charts.
Why Use Gantt Chart Milestones?
We’ve now discussed what a project milestone is when you’re using a simple Gantt chart.
And sure milestones are cool, but what are the real benefits of using them in your Gantt chart?
Here are the 5 key benefits of using Gantt chart milestones:
1. Gives you a bird’s eye view of your project timeline
As a project manager, you have a thousand things going on.
From resource allocation to deadlines, there’s a lot to handle.
But when a stakeholder wants a quick update on the project status, you can’t ask them to wait while your IT team tries to make sense of everything. It’s one of the easiest ways to get them annoyed. And if there’s one thing we can all agree on, it’s that you don’t want angry clients!
Instead, by using Gantt chart milestones, you get a high-level understanding of how the project progresses, and what key event has just been completed.
Remember, you can easily add a milestone directly to your ClickUp Gantt chart to break up distinct sections of your project timeline. This way, you’ll know the project status in an instant, helping you manage stakeholder expectations better.
Learn more about the differences between timelines and Gantt charts.
2. Identifies project bottlenecks easily
Since Gantt chart milestones spotlight crucial deadlines, analyzing the task list under each milestone can help you deal with bottlenecks before they snowball.
For example, if you’re working on a software project, a feature that’s complicated to develop can stop you from producing a key deliverable on time.
With Gantt chart milestones, you can quickly identify these tasks that weigh you down.
Once a bottleneck task is identified, alert the team members about that individual task, and take corrective action to get your project back on track.
Oh, and in ClickUp’s Gantt Chart, you just have to drag the delayed bottlenecked task to a new schedule, and all the other dependent tasks will be automatically rescheduled!
Additionally, the critical path feature helps you verify if the bottleneck task is essential to complete the project on time. If it’s not a critical task, you can probably skip it for the time being and focus on meeting your deadlines.
3. Breaks down the project into manageable phases
Your project might constitute big chunks of work, making the project plan seem quite intimidating.
Breaking down your project timeline into distinct and achievable milestones on the Gantt chart makes it simpler to work on. Having the entire task list on your Gantt chart split into easily identifiable parts, or milestones, makes the work cut out for you seem less daunting.
Bring it on, we ain’t afraid of a bunch of Gantt chart tasks!
4. Keeps your team motivated
Your team is under tight deadlines, expectations are at an all-time high, and work activity is more complicated than ever.
That’s why celebrating your project progress matters.
And while crossing off a completed task is a joy, achieving a milestone on your Gantt chart, such as a product launch, is a significant step towards completing the project. And that deserves a toast!

Use the ClickUp Gantt chart milestones to appreciate your team for all the project tasks they completed, those long nights they pulled, and the crazy requirements they dealt with.
The sense of accomplishment you feel with each completed project milestone will motivate your team to tackle the next Gantt chart milestone.
5. Nurtures a sense of accountability
Having milestones sets clear expectations for the team and provides a basis for accountability.
Everyone in the team comes to accept that the project rests on their shoulders, and they take ownership of each task bar under the milestones. If a project milestone isn’t adequately met, the project gets delayed, and the team leader is responsible.
Tip: In ClickUp, you can assign tasks to one individual, multiple members, or an entire project team, helping you keep tabs on everyone’s work allocation.
How Do I Create A Gantt Chart In Excel With A Milestone?
Sure, you can create a Gantt chart on Microsoft Excel and add milestones to it.
MS PowerPoint and Word also let you do that.
But remember, applications like PowerPoint or Excel don’t contain a built-in Gantt chart template to start with. They need to be downloaded separately.

And once you’ve inserted the template, you’ll have to manually create a task list, add the table data to the Gantt chart, and then format it according to your schedule.
You’d then have to manually identify which task qualifies as a dependent task and add your milestones to the template.
As if managing projects weren’t tricky enough! All this effort to create a Gantt chart?
Might as well tear your hair out in frustration!

Learn about why choosing Microsoft Excel for project management is a far worse idea than ‘new coke’ check out this article.
What’s The Best Way To Create Gantt Charts And Add Milestones?
Simple.
Just create a Gantt chart using ClickUp, the project management tool that also doubles up as a fully-fledged Gantt chart software.
Here’s how easy it is to create a Gantt chart in ClickUp:
- Identify crucial ClickUp tasks within your project plan
- Determine task relationships, like task dependencies
- Input the task list into ClickUp’s Gantt chart software
And voila, you have yourself an interactive Gantt chart!
Let’s now get on with using the Gantt Chart view to mark milestones for your project.
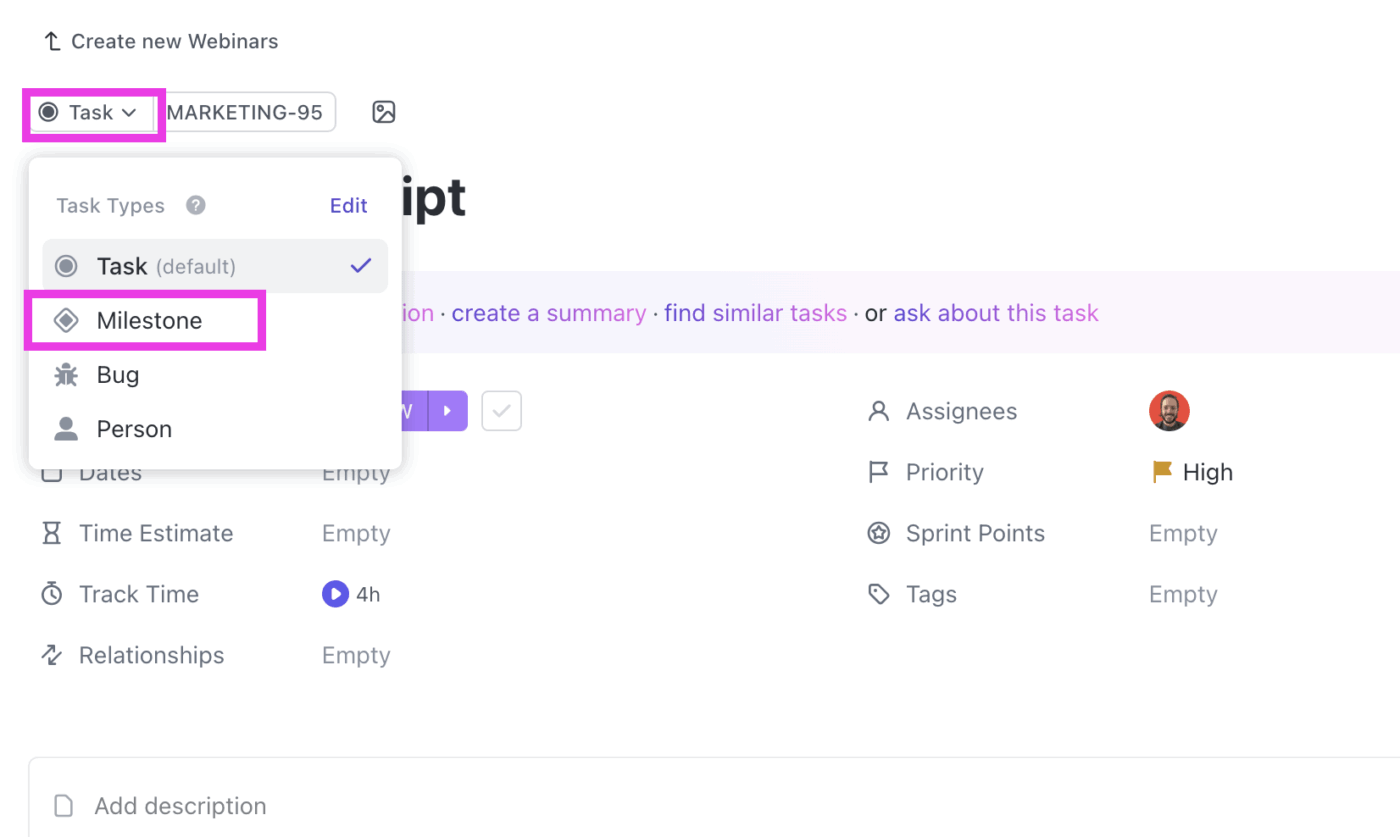
To create a milestone in ClickUp:
- Turn on the Milestones ClickApp in your Workspace settings
- Right-click any individual task
- Choose the Mark as Milestone option to convert a task bar into a milestone
4. The milestone task appears as a diamond next to the task name
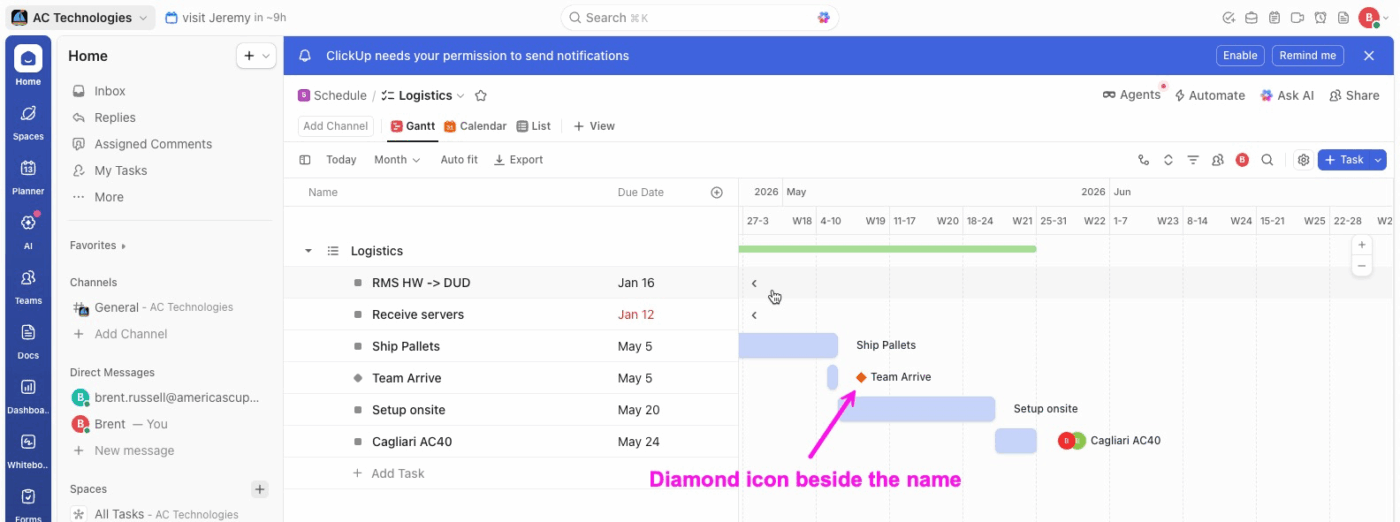
5. Milestones are usually displayed on the task’s end date. If no end date is available, milestones will be displayed at the task’s start date.
6. To convert a milestone task back to a normal task, simply click on the three dots (…) menu in the task and reset it
That’s how easy it is to set and modify milestones on your interactive Gantt chart with ClickUp!
Now, Gantt charts are only the tip of the iceberg of ClickUp features.
ClickUp lets you create much more than an interactive Gantt chart.
For maximum flexibility, this project management tool gives you a wide variety of awesome features like:
- Pulse: helps you identify where your in-house or virtual team is spending the most time
- Mind Maps: visualize the task planning process
- Workload View: get insights on work division, open tasks, and team bandwidth
- Automation: automate 50+ repetitive project tasks for better efficiency
- Agile Dashboards: stay on top of your projects with charts like Velocity, Burndown, Burnup, and Cumulative Flow graphs
- Multiple Views: choose from views like List, Box, Board, Calendar, and more according to your project needs
- Native Time Tracking: help your remote team overcome productivity challenges
- Reminders: set reminders for time-sensitive tasks to smartly manage deadlines
See why we call ClickUp the only tool you need for managing projects efficiently?
Conclusion
A Gantt chart milestone marks a key event in the course of your project activities. It offers a high-level understanding of the project timeline and enables teams to effectively stick to the project schedule.
Now, adding milestones can be a headache if you’re using tools like Microsoft Excel.
However, with project management software like ClickUp, it’s a piece of cake.
From creating amazing Gantt charts to marking Gantt chart milestones, a remote work OS like ClickUp will help you every step of the way.
Sign-up for ClickUp today (for free!) and zoom past your Gantt chart milestones with ease!


Everything you need to stay organized and get work done.

Recent Articles
Claude Skills for Project Management: A Practical Guide 
Claude Skills for Project Management: A Practical Guide
8 Best Free Gantt Chart Software Tools, Honestly Compared 
8 Best Free Gantt Chart Software Tools, Honestly Compared
How to Write a Scope of Work (+ Examples & Templates)
How to Write a Scope of Work (+ Examples & Templates)
