Remember the group project from school where no one knew who was doing what?
Fast-forward to today: not much has changed.
Despite 77% of successful projects using management tools, teams still drown in scattered information and unclear priorities.
This is where visual project management can help: Because your brain processes them 60,000x faster than text.
No wonder our eyes light up at donut charts and color-coded boards the way Joey lights up at pizza.
This blog will show you how to turn messy projects into clear, collaborative workflows using data visualization tools your team will enjoy using (yes, even that guy from finance).
Ready to see the big picture—literally?
- What Is Visual Project Management?
- Why Use Visual Project Management?
- Examples of Popular Visual Project Management Tools
- How to Implement Visual Project Management in Your Workflow?
- Top Visual Project Management Software
- Common Challenges in Visual Project Management (And How to Solve Them)
- Make Your Projects Pop with ClickUp
What Is Visual Project Management?
Visual project management is a modern approach to project management that uses visual tools, such as boards, charts, diagrams, and timelines, to help teams visualize priorities, track progress, and make faster, more informed decisions.
By turning complex project data into easy-to-read visuals, teams stay aligned, identify roadblocks early, and increase the chances of project success.
1. See workflows clearly: Use visual task management tools to break down work into clear, visual components (like Kanban boards or Gantt charts)
2. Real-time project status updates: See the current project status at a glance without digging through spreadsheets or long email threads
3. Priorities you can see: Use visual cues like color-coding, labels, and progress bars to visualize priorities and stay focused on what matters most
4. Data-driven insights: Turn raw project data into work dashboards and charts that provide insights into team performance, deadlines, and workload
5. Boosted project success: Improve clarity and collaboration, ultimately leading to smoother workflows, fewer surprises, and more consistent project success
🧠 Fun Fact: The first visual project management tool was a wall full of sticky notes. The accidental invention of the Post-it Note by 3M scientists Spencer Silver and Art Fry in the 1970s led to a revolution in how teams brainstorm and organize tasks visually.
These humble notes became indispensable tools for visualizing workflows and collaborating effectively.
Why Use Visual Project Management?
Teams today move fast, and clarity is non-negotiable. Visual project management helps simplify complexity by turning data into easily understandable formats. With the right visual tools, teams can focus on what matters most: collaboration, accountability, and results.
Some reasons to use visual project management:
- Boost clarity with dashboards and project management charts
- Track project progress at every stage using real-time, interactive boards
- Improve resource management by spotting bottlenecks and reallocating quickly
- Stay focused on deliverables by aligning work with key performance indicators
- Make better decisions by seeing the complete picture in one centralized view
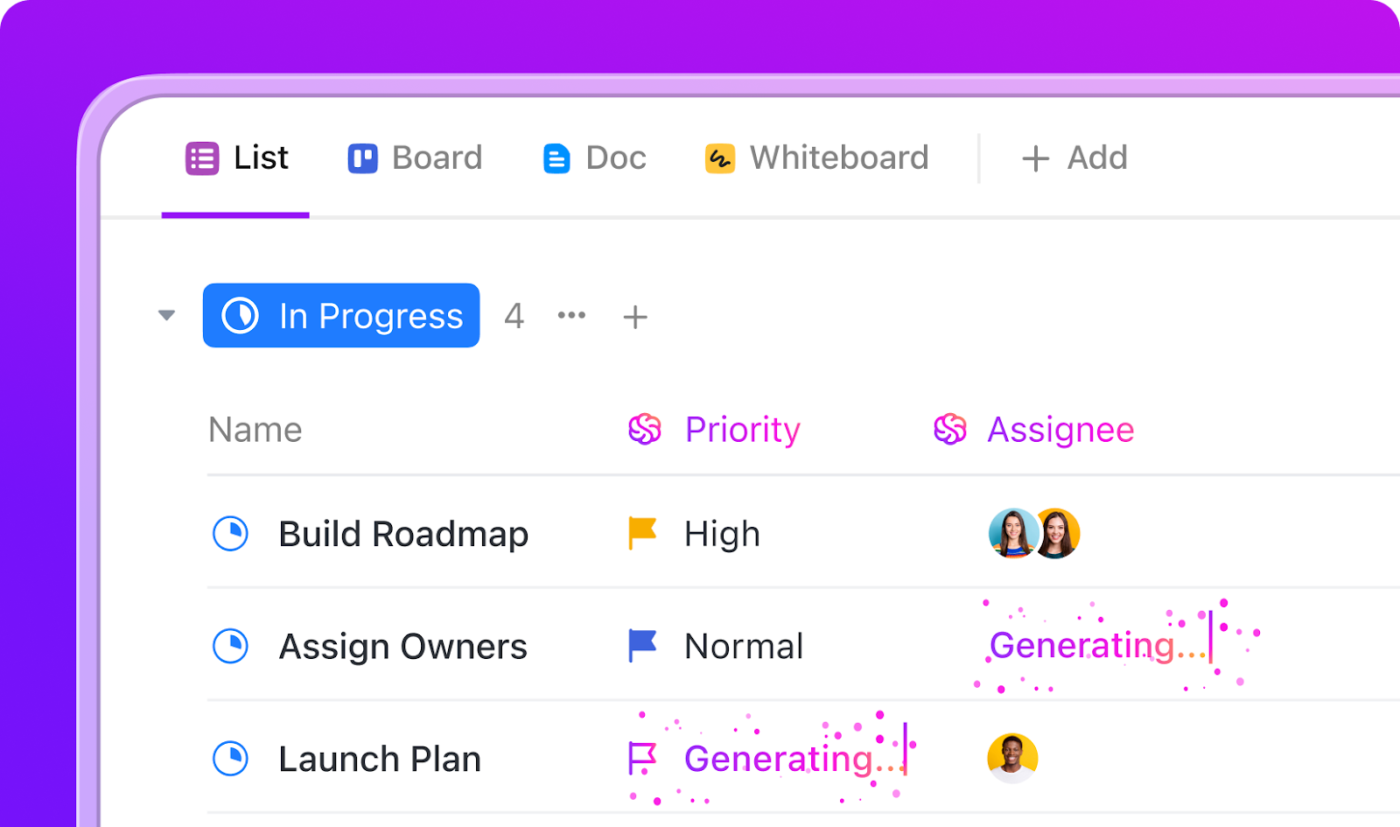
💡 Pro Tip: Want to take project management to the next level? Try ClickUp’s new AI features like AI Assign, AI Prioritize, and AI Cards. No more chasing after tasks!
📖 Also Read: How to Make a Line Graph or Chart in Google Sheets
Examples of Popular Visual Project Management Tools
When picking tools for the visual representation of projects, you need options that match your workflow. Here’s a deep dive into the most effective visual management solutions, backed by real user data and practical applications.
1. Kanban boards

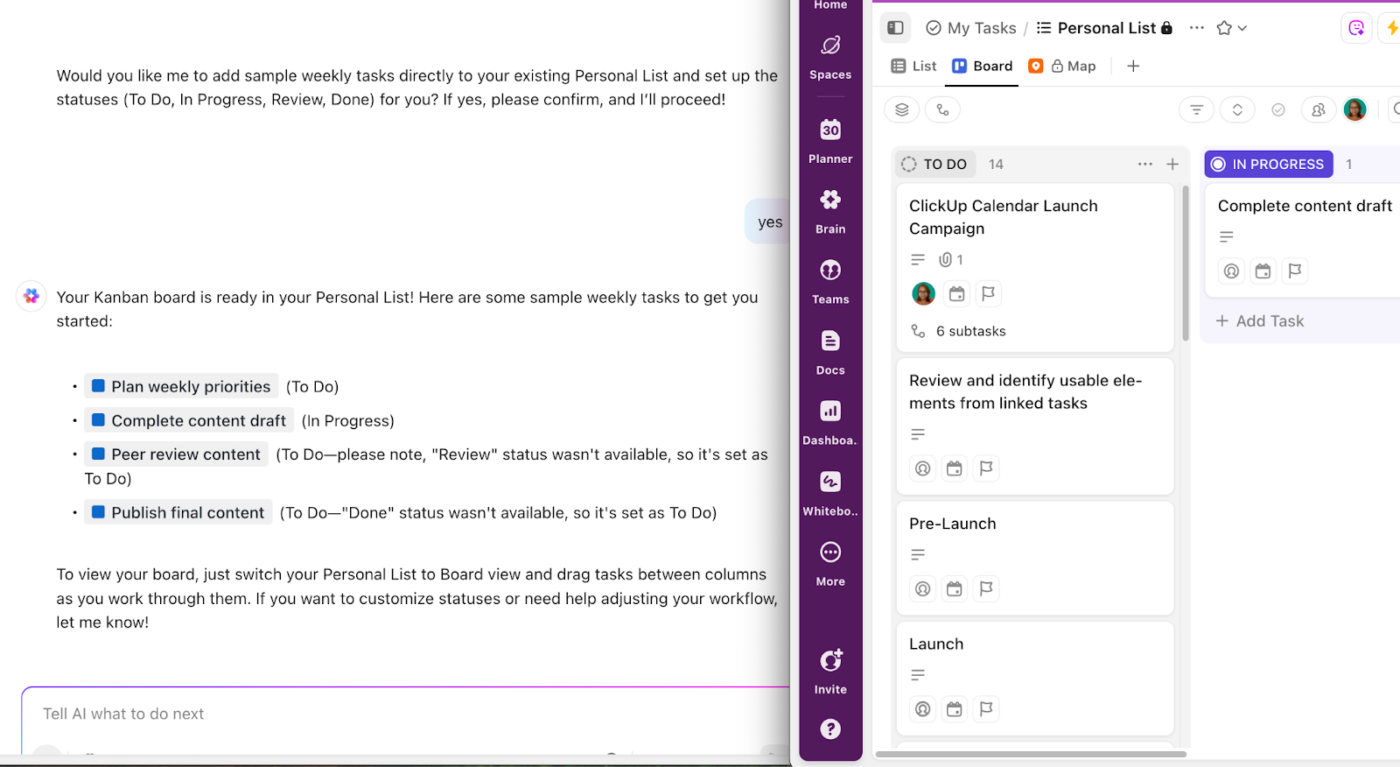
Kanban boards show task progress through columns like ‘To Do,’ ‘In Progress,’ and ‘Done.’ They’re perfect for fostering team collaboration and giving quick status updates.
Its card-based system helps track tasks with color-coded labels for priorities.
Marketing teams often use it for content calendars, while software teams rely on it for bug tracking.
ClickUp Brain, ClickUp’s built-in AI assistant, can help you build kanban boards from scratch! (minus the headscratching 👀)
📖 Also Read: Free Kanban Board Templates in OneNote and ClickUp
2. Gantt Charts

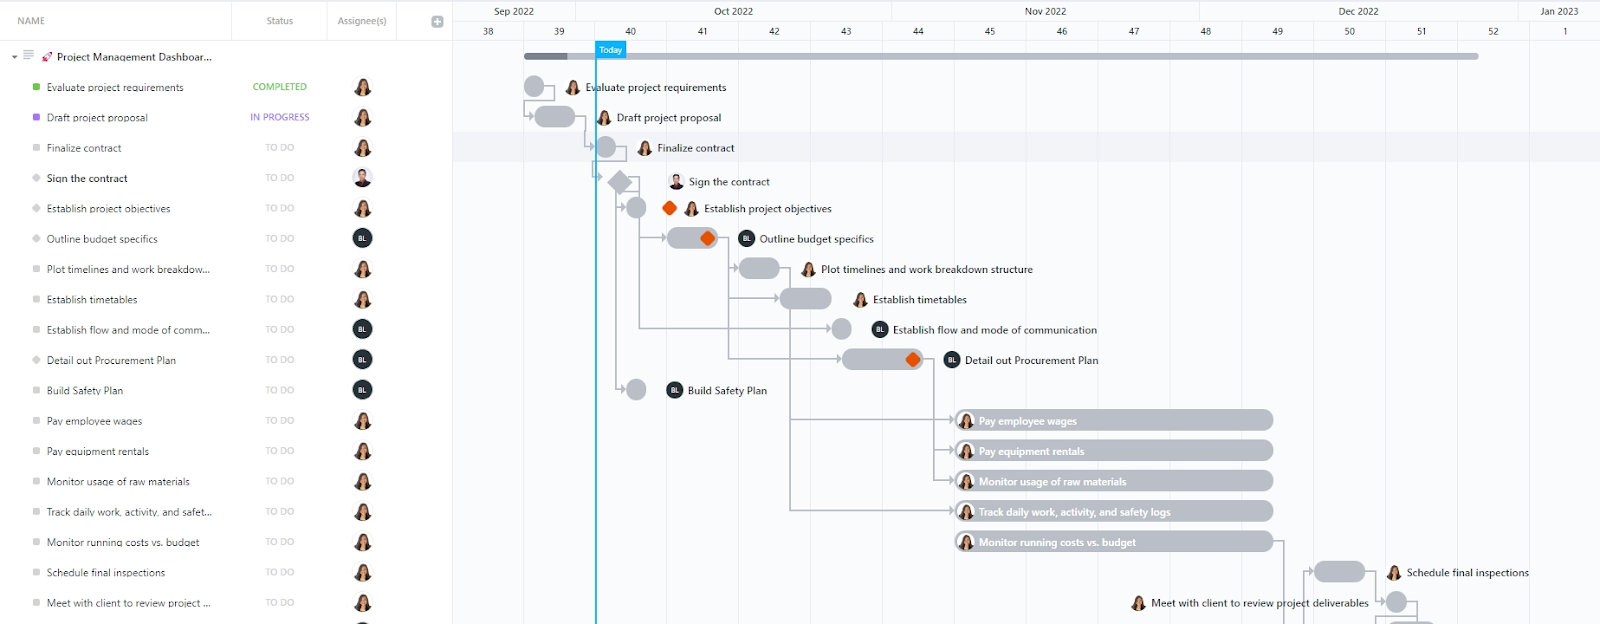
A Gantt Chart maps tasks on a timeline for complex projects with many moving parts. This helps with project planning by showing:
- Task start and end dates
- How do different pieces of work depend on each other
- Who’s responsible for each task
- Overall project timeline and milestones
💡 Pro Tip: When using visual project management software for Kanban boards or Gantt charts, don’t just visualize tasks—visualize blockers.
Create a specific ‘Blocked’ or ‘Needs Review’ column and assign visual tags (like red flags or warning icons) to highlight where things are stuck. This gives your team an immediate, actionable view of what’s delaying progress, not just what’s on track.
3. Whiteboards
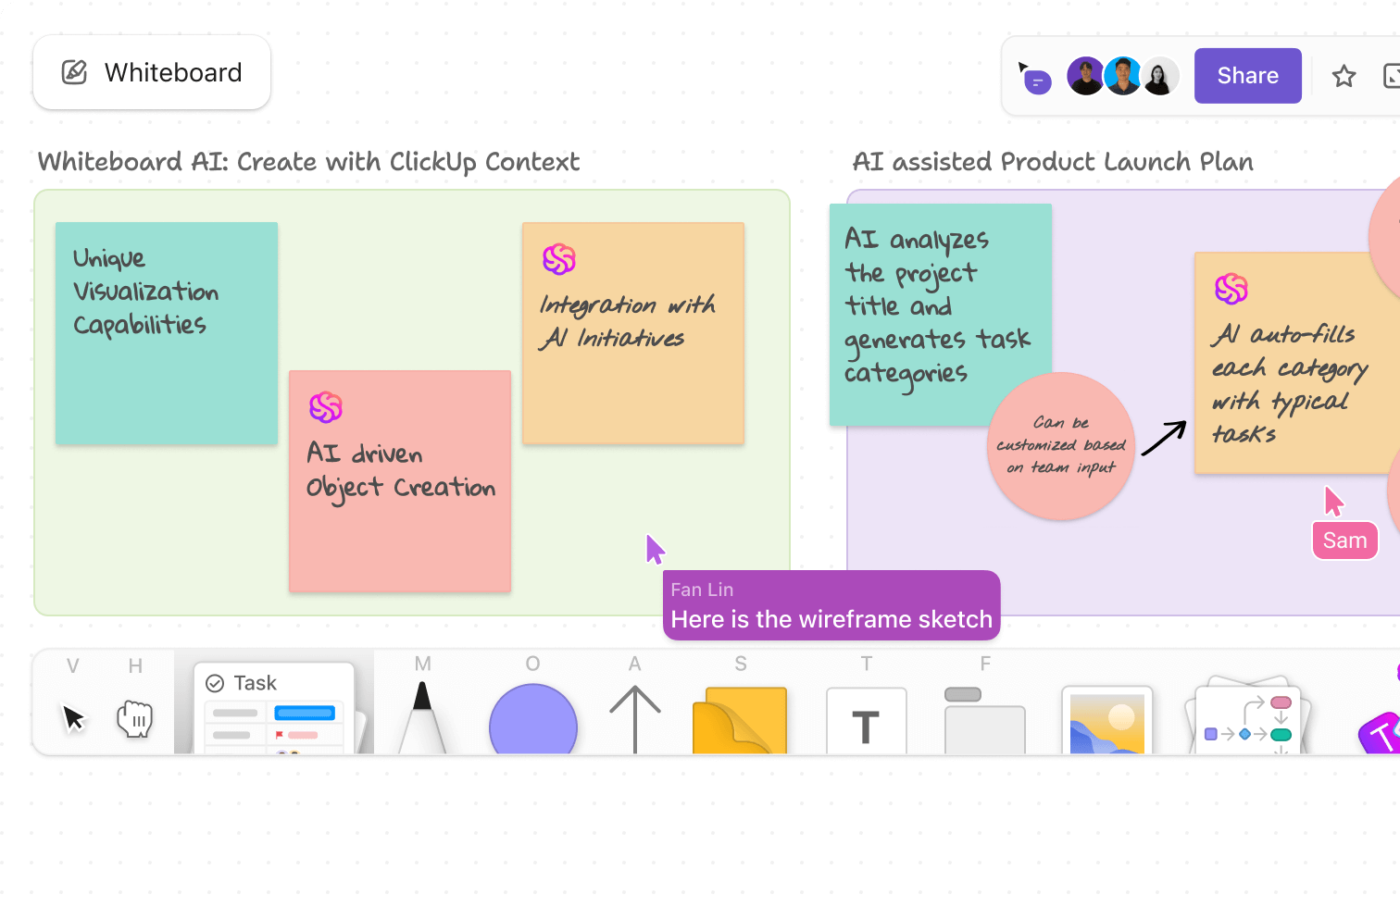
Whiteboards give teams a shared space for brainstorming and planning.
Your team can sketch out ideas, create workflows, and turn concepts into actionable tasks— perfect for when you need team collaboration that feels like working together in person.
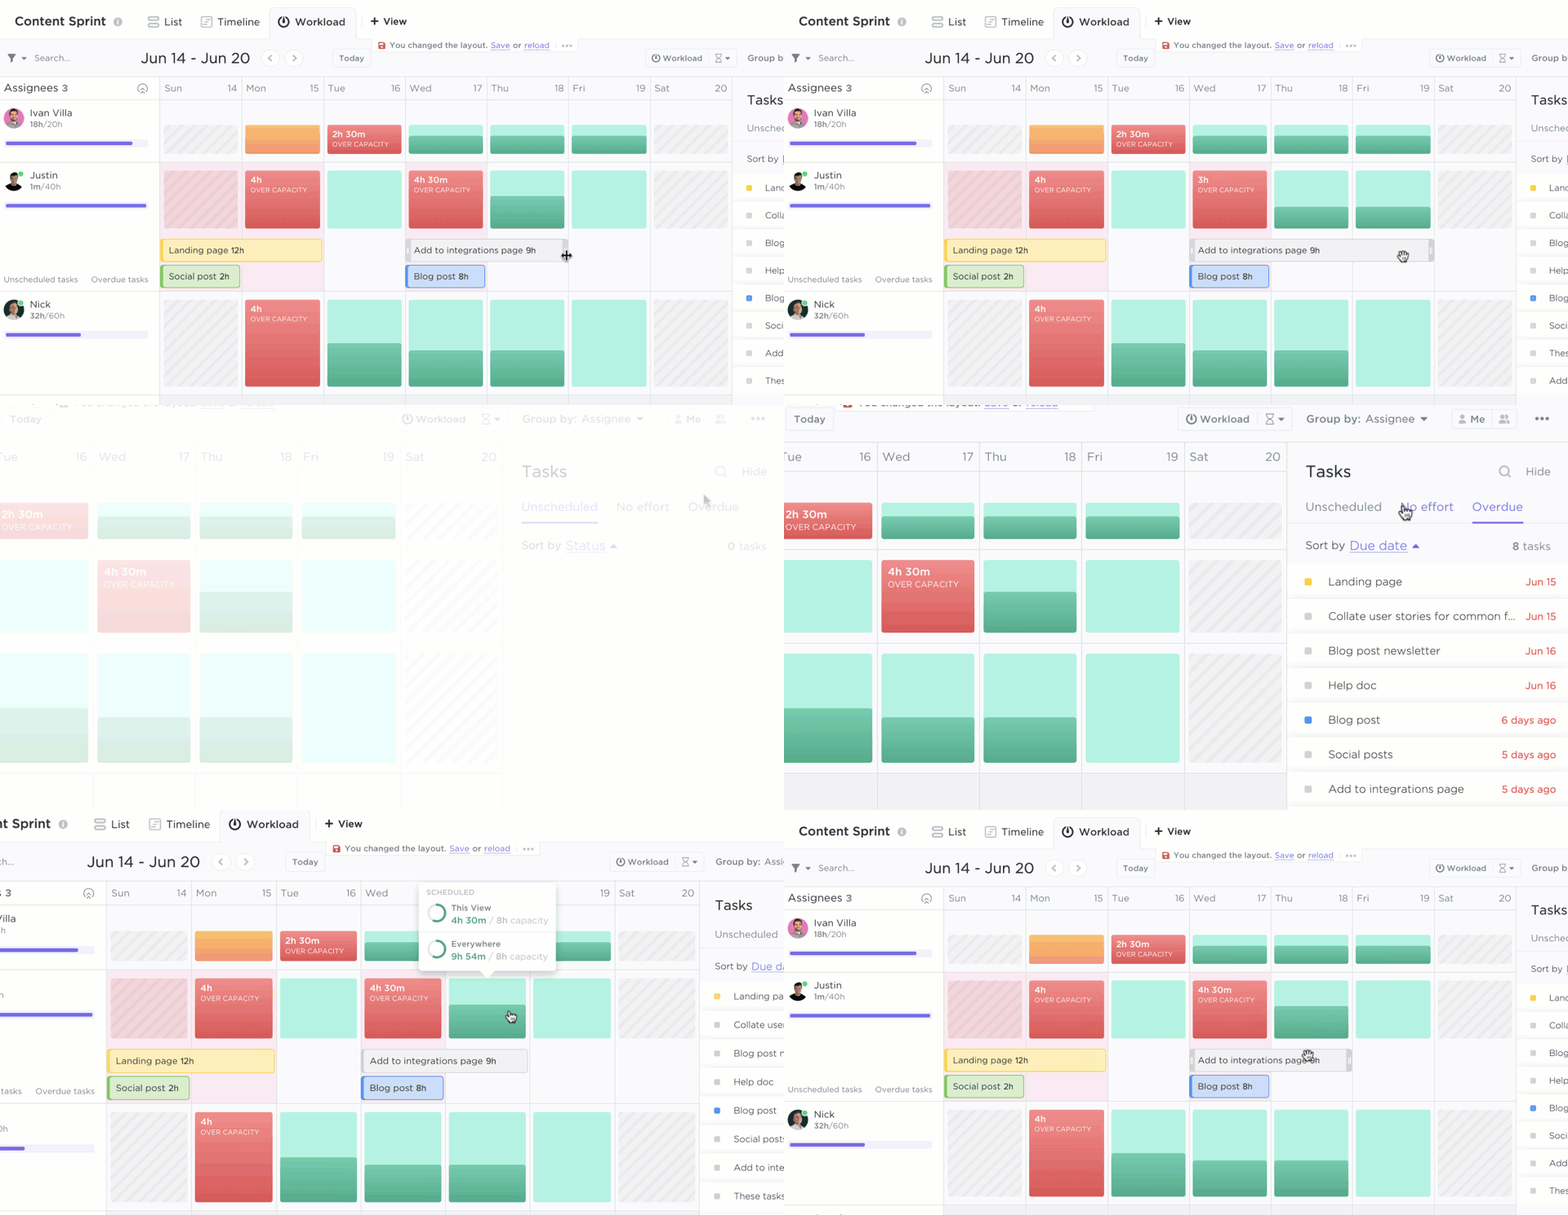
💟 Bonus Tip: Want to take your project management game to the next level? Try combining ClickUp’s Workload View and Map View for a powerful, holistic approach. Imagine you’re running an agency with multiple clients and tight deadlines—Workload View lets you instantly spot who’s overloaded and easily rebalance assignments, so no one burns out during crunch time.
Meanwhile, if you’re managing a field team, planning events, or coordinating sales visits, Map View gives you a visual layout of where every task is happening. By using both views together, you’ll not only keep your team’s workload balanced but also make smarter, location-based decisions that boost efficiency and keep everyone happy.
4. Dashboards

Think of project management like driving a car—you need a clear view of the road ahead to stay on track.
A dashboard is a visual workspace that consolidates all your key project data—from task statuses and KPIs to timelines and resource usage—into one easy-to-read view. It’s perfect for keeping teams and stakeholders informed and focused.
Whether leading a product launch or overseeing a construction build, dashboards help you visualize priorities, provide insights, and guide your projects smoothly from start to finish.
5. Calendars

Calendars are dynamic scheduling tools designed to help individuals and teams stay organized, plan, and manage their schedules and availability in a clear, visual format.
Whether you’re a freelancer juggling multiple deadlines or a project manager overseeing a complex timeline, Calendar offers the flexibility to schedule tasks, create events, and sync with external calendars—all in one place.
With features like drag-and-drop rescheduling, recurring tasks, and customizable views, it’s built to enhance efficiency and support continuous improvement in your planning processes.
How to Implement Visual Project Management in Your Workflow?
A scattered team, complex tasks, and tight deadlines don’t have to mean chaos.
Visual project management puts everything in clear sight, making it simple to spot bottlenecks and keep work moving forward.
Here’s how you can set up visual project management in your workflow with a little help from ClickUp.
Step 1: Map out your workflow stages
Start by mapping out your project flow in a way that matches how your team thinks. For instance, if you’re managing a content team, you might start with ‘Content Ideas,’ move to ‘Writing,’ then ‘Editing,’ and finally ‘Published.’
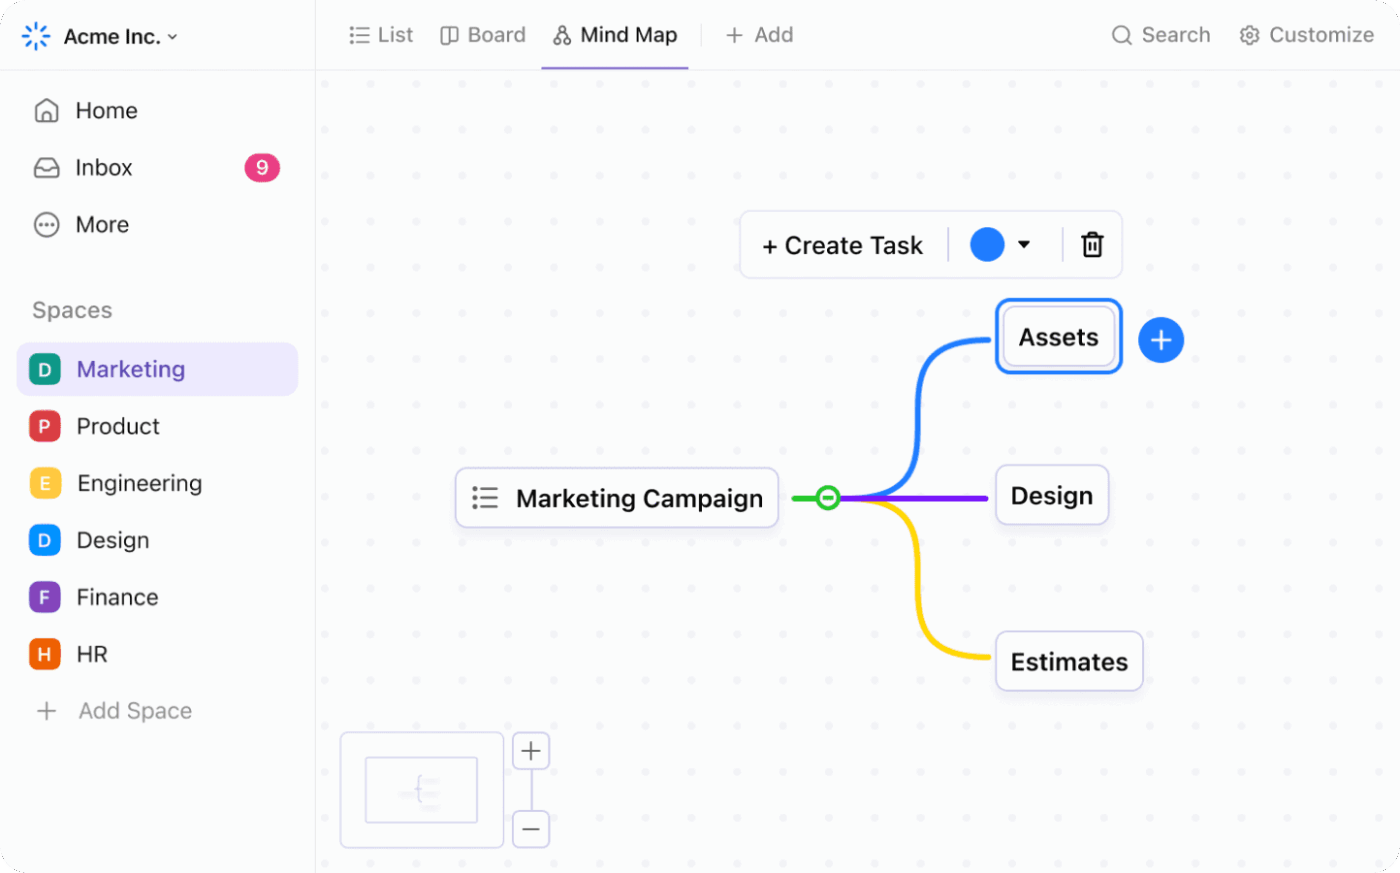
Not sure quite how? Kick things off with ClickUp Mind Maps to brainstorm and visualize your entire workflow before assigning tasks. Drag and drop tasks as your ideas evolve, then convert your map directly into actionable items.
Once you have a good sense of what your workflow looks like, organize it with:
- Labels to mark priorities or for resource allocation
- ClickUp Custom Statuses that fit your exact process
- Color coding to spot task status at a glance (like red for blocked items)

⚡️Template Archive: Need a broader view of timelines? Use the ClickUp Simple Gantt Chart Template! This template is a ready-to-use solution for anyone looking to plan, schedule, and track projects visually with ease. Perfect for teams of any size, this template helps you break down tasks, set deadlines, and manage dependencies in one clean timeline view.
Step 2: Create a centralized visual hub
Every team works differently—some thrive on structure, while others need a more flexible flow. Keep everyone aligned by showing work in formats that resonate with your team. The most important thing is to maintain a centralized, single source of truth.
ClickUp’s Spaces let you create dedicated, organized workspaces for each project, all within one shared workspace using Folders and Lists. These are your building blocks. But not everyone likes that handy Table View. Some might need a timeline or a Kanban board. That’s where ClickUp’s Custom Views can help. It comes with 15 different visualizations of your workflow!
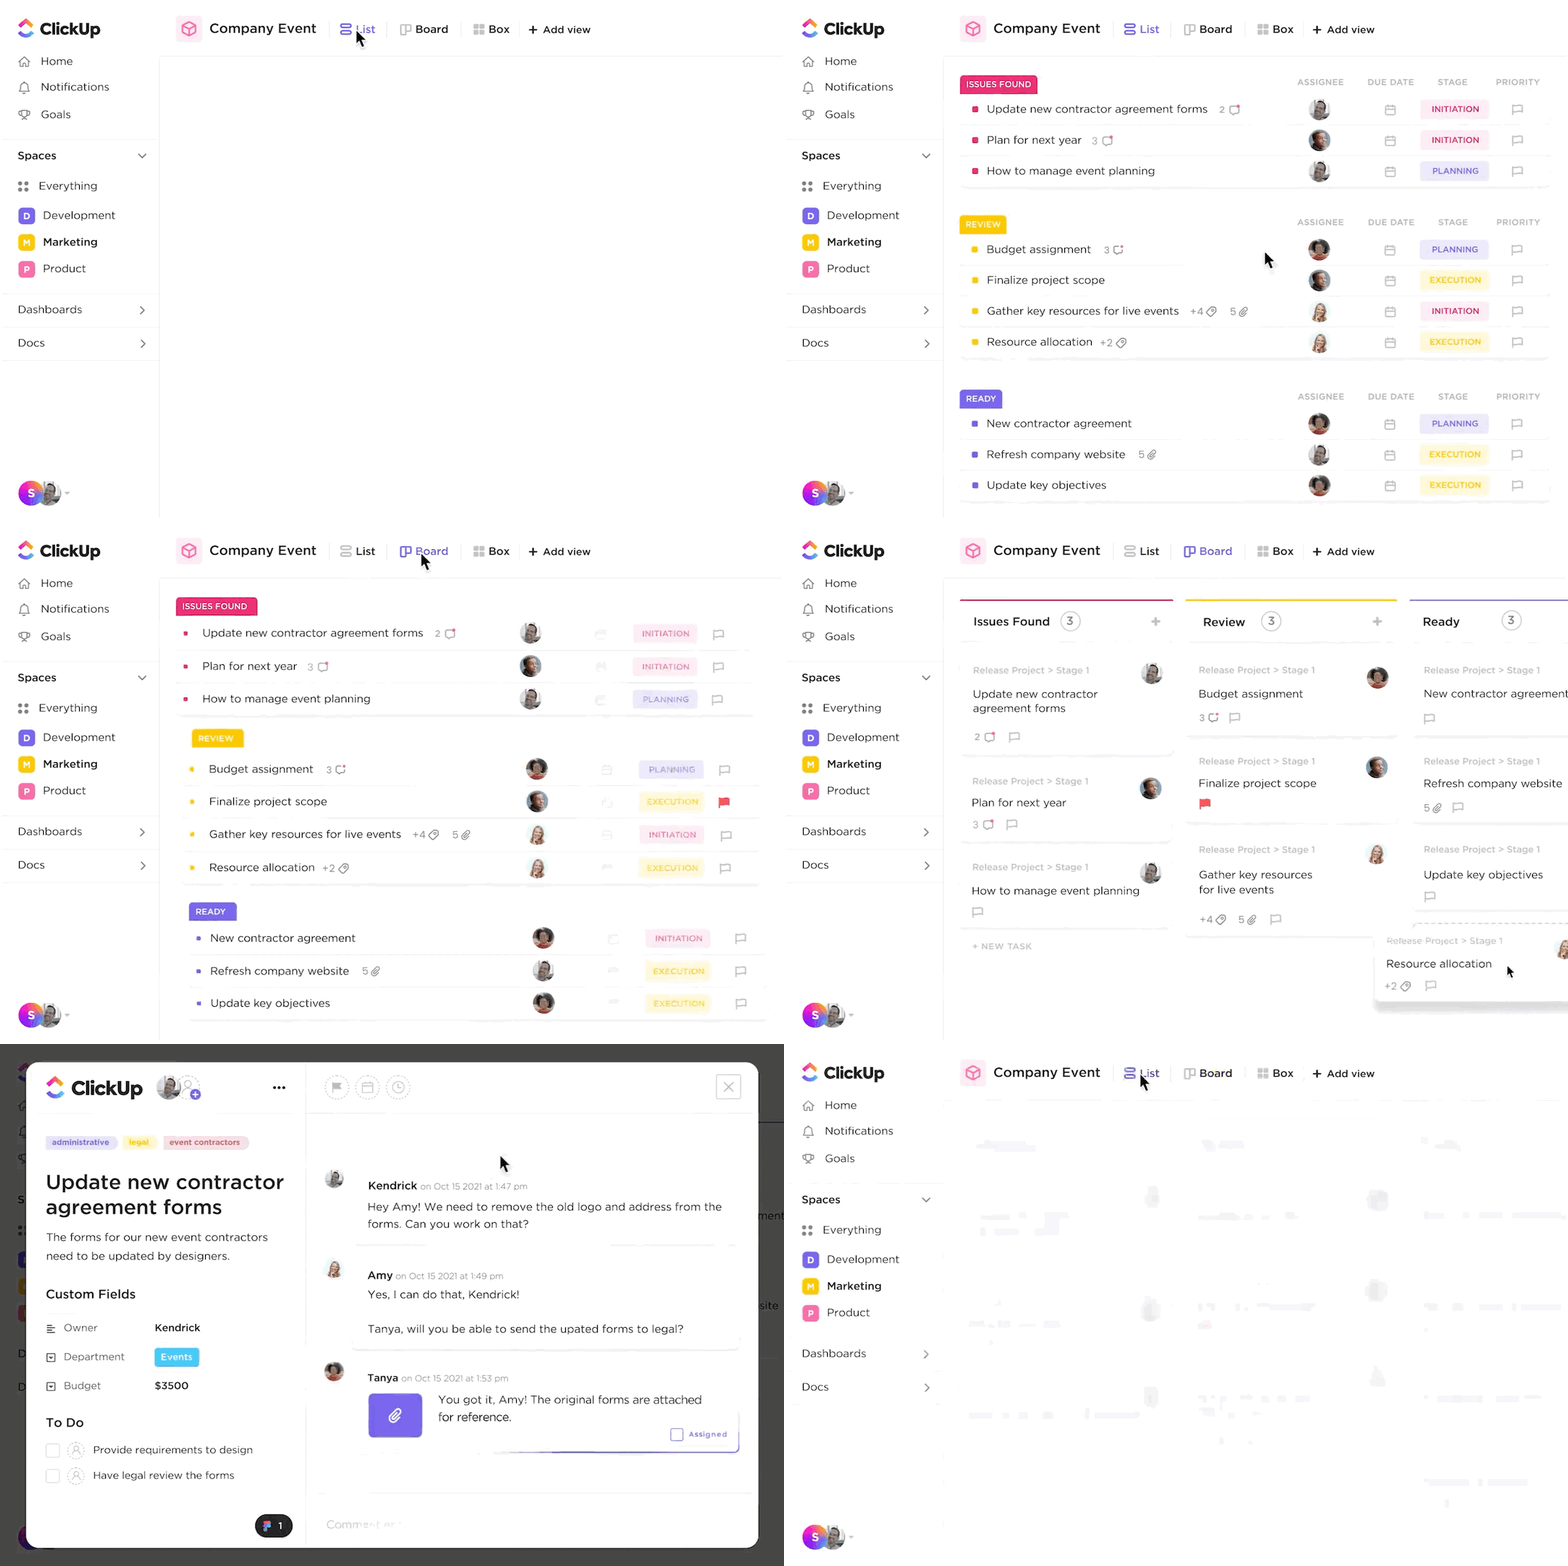
💟 Bonus: You can add the ClickUp Kanban Template to your workspace and align tasks for your team through different stages.
Step 3: Track team capacity

Effective project management is about more than just tracking tasks. It should help you and your team ensure clarity, accountability, and progress. How do you do that?
Start by breaking down projects into actionable tasks, assigning responsibilities, and setting clear deadlines. Use visual cues like priorities, dependencies, and milestones to keep everyone aligned. Regularly review progress and adjust plans as needed to stay on track.
ClickUp helps here with features like:
- Task creation & assignment: Create tasks, assign them to team members, and set due dates and priorities
- Dependencies & Relationships: Link tasks that depend on each other, making it clear what needs to be done first
- Custom Fields: Track project-specific data like budgets or estimated hours
- Milestones: Highlight key deliverables and checkpoints
- Templates: Use templates for recurring project types to save time
- Progress Tracking: Use checklists, progress bars, and status updates to monitor advancement
- Collaboration: In line comment on tasks to keep discussions in context
The ClickUp Project Management Dashboard Template is your all-in-one solution for staying organized, aligned, and tracking team capacity.
Step 4: Set up smart automations
Tired of repetitive updates and missed steps? ClickUp Automations help you streamline processes by triggering actions based on rules you set. Now your team can focus more on doing and less on updating.

Here’s what you can automate:
- Move tasks automatically to ‘Review’ when marked ready for the next step
- Flag tasks as urgent when deadlines are near to keep priorities clear
- Create recurring tasks automatically for daily standups or weekly check-ins
- Assign tasks or send notifications when a status or priority changes
- Update custom fields or move tasks between Lists, Folders, or Spaces—without lifting a finger
Step 5: Collaborate effectively

Whether you’re mapping out a new initiative, sharing updates, or solving problems as they arise, collaboration is the key to project success. ClickUp combines structured documentation and seamless communication so your team can work together without missing a beat.
With ClickUp Docs, you can create living documents that are directly linked to your workflows. Collaborate, edit, and share in real time—everyone stays on the same page, literally and figuratively. Docs can be organized in folders, linked to tasks, and managed with flexible permissions, making it easy to control access and keep information secure.
It lets you:
- Create and edit docs right alongside your tasks and workflows, so context is never lost
- Embed project boards, roadmaps, and task lists directly into your docs for a unified view
- Keep feedback visual and actionable with real-time comments and collaborative editing
- Organize docs in folders, link them to relevant tasks, and manage who can view or edit with just a few clicks
Moving on to fast, focused communication, ClickUp Chat keeps your team connected with instant, task-linked messaging—all within the same workspace. You can start conversations without switching tools, tag teammates, attach files, and link directly to tasks or docs.
Use it to:
- Start instant conversations to resolve questions quickly, without leaving your workflow
- Tag teammates, share files, and link to relevant tasks or docs for context-rich discussions
- Organize conversations with threads, keeping topics clear and easy to follow
- Stay updated across devices, so you never miss an important message or decision
With ClickUp’s collaborative features, your team can communicate, document, and coordinate—all in one place, driving projects forward with clarity and speed.
📮ClickUp Insight: 11% of our respondents leverage AI primarily for brainstorming and ideation. But what happens to these brilliant ideas afterward? This is where you need an AI-powered whiteboard, like ClickUp Whiteboards, which helps you instantly turn ideas from the brainstorming session into tasks.
And if you can’t quite explain a concept, simply ask the AI image generator to create a visual based on your prompt. It’s the everything app for work that enables you to ideate, visualize, and execute faster!
Top Visual Project Management Software
Visual project management software turns complex workflows into clear, intuitive visuals—helping teams see the big picture, track progress, and collaborate better.
Here are five top-rated visual project management tools:
1. Trello
Ideal for simple, Kanban-style project tracking, Trello uses cards and boards to visualize tasks. It’s perfect for small teams, marketing plans, and personal projects. Features include checklists, due dates, Power-Ups (integrations), and drag-and-drop task movement.
2. Monday.com
Known for its colorful interface and versatility, Monday.com offers multiple views—Kanban, timeline, calendar, and charts. It supports task dependencies, automations, integrations, and team dashboards, making it a strong option for both startups and enterprises.
3. Asana
Asana blends visual clarity with robust task management features. Teams can switch between list, board, calendar, and timeline views, set milestones, track dependencies, and manage workloads—great for cross-functional collaboration.
4. Notion
Though primarily a documentation tool, Notion has evolved into a visual project management powerhouse with drag-and-drop boards, timelines, and database views. Its flexibility allows you to build highly customized workflows with wikis, notes, and project tracking all in one.
5. Wrike
Designed for teams with complex workflows, Wrike features Gantt charts, workload management, time tracking, and advanced reporting tools. Its real-time activity stream and dynamic dashboards make it especially useful for agencies and professional service teams.
Oray Ciftliklioglu, Ui + UX Designer at Enhance Ventures, a ClickUp user, quotes:
Common Challenges in Visual Project Management (And How to Solve Them)
Visual project management makes it easier to track progress, assign tasks, and stay aligned—but it’s not without its challenges. When not used correctly, even the best tools can lead to confusion, clutter, and missed deadlines.
1. Problem: Visual overload
Too many colors, columns, tags, and widgets can turn a helpful board into a chaotic mess.
Solution:
Keep it simple. Stick to a consistent color-coding system and limit Custom Fields to what’s essential. Use filters and collapsible sections to show only what’s relevant to each team member.
2. Problem: Lack of real-time updates
When team members forget to update task statuses, your board becomes outdated fast.
Solution:
Use automation to move tasks, send reminders, or update fields based on triggers. Encourage a quick end-of-day update habit to keep things current without adding extra meetings.
3. Problem: Unclear ownership
If it’s not clear who’s responsible for what, tasks fall through the cracks.
Solution:
Assign one owner per task. Visual tools should clearly show the assignee, deadline, and priority, so accountability is never in question.
4. Problem: One view doesn’t fit all
Some team members prefer Kanban, while others need timelines or calendars.
Solution:
Choose tools that offer multiple views and let individuals pick how they want to see their work. This keeps everyone comfortable without compromising alignment.
5. Problem: Over-reliance on visuals without context
A pie chart or board without supporting information can be misleading.
Solution:
Pair visual boards with written context—descriptions, comments, or linked docs. This adds clarity, especially when collaborating across teams or time zones.
Make Your Projects Pop with ClickUp
Managing project complexities doesn’t have to give you a headache.
A solid visual system helps your team spot bottlenecks, track progress, and make informed decisions without drowning in spreadsheets.
With ClickUp’s visual tools, you get exactly that kind of clarity.
No more status meetings that could’ve been a dashboard. No more ‘quick questions’ that interrupt your flow. Just clean, clear visuals that keep everyone aligned and moving forward.
Try ClickUp for free today and watch your projects come to life.


