
When planning a project, it’s easy to focus only on the final goal. However, this narrow perspective can lead to significant setbacks if issues arise along the way.
By incorporating milestone charts into your project timeline, you can proactively monitor progress, identify potential problems early, and make necessary adjustments to ensure timely completion.
In this blog post, we will explore how milestone charts aid in project planning, their benefits, components, and best practices for creating and using them effectively.
How to Create Milestone Charts in Project Management
- What Are Milestone Charts?
- Benefits of Creating Milestone Charts
- How to Create a Milestone Chart in Project Management?
- A step-by-step guide to creating a project management milestone chart
- More Ways to Visualize Your Project Management Milestones
- Common Mistakes to Avoid While Using Milestones in Project Management
What Are Milestone Charts?
Milestone charts are essential tools in project management. They provide a clear and concise visual representation of key project phases, deliverables, and deadlines. By breaking down complex projects into manageable milestones, project managers can effectively track progress, identify potential bottlenecks, and ensure timely completion.
What are milestones in project management?
In project management, milestones are important events or achievements that indicate progress toward completing a project. In simple words, they act as key checkpoints in a project timeline.
A survey revealed that 85% of project managers oversee multiple projects simultaneously. Of course, that sounds like a mountain of work.
Managing several projects simultaneously involves coordinating various resources, workflows, and processes, which can quickly become overwhelming for any project manager who doesn’t have the right project management tools. This is where milestone charts come in handy.
Key characteristics of project milestones include:
- Significant events: Milestones represent substantial accomplishments or achievements within the project
- Completion markers: They indicate the completion of a specific phase or deliverable
- Decision points: Milestones often serve as decision points for project managers, allowing them to assess progress and make necessary adjustments
- Checkpoint: Milestones provide a checkpoint to ensure the project is on track and meeting its objectives
Benefits of Creating Milestone Charts
For efficient project management, you need a clear roadmap, smooth communication, and informed decision-making. Milestone charts can help with these.
Let’s explore the key benefits of creating and using milestone charts in your projects:
1. Improved project visualization
Milestone charts provide a clear and concise visual representation of the project timeline. This articulation helps stakeholders and team members better understand the project’s scope, timeline, and dependencies.
2. Enhanced communication and collaboration
Milestone charts can help reduce misunderstandings, improve communication, and ensure everyone works towards the same goals by providing a shared understanding of project expectations and timelines.
3. Improved decision making
Milestone charts enable project managers to track progress against key milestones, identify potential issues early on, and make informed decisions regarding resource allocation, risk mitigation, and potential adjustments to the project plan.
4. Increased accountability
These charts assign clear responsibilities to team members, promoting accountability and ownership of tasks. By tracking progress against milestones, project managers can identify team members who are falling behind and provide the necessary support to help them get back on track.
5. Enhanced stakeholder engagement
By providing regular updates on project progress and highlighting key achievements, milestone charts can help build trust and confidence among stakeholders.
How to Create a Milestone Chart in Project Management?
There are several methods for creating a milestone chart, each designed to visually represent project timelines and identify major milestones.
The best approach to creating a project management chart varies based on the complexity of your project, the size of your team, and your preferred management style.
Here are some popular methods for creating effective milestone charts:
1. Gantt charts
Gantt charts are among the most widely used tools for creating a project milestone chart. They represent tasks on a horizontal timeline, with bars showing the duration of each task. Project milestones are usually symbolized by diamonds or other markers.
This method is ideal for projects with a linear sequence of tasks and dependencies.
2. Kanban boards
Originally developed for manufacturing, Kanban boards have been adapted for project management.
These visual tools use columns and cards to represent different stages of a project (e.g., To Do, In Progress, Done). Milestones can be identified by placing cards in designated columns or using color-coded labels.
Kanban boards are particularly effective in Agile methodologies, where tasks are frequently updated.
3. Timeline diagrams
Timeline diagrams offer a straightforward way to visualize project phases and milestones.
They typically display the project’s timeline on a horizontal line, with significant milestones marked along the line.
This method is simple and easy to follow, and it can be customized with symbols and colors to fit project needs. This is ideal for running sprints, managing short-term projects, and more.
4. Mind maps
They show the hierarchical relationship between tasks and milestones, providing an easy-to-follow visual highlighting how various elements contribute to the project’s overall success.
Mind maps, commonly used for brainstorming, can also be adapted to display a milestone chart. These are also ideal for tackling complex projects, recognizing thought patterns, and connecting the dots.
A step-by-step guide to creating a project management milestone chart
A well-designed milestone chart clearly represents the project’s timeline, highlighting key deliverables and critical checkpoints. A project management tool, such as ClickUp, can effectively create milestone charts and manage every step of a project timeline.
Here are the steps to create an effective milestone chart that will help you manage your project more precisely.
We’ve also shown you how harnessing the ClickUp Project Management platform can help you at each step.
Step 1: Define project goals
The first and most crucial step in crafting a milestone chart is clearly defining your project’s goals. These objectives guide the entire project, ensuring each milestone aligns with the bigger picture.
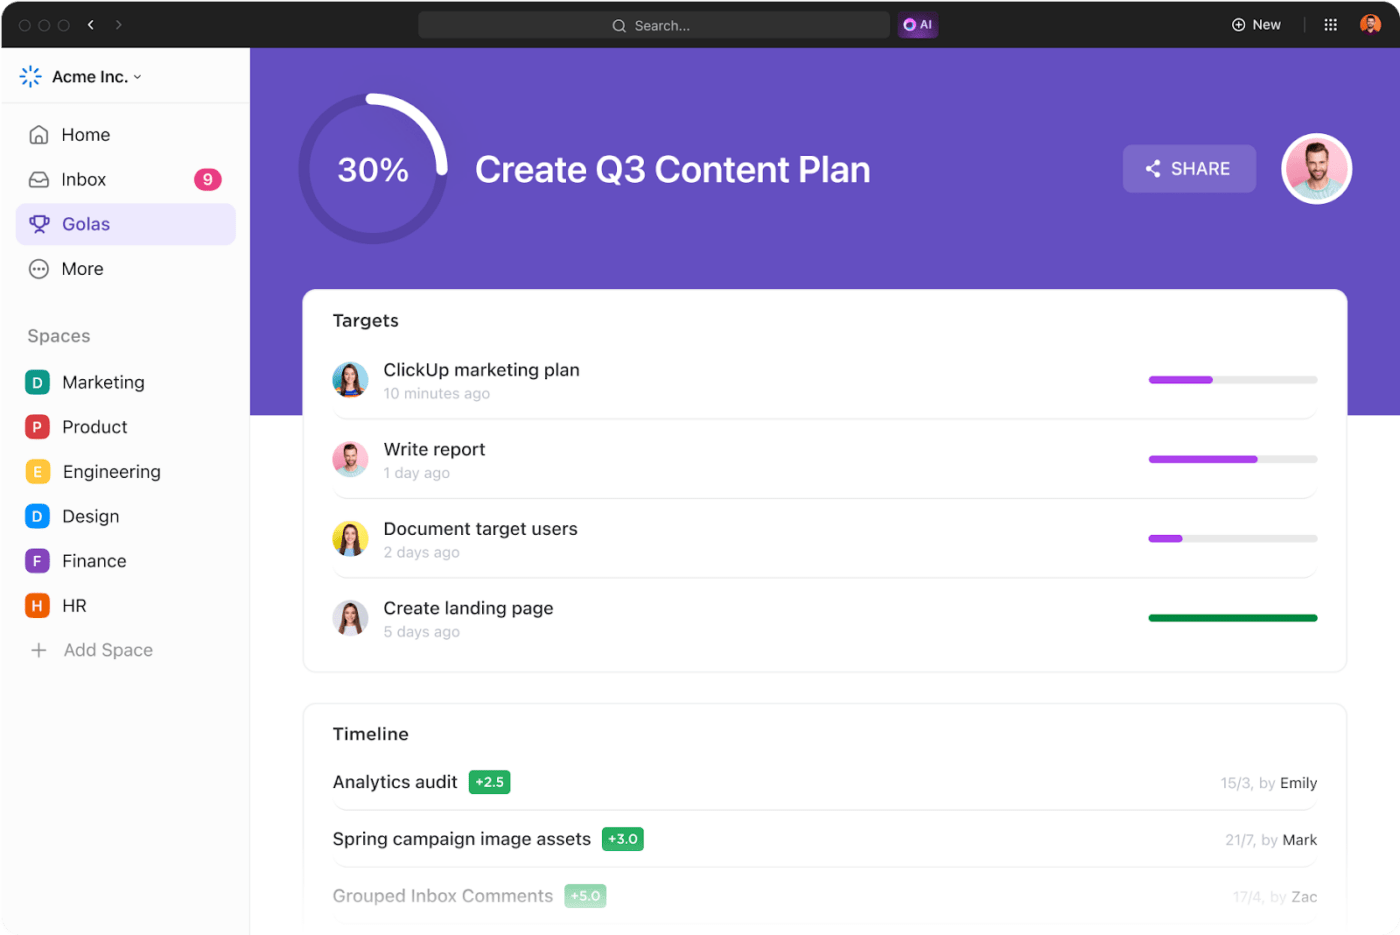
ClickUp Goals can help you define and structure your project goals effectively. It enables SMART goal setting, and you can align your goals and the associated tasks with milestones. You can also visualize timelines, track real-time progress, and encourage collaboration and accountability.
Step 2: Write a task list
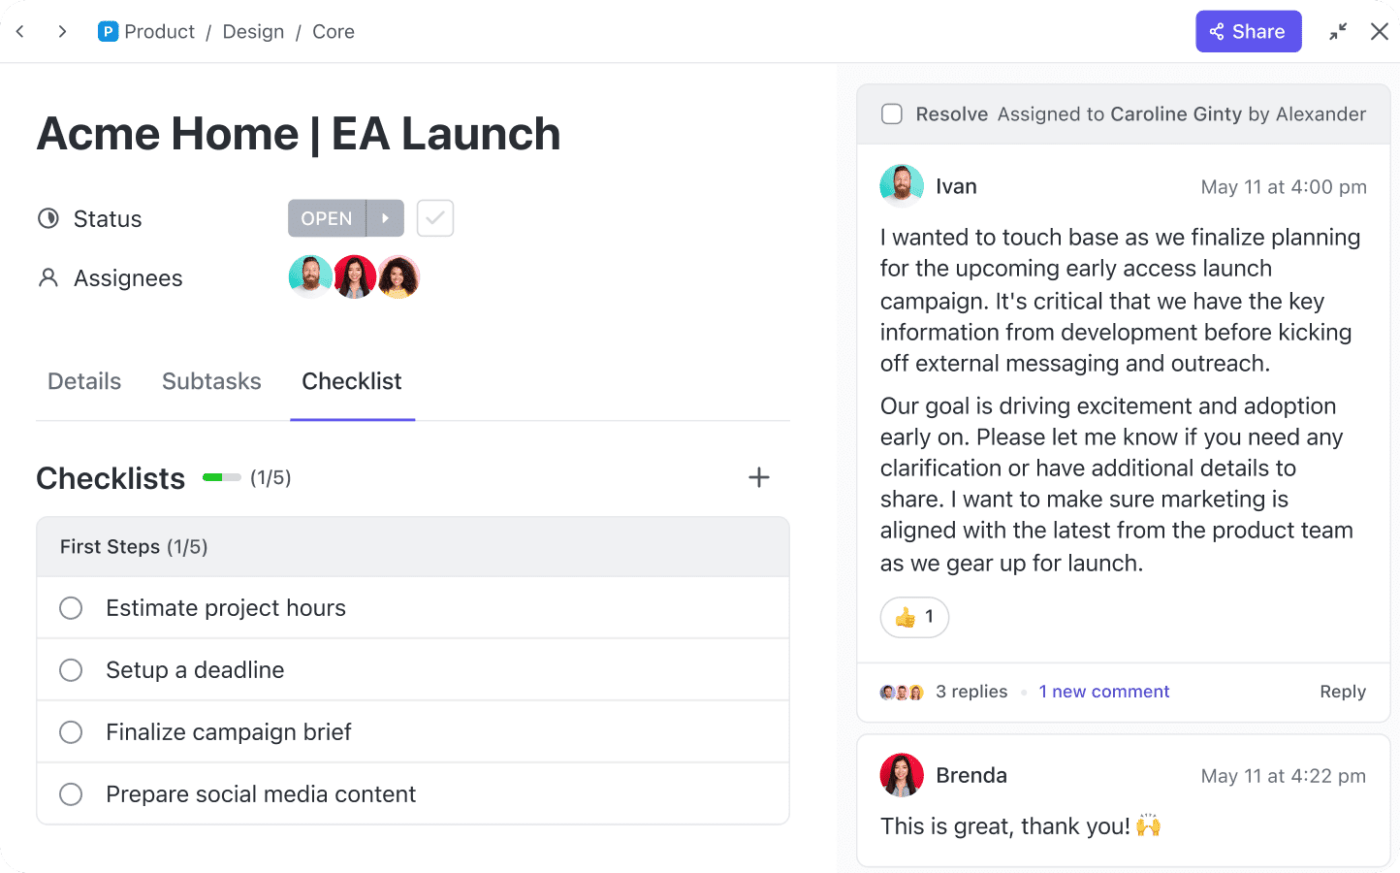
A clear and well-defined task list is the foundation of any successful project. It helps break down goals into manageable steps, helps you identify critical milestones, keeps you organized, and ensures everyone involved is on the same page.
But how do you ensure your task list is comprehensive, prioritized, and easy to track? ClickUp Tasks can help.
Here’s how:
- Brainstorm: Start by brainstorming everything that needs to be done to achieve your project goals with Tasks
- Break down large tasks: Once you have a comprehensive list, break down large tasks into smaller, more manageable subtasks. ClickUp allows you to create nested subtasks within a task, providing a clear hierarchy of actions needed
- Organize by lists and tags: Keep your tasks organized for easy navigation. For example, tag tasks by team member or project phase
- Assign tasks and deadlines: Delegate tasks to team members and set realistic deadlines to ensure accountability
- Review and adapt: Regularly review your task list and make adjustments as required
Step 3: Set a timeline
Now that your task list is ready, it’s time to map out a project schedule or timeline.
However, creating a timeline from scratch can be time-consuming.
That’s where the ClickUp Project Timeline Whiteboard Template can help.
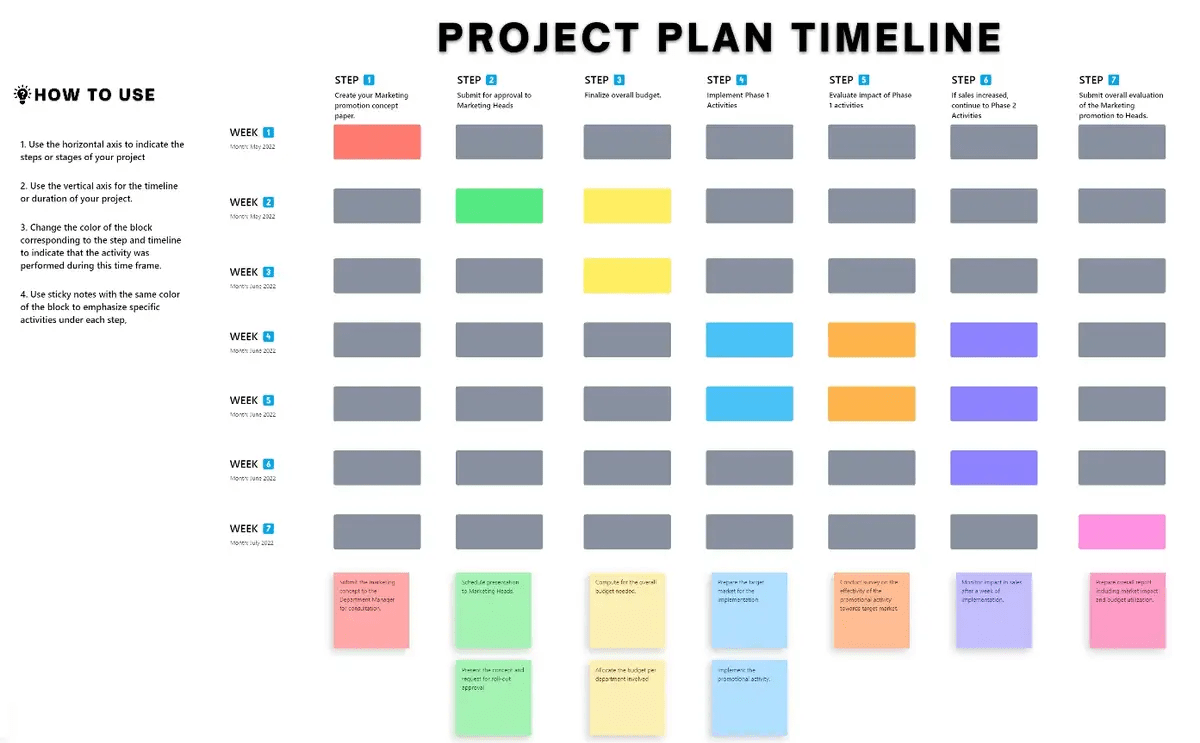
This template can help you with:
- Visual representation: Represent your project’s key phases, tasks, and milestones on a timeline
- Custom Statuses: Manage project flow effectively by assigning customizable statuses to tasks, such as ‘Open,’ ‘In Progress,’ and ‘Completed’
- Custom Fields: Tailor the template to your specific needs by adding custom fields
- Seamless integration: Integrate seamlessly with other ClickUp features and manage tasks, assignments, and communication within the same platform
Step 4: Determine key milestones
Milestones are critical moments in the project timeline that signify significant progress or achievements. Each milestone represents the completion of a substantial phase, the delivery of a critical component, or meeting a vital performance target.
ClickUp Milestones offers a user-friendly tool to identify and manage these critical milestones effectively.
Some of the features that ClickUp Milestones offers include:
- Custom Fields: Create custom fields for milestones, enabling you to define specific criteria or attributes that are relevant to your project
- Dependency tracking: Set dependencies between milestones, indicating which milestones must be completed before others begin. This helps visualize the project’s critical path and ensures that milestones are sequenced appropriately
- Milestone status: Track the status of each milestone. You can also set completion criteria for milestones to ensure that they are met
- Customized reports: Generate reports based on milestones to help you track progress, identify areas for improvement, and make data-driven decisions
Step 5: Create your milestone chart
Now that you’ve identified your tasks and milestones, it’s time to create the actual milestone chart. The chart should clearly show the sequence of tasks, their dependencies, and the critical milestones.
ClickUp offers various tools to help you build an intuitive and dynamic chart. This includes a library of 1000+ templates for you to choose from. Let’s explore them together.
ClickUp Milestone Chart Template provides an excellent starting point for visualizing your project milestones.
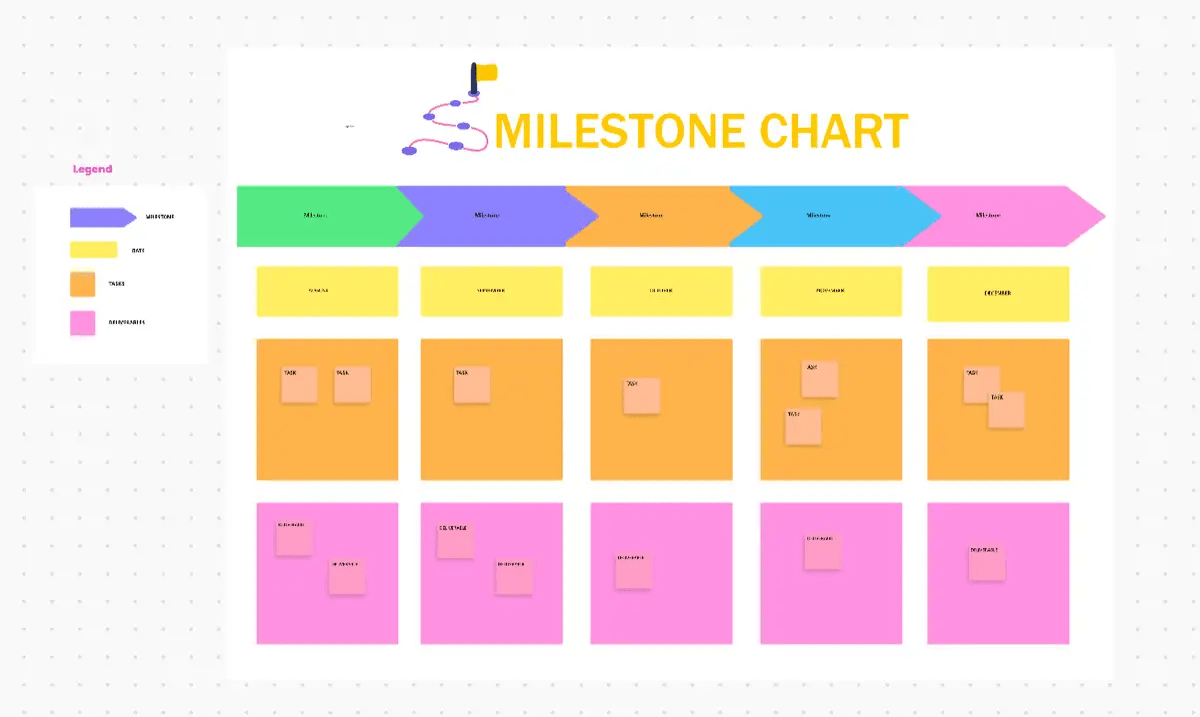
Here’s how this milestone template simplifies the process:
- Pre-built structure: Pre-populated sections for tasks, milestones, and a dedicated space for your project timeline
- Easy milestone identification: Visually distinct milestones appear as diamond icons within the timeline
- Customization options: Add your project name, logo, and color scheme to align the chart with your branding
ClickUp’s Gantt Chart View offers another powerful way to visualize your project timeline and milestones.

It provides a comprehensive overview of:
- Task dependencies: Visually depict and define dependencies between tasks
- Task duration: See each task’s duration in a bar on the chart
- Task-milestone relationships: Easily see how tasks relate to specific milestones
- Resource assignment: Assign resources (e.g., team members, equipment) to specific tasks and milestones
- Milestone status: Track the progress of each milestone directly on the Gantt Chart view
- Drag-and-drop functionality: Easily adjust the timeline of tasks and milestones by simply dragging and dropping them
Step 6: Share the chart with stakeholders
Communication is key in project management. Present the chart to all relevant parties, including your team, clients, and management.
ClickUp Docs allows you to seamlessly document your milestone chart within the same platform and share it with stakeholders. They can leave comments and ask questions directly within the document, encouraging clear communication and feedback.
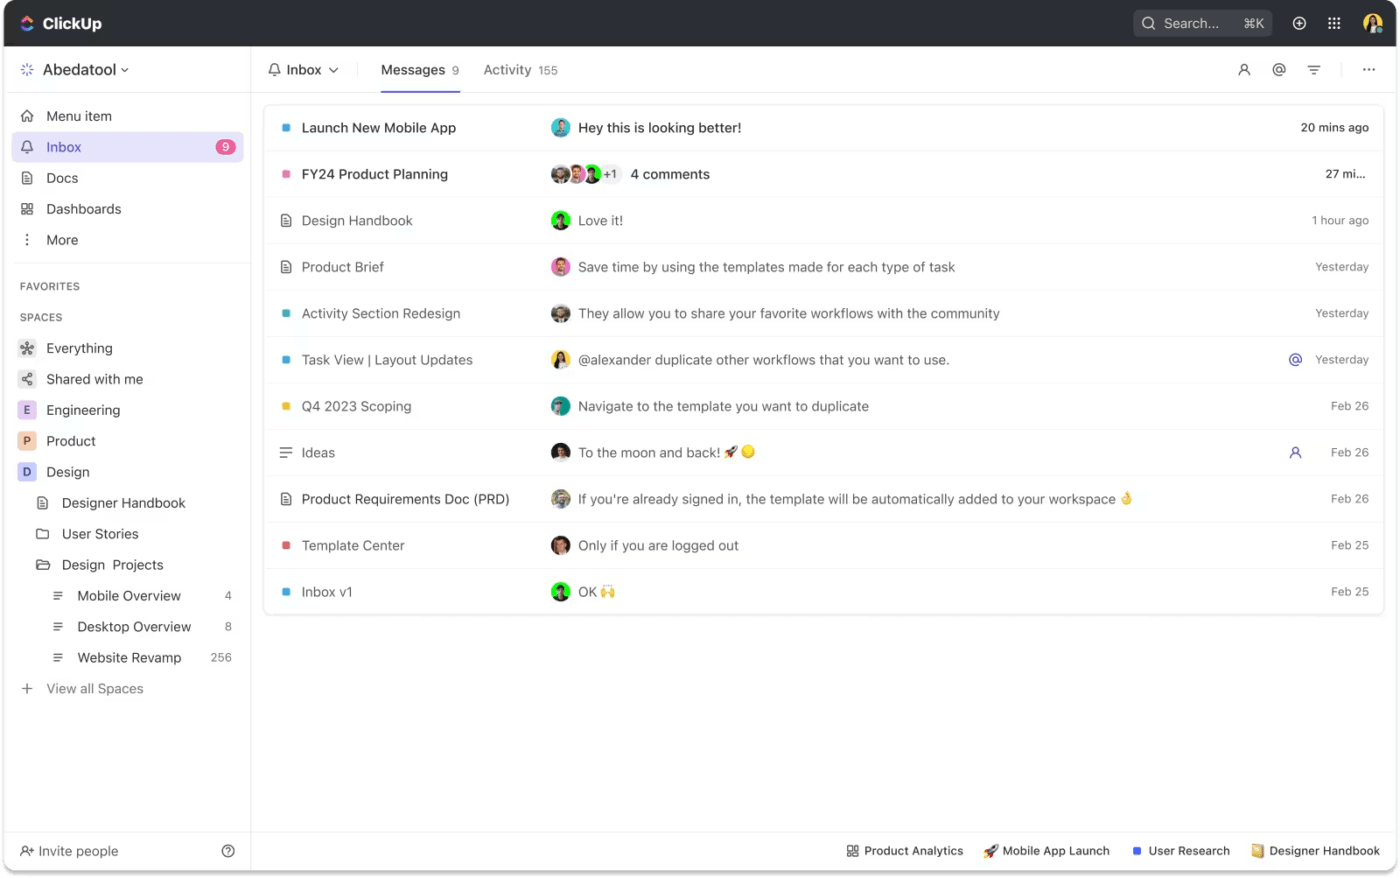
Additionally, ClickUp Inbox serves as a central communication hub for all project-related updates, including your milestone chart.
Stakeholders receive real-time notifications whenever your milestone chart embedded within the ClickUp Doc is updated. This ensures everyone is kept informed about any changes to the project timeline.
Step 7: Track progress at every milestone
With your chart in place, the final step is ongoing monitoring.
Use ClickUp Dashboards to monitor progress closely. Regularly check how your team advances through each milestone, adjust milestones if needed, and provide timely updates to stakeholders on achievements or potential delays.
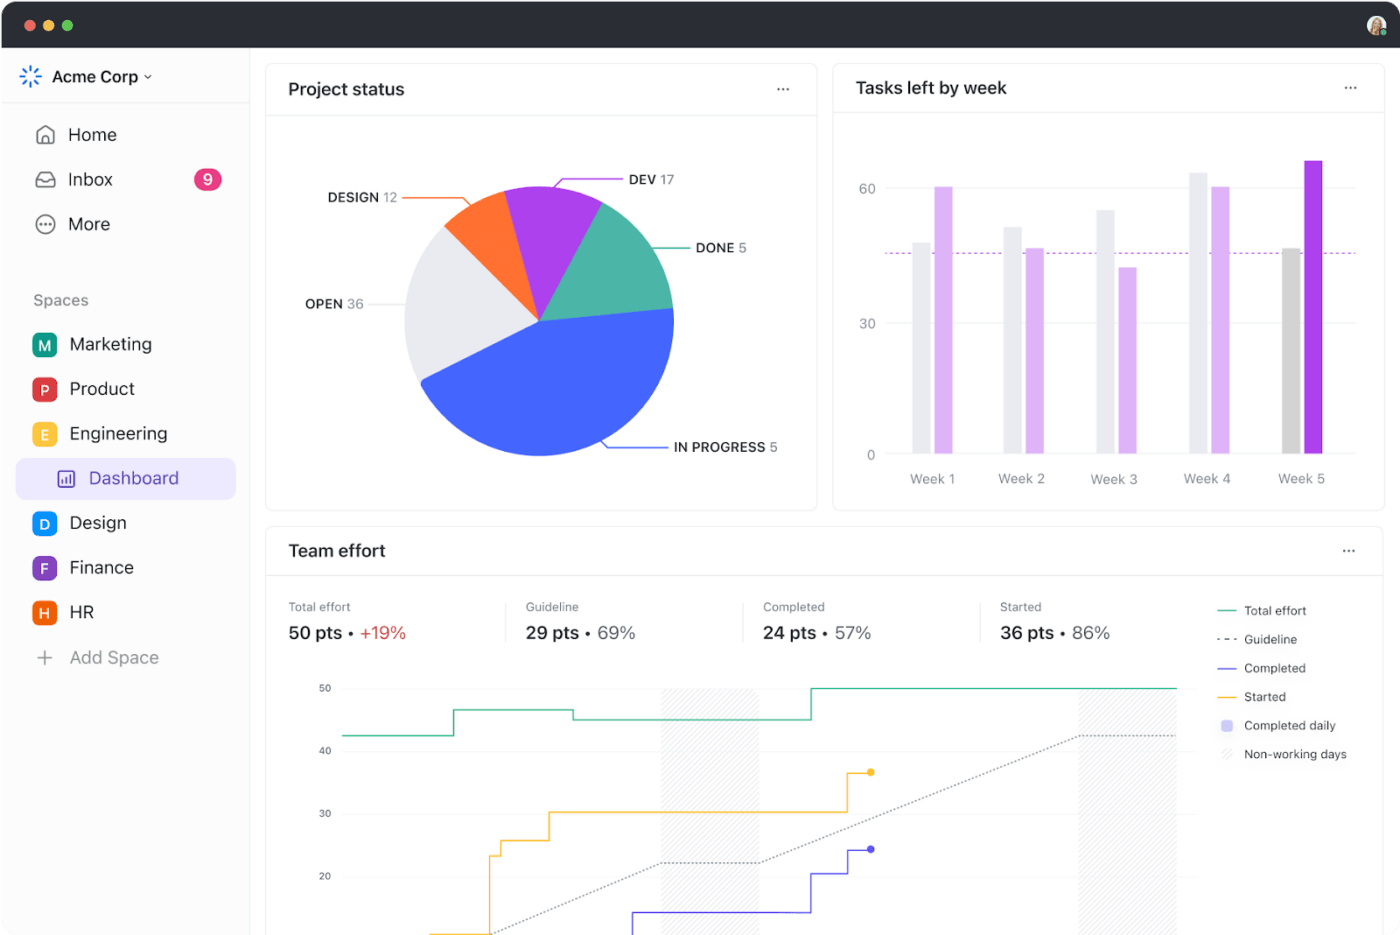
Rich project management analytics ensure that you stay proactive, addressing any issues before they become major roadblocks.
More Ways to Visualize Your Project Management Milestones
If you’re looking for simpler ways to create milestones, ClickUp provides a variety of beginner-friendly templates designed to facilitate the process.
These templates cater to different project needs, making it easier to create and manage milestone charts effectively.
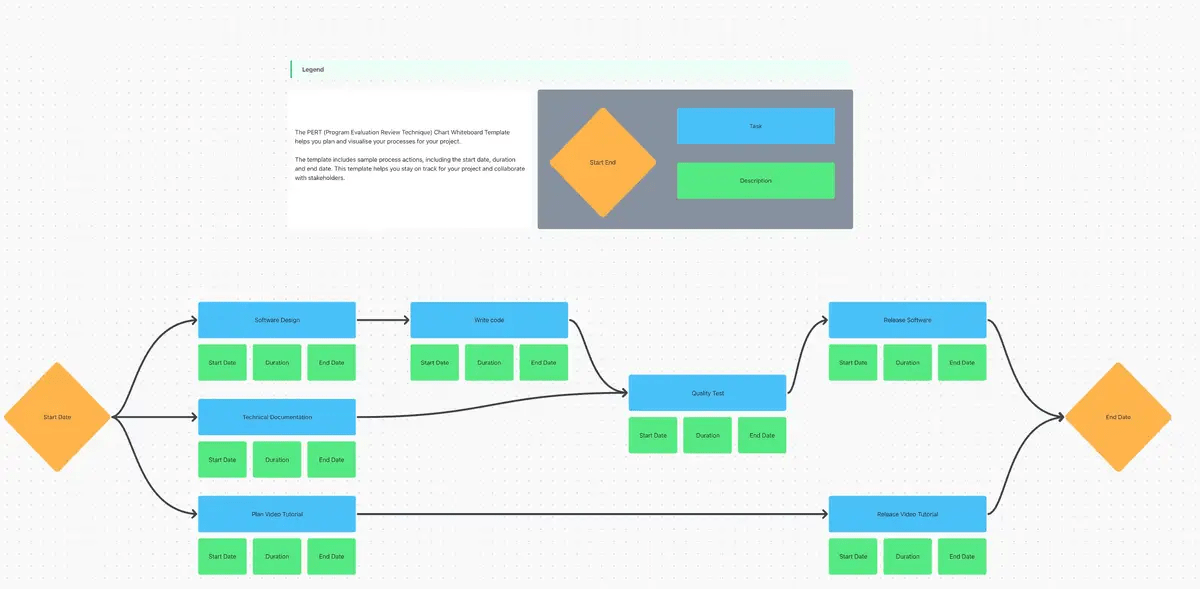
For example, the ClickUp PERT Chart Template provides a flexible approach for visualizing project tasks, dependencies, and durations. It’s great for mapping out complex projects.
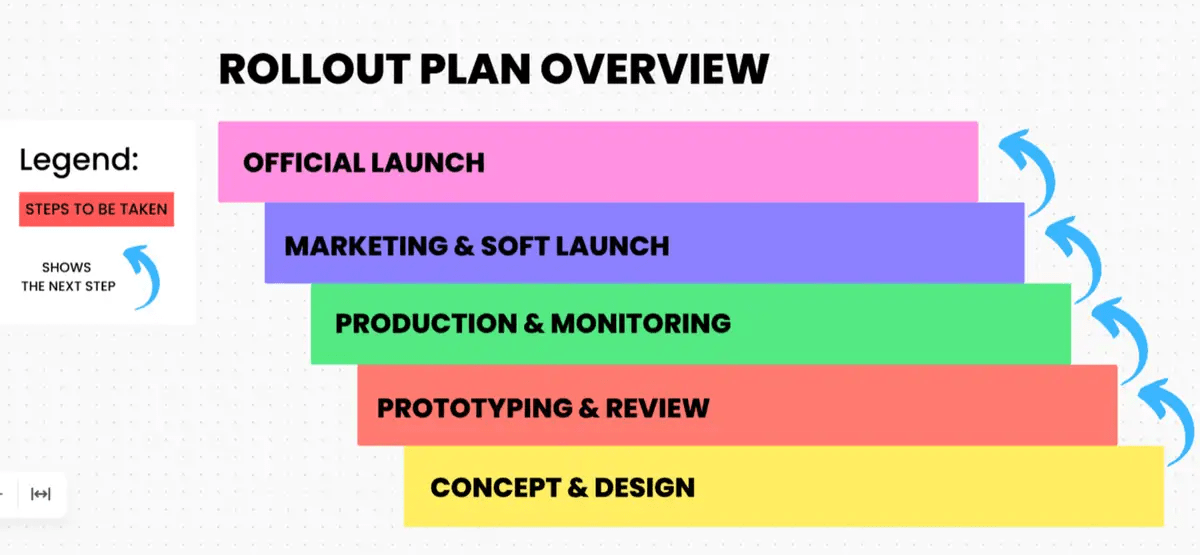
Also, the ClickUp Software Rollout Timeline Template is tailored specifically for software rollout projects and helps structure the unique stages involved in deployment. It includes key stages like development, testing, and deployment, offering a ready-made timeline.
Common Mistakes to Avoid While Using Milestones in Project Management
Even with thorough planning and diligent tracking of milestones, unexpected challenges can arise that may derail a project’s progress. It’s essential to be aware of potential pitfalls that could undermine the effectiveness of your milestones.
Overlooking key milestones
One common mistake is failing to identify and track all critical milestones within a project. Underestimating the importance of certain milestones can lead to gaps in the project.
Misaligning milestones with project goals
Another mistake is setting milestones that are not directly aligned with the project’s objectives. If milestones are irrelevant to the project’s goals, they will derail the project and become counterproductive.
Ineffective tracking and updates
Insufficient monitoring can hinder your ability to identify potential issues early on, while delayed updates can lead to misunderstandings and costly delays.
Create Efficient Milestone Charts with ClickUp
Milestones are essential cornerstones of a successful project. They represent due dates, such as the completion date, key events, and other progress markers.
ClickUp is project management software that provides features to identify major milestones, visualize project schedules, and create project deliverables.
These features create a seamless experience for setting objectives, planning tasks, tracking progress, improving team communication, and ensuring that project stakeholders stay informed.
Additionally, its integrated platform helps facilitate your project management process with customizable features and milestone templates.
Ready to optimize your project management? Sign up to ClickUp today!


Everything you need to stay organized and get work done.

Recent Articles
Claude Skills for Project Management: A Practical Guide 
Claude Skills for Project Management: A Practical Guide
How to Write a Scope of Work (+ Examples & Templates)
How to Write a Scope of Work (+ Examples & Templates)
What Are Project Goals? Definition, Examples & How To Write Them 
What Are Project Goals? Definition, Examples & How To Write Them
