Project Management Analytics: A Detailed Guide to Turning Data into Valuable Insights

Sorry, there were no results found for “”
Sorry, there were no results found for “”
Sorry, there were no results found for “”
Project managers are like ship captains—they guide their crews in the right direction and avoid storms to reach their destinations timely and safely. On their journeys, neither project managers nor captains rely on gut feelings or hunches. They make the best decisions based on available information. 🛳️
To sail smoothly and enable project success, project managers gather all kinds of data and look for hidden trends and patterns within it. These insights, or project analytics, are like guiding stars, showing you which path to take to improve project performance while minimizing risks.
In this article, we’ll explain the importance of project management analytics for tracking project progress, improving project outcomes, and allocating resources. We’ll also discuss a couple of essential metrics to keep an eye on if you want to make data-driven decisions.
Lastly, we’ll recommend data analytics project management software to help you collect, track, and analyze complex project data.
Any successful project manager knows that data can speak—you just need to learn how to listen and understand it. Project management analytics is all about turning raw data into actionable information that should guide every project decision.
Project management analytics is comprised of principles and components that drive decision-making and help you collect and interpret relevant data:
Imagine being dropped in the woods without a phone, compass, or any instructions on where to go—that’s how a project manager feels without data.
Without project analytics, project managers have no insight into project performance and can’t figure out what strategic decisions to make to improve it. 🧭
Here are some specific benefits you’ll get from relying on data analytics for project management:
There are no good or bad metrics in project management analytics, but there are irrelevant ones.
For example, if you’re running a social media campaign for a client, one of the essential metrics you’ll track is the number of post likes and shares. But the same metric doesn’t mean a thing when your project is optimizing internal document management processes.
That said, there are a few “universal” metrics to keep an eye on regardless of your project’s size, scope, and goals.
Time-tracking metrics shed light on a project’s progress rates, your team’s productivity, and potential bottlenecks. ⏳
These metrics provide insights into your project from the time perspective and help you optimize resources, spot delays and inefficiencies, and build a solid basis for forecasting future project outcomes.
Typical examples are:
Cost management metrics let you analyze your tasks and projects from a financial point of view and see whether and how much specific strategies and processes pay off. 💸
These metrics are invaluable for understanding your project’s financial health, creating a sustainable project budget, and ensuring you’re not wasting money on low-value activities.
These are the common cost management metrics to keep an eye on:
These metrics focus on everything that could potentially jeopardize your project’s health and performance. They let you identify bottlenecks and react as soon as possible to minimize their effect on your project. ❌
Check out some examples:
If you want to understand the effectiveness, performance, and value of your product or service (and trust us, you do), you need quality metrics. They help you establish areas for improvement and work on them to deliver more value to your customers and optimize processes.
Dig deeper into quality metrics examples:
Scope management metrics show how efficiently you’re managing a specific project scope compared to different parameters like budget or timelines.
Typical examples are:
These metrics help you understand the team’s dynamics and engagement and determine if and how well your team members work together. Let’s check some out:
Stakeholder metrics are a reflection of your customers’ loyalty, engagement, and satisfaction levels. Keep an eye on the following metrics:
Thorough and to-the-point data analytics makes managing tasks and projects much easier because you can clearly distinguish what’s working and what’s not and adjust your processes on the fly.
Implementing data analytics in project management can seem overwhelming at first—you may be confused by the number of available metrics and ways of interpreting them. Below are some of the best steps to help you get started.
Before getting into data analytics, you must ask yourself a simple yet essential question: Why am I doing it? Do you want to optimize resources, standardize a specific process, manage risks, or enhance customer satisfaction?
If you can’t define your goals and objectives, you won’t be able to pinpoint relevant metrics and may end up wandering around aimlessly.
If your team isn’t used to detailed project management analytics, they may need an extra hand to adjust their mindsets and understand what’s expected of them. You (the manager) need to ensure everyone on the team is clear on the importance of data analytics and their role in the bigger picture.
Help out your team by creating comprehensive documentation that describes processes related to analyzing project data. That way, you can minimize mistakes and misunderstandings and ensure your team can implement data analytics principles from the get-go.
A data analytics strategy that works for you today may be useless tomorrow. To ensure your efforts pay off, you must revise your approach to adjust it to the market or specific project demands.
Data analysis, visualization, and interpretation are much more manageable with reliable software by your side. With the right project management data analytics tool, you’ll be able to:
…And that’s just the tip of the iceberg! If you’re unsure which tool to choose, try ClickUp, a first-class task and project management platform for enterprises, small businesses, and freelancers.
ClickUp can help you turn data into fuel for streamlining processes and fostering a continuous improvement culture. Let’s dig deeper into its features:
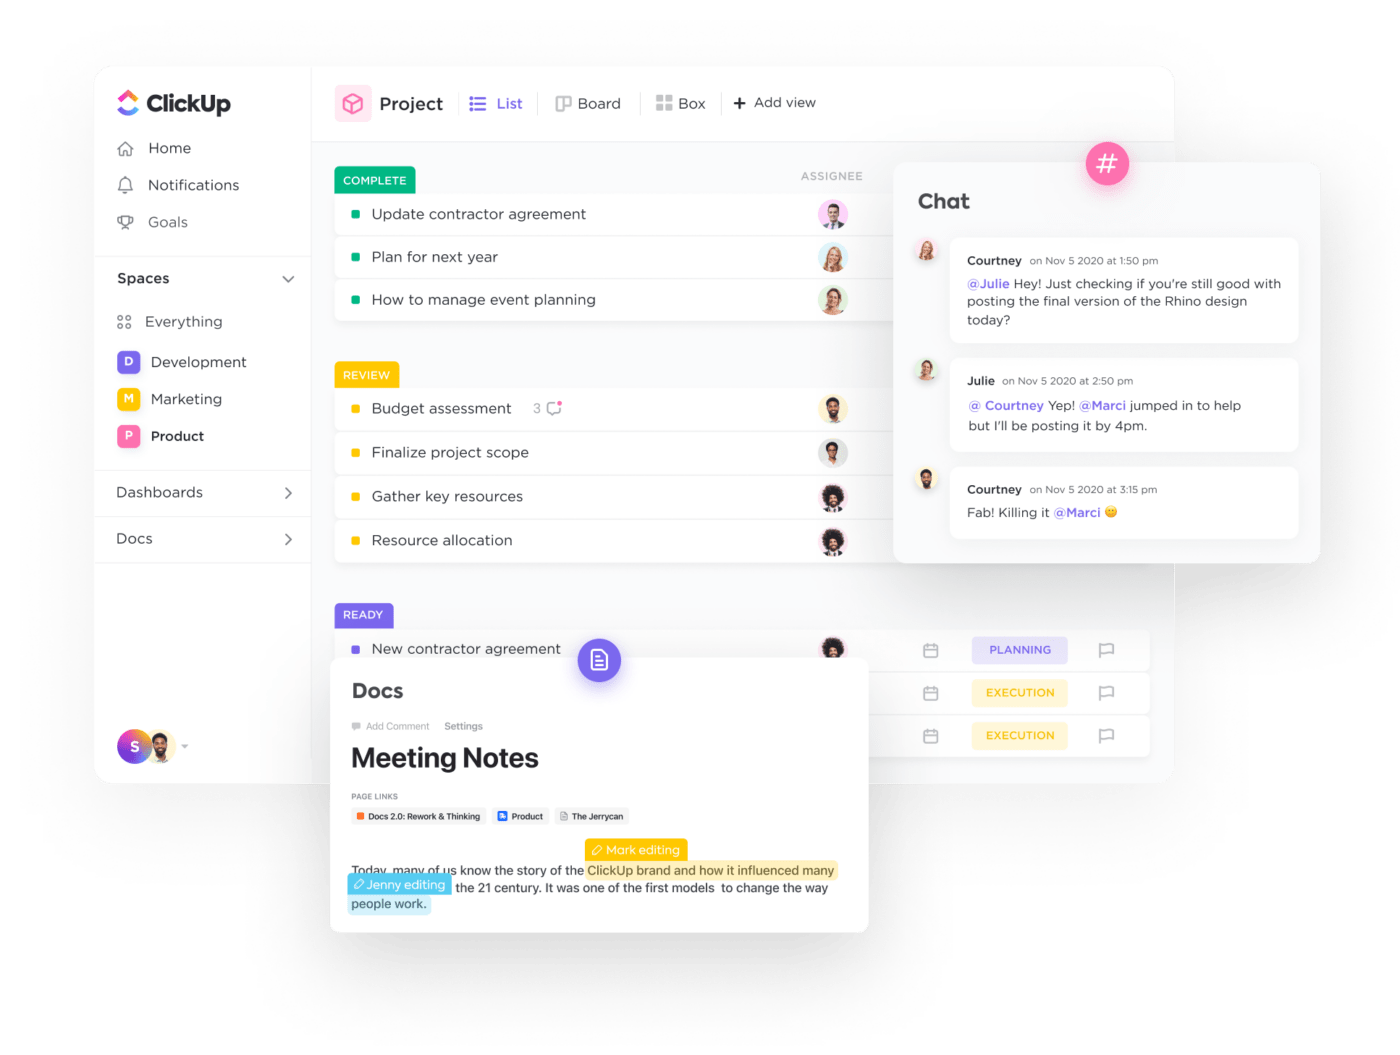
ClickUp Project Management is a suite of features that make visualizing data and tracking projects throughout their entire lifecycle a breeze.
The platform lets you observe projects from 10+ perspectives thanks to ClickUp views. All views are fully customizable, so you can adjust them to your workflows in no time.
Choose the classic List view to group, sort, and filter tasks based on criteria like assignee, priority, due dates, or entirely custom parameters you set through Custom Fields.
To visualize workflows and easily track and change task and project statuses, go for the Kanban-style Board view.
Determine time-tracking metrics with the Timeline view or zoom in on your team’s performance with the ClickUp Workload view.
Another view you’ll love is the Form view. Use it to customize surveys and get insight into customer satisfaction, employee engagement, team collaboration, and other metrics.
One of the best ClickUp features for project management is ClickUp Docs, a superb platform for creating, managing, and storing documents. With it, you can create documents describing different analytics procedures or offer training and support for implementing and visualizing data.
If you want to save time when creating a Doc, use ClickUp Brain, the software’s AI-powered neural network that can answer any question about your company and projects.

ClickUp Automations are also a part of the platform’s project management package—use them to automate repetitive tasks, minimize mistakes, and allow your team to focus on more valuable activities.
The cherry on top of the project management cake is ClickUp integrations. The platform connects to 1,000+ apps and platforms, so you can extend its functionality, centralize work, and prevent distracting context switching.
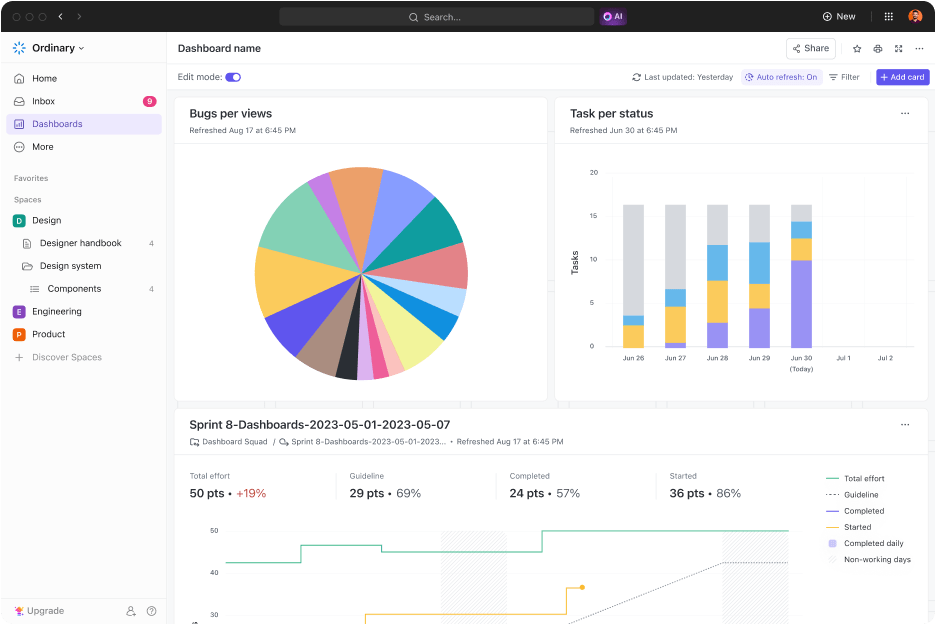
Get a high-level overview of your work or zero in on specific aspects and processes with ClickUp Dashboards, your projects’ perfect mission control center.
Use the Dashboards to monitor project progress, perform calculations, assess team capacity, track time, and zoom in on any metric that interests you. Leverage the insights from your Dashboard for accurate forecasting and making informed, data-based decisions.
The Dashboards are fully customizable with 50+ widgets known as cards. Choose from pie, line, and bar graphs, Burnup and Burndown charts, and various other visualization options to see your project management data the way you want.
ClickUp has a template library with over 1,000 options for various scenarios and usage cases, from marketing and HR to finance and personal use. Over 200 templates revolve around project management, and many of them can be valuable allies in project management analytics.
For example, data flow diagram templates help you map out data, visualize processes and activities, and ensure data consistency and accuracy.
ClickUp’s KPI templates let you gain insight into specific metrics, learn from this data, and drive your team forward. 💪

Diving into the world of project management analytics can be overwhelming without the right tools. With an all-in-one project management software like ClickUp, you’ll be able to keep track of and visualize any metric you’re interested in. Not only that, but you’ll also have total control over your complex projects and complete freedom to customize workflows.
Sign up for ClickUp for free and explore its project management superpowers! 🦸

Sudarshan Somanathan
Max 22min read
Sudarshan Somanathan
Max 25min read

PMO Team
Max 9min read

© 2026 ClickUp


