Business intelligence software Blog Feature

10 Best Business Intelligence (BI) Software in 2024

Data is an integral part of any business, helping you understand what’s going on behind the scenes and offering insights into valuable metrics. But managing data can be overwhelming, particularly if your team doesn’t have data-driven processes in place.

In fact, studies show that 74% of employees surveyed felt unhappy working with data. That’s where business intelligence tools come in.

They’re the brains of the operation. 🧠

Business intelligence (BI) software takes company facts and figures, dives deep, and crafts visual data reports that you can use to guide business decisions. The same study from above reported that companies that use BI software see a five-fold increase in the likelihood of making faster decisions.

Ready to make faster, more informed decisions using relevant company data? Here are the 10 best business intelligence software to get the job done.

Plus, we’ll highlight additional tools like the best project management software and show you what to look for when selecting the right platform. 🤩

Summarize this article with AI ClickUp Brain not only saves you precious time by instantly summarizing articles, it also leverages AI to connect your tasks, docs, people, and more, streamlining your workflow like never before.
ClickUp Brain
Avatar of person using AI Summarize this article for me please

What is Business Intelligence Software?

Business intelligence software is a tool that collects and analyzes company data and presents it in easy-to-understand graphs, reports, and charts. This software uses data mining to scrape information, employs data analytics to assess details, and produces data visualizations to make conclusions clear.

With these business intelligence tools, anyone can gather data-based information, not just highly skilled analysts. This type of software doesn’t just gather data, it keeps all your data stored in one convenient location.

That means you have all the insights you need in one place — without switching between products—making data visualization and access to multiple data sources much easier.

Most BI tools let you customize the data sources to create actionable insights in areas that matter most for your business. Pull custom reports and dive deeper into the metrics that can impact the success of your business using these intelligent tools. 💪

Summarize this article with AI ClickUp Brain not only saves you precious time by instantly summarizing articles, it also leverages AI to connect your tasks, docs, people, and more, streamlining your workflow like never before.
ClickUp Brain
Avatar of person using AI Summarize this article for me please

What Should You Look for in Business Intelligence Software? 

When it comes to business intelligence tools, there are tons of options on the market, but not all are created equal. 👀

Here’s what to look for in BI tools:

  • Intuitive and interactive dashboards: Simplify complex data and make it easy to get buy-in from key stakeholders with customizable dashboards and data visualization
  • Built-in AI: Artificial intelligence tools offer deeper insights and assess data from various angles, making it more comprehensive
  • Integrations: The best Business intelligence tools work with other data platforms and applications for optimized workflows
  • Data mining tools: Look for software that’s capable of analyzing a wide range of data sets using diverse and advanced analytics tools
  • Smart data alerts: Trigger notifications for good and bad data points so your reports aren’t skewed by inaccurate metrics
Summarize this article with AI ClickUp Brain not only saves you precious time by instantly summarizing articles, it also leverages AI to connect your tasks, docs, people, and more, streamlining your workflow like never before.
ClickUp Brain
Avatar of person using AI Summarize this article for me please

The 10 Best Business Intelligence Software to Use in 2024

Start making data-driven decisions with these 10 best business intelligence software options. From ETL engines and data warehouses to data visualization tools, they offer a large suite of benefits for businesses analyzing their company data.

For each one, we’ve highlighted key features, potential drawbacks, pricing, and rating information so you can choose the one that fits your business needs best. ✨

1. SAP BusinessObjects Business Intelligence

Business intelligence software: sales analysis dashboard created in SAP BusinessObjects
via SAP BusinessObjects

SAP BusinessObjects is a BI suite that offers a scalable platform and control over data insights in one convenient space. The flexible design lets you gather data whether you’re a small business with a few employees or a large firm with thousands of team members. 🙇‍♀️

Its business intelligence capabilities are trusted by some of the largest companies and industries across the globe—making it one of the top BI tools for enterprise business users.

SAP BusinessObjects Business Intelligence best features

  • Real-time data gives up-to-the-minute insights and advanced analytics into the metrics that matter most for your business
  • Reporting goes beyond the numbers features to assess root causes and ad hoc queries to get the answers you need, fast (even across multiple data sources)
  • Self-service business intelligence capabilities and data visualization tools give you power over data and the way you want to see it
  • Sharing permissions lets you collaborate with different departments or within your own team for better decision-making processes

SAP BusinessObjects Business Intelligence limitations 

  • While pricing is customized, it tends to be on the higher-end
  • Some users wished integrations were smoother and more seamless

SAP BusinessObjects Business Intelligence pricing

  • Contact for custom pricing

SAP BusinessObjects Business Intelligence ratings and reviews

  • G2: N/A
  • Capterra: 4.3/5 (200+ reviews)

2. Microsoft Power BI

Business intelligence software: customizing a dashboard in Microsoft Power BI
via Power BI

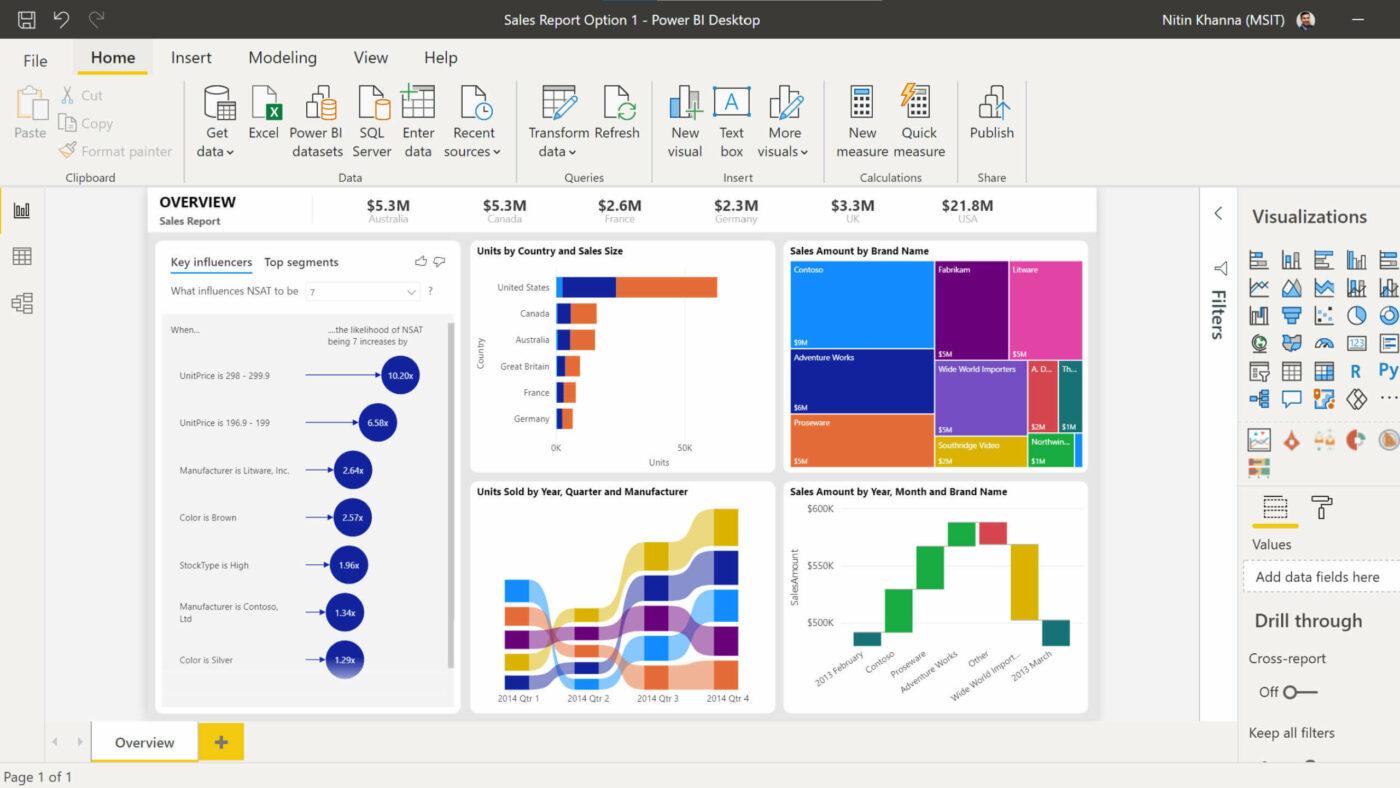
Offered by Microsoft, Power BI is a data analytics tool that lets you visualize metrics to make decisions that take your business to new heights. Conduct data analysis by connecting metric sources and adding them to the OneLake data hub with its business intelligence tools.

From there, customize dashboards to see your data and generate insights.

Microsoft PowerBI best features

  • Built-in AI features answer questions, instantly generate reports, and highlight patterns in data for faster analysis
  • Share and embed reports across Microsoft’s suite of tools, including Excel Spreadsheets, PowerPoint, and Teams
  • Microsoft governance, security, and compliance features protect your data and offer end-to-end visibility
  • Free training resources mean anyone on the team can learn how to use the tool and dive into analytics

Microsoft PowerBI limitations 

  • Some users found the tool struggles with complex or extremely large data sets
  • It’s not an on-premise solution since it’s a cloud-based tool

Microsoft PowerBI pricing

  • Power BI in Microsoft Fabric: Free
  • Power BI Pro: $10/month per user
  • Power BI Premium: $20/month per user

Microsoft PowerBI ratings and reviews

  • G2: 4.5/5 (1,000+ reviews)
  • Capterra: 4.6/5 (1,500+ reviews)

3. Zoho Analytics

Business intelligence software: customizing data in Zoho Analytics
via Zoho

Zoho is a trusted software company offering a software suite that includes a CRM, process automation tools, and IT products. Their data tool, known as Zoho Analytics, discovers hidden insights from connected data.

Analyze the results and build reports thanks to custom visualization tools that are easily shareable with the whole team. 📈

Zoho Analytics best features

  • Connect raw data using a large selection of integrations, business apps, and various files and data sources with its business intelligence tools
  • Use the self-service data preparation tools to customize reports, clean up data, and catalog information 
  • Augment data with insights powered by machine learning tools that predict future trends and offer what-if data analysis
  • Embed analytics without needing SQL support, thanks to no-code and low-code models

Zoho Analytics limitations 

  • Some users found that data synchronization took several hours to complete
  • Not all reports include activity logs, which can be limited for auditing purposes

Zoho Analytics pricing

  • Basic: $24/month, billed annually
  • Standard: $48/month, billed annually
  • Premium: $115/month, billed annually
  • Enterprise: $455/month, billed annually
  • Custom: Contact for pricing

Zoho Analytics ratings and reviews

  • G2: 4.2/5 (200+ reviews)
  • Capterra: 4.4/5 (200+ reviews)

4. Tableau

Business intelligence software: customizing data visualizations in Tableau
via Tableau

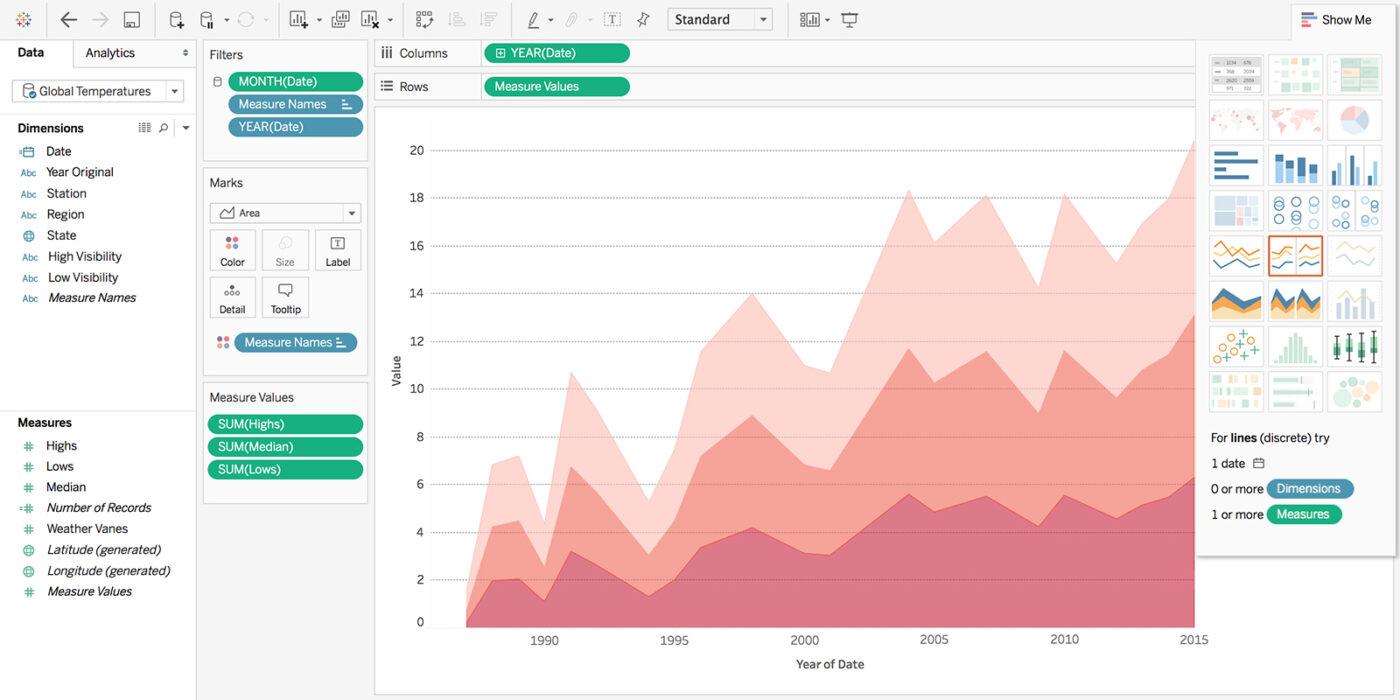
Tableau from Salesforce lets you visualize analytics with integrated reporting tools and AI-backed products. As for business intelligence tools, Tableau stands out because it takes big data and KPIs, turns them into reports, and creates actionable insights.

Offering dozens of products, choose from data management, embedded analytics, and CRM analytics to generate the information you need to make business decisions.

Tableau best features

  • Data visualizations are more powerful than other tools with a high degree of customization
  • Drag-and-drop functionality lets you pull in the exact data you want to see, while built-in guardrails prevent data visualization missteps that go against best practices
  • A smaller learning curve makes it easier to get up to speed and use the business analytics platform
  • Tableau excels at gathering and analyzing large data sets, even if your business runs off complex metrics

Tableau limitations 

  • Some users wish there was more customization when it comes to formatting
  • Pricing can be on the higher end of the spectrum, and you have to pay for viewers

Tableau pricing

  • Creator: $75/month per user
  • Explorer: $42/month per user
  • Viewer: $15/month per user

Tableau ratings and reviews

  • G2: 4.4/5 (1,900+ reviews)
  • Capterra: 4.5/5 (2,000+ reviews)

5. Oracle Business Intelligence

Business intelligence software: charts and pivot tables in Oracle BI
via Oracle

This business intelligence platform offers centralized data management along with a wide range of BI services, including ad hoc queries, dashboards, and financial reporting. The suite of tools makes it easy to analyze data, share it in reports, and trigger actionable insights and next steps for faster business processes.

Oracle BI best features

  • Connection with web-based applications like J2EE and .NET offers rich data integration and access to large data sets
  • Oracle BI Answers make it easy to create charts, pivot tables, and dashboards for data modeling and interactive visual analytics
  • BI Delivers is a special feature that instantly sends out data-based notifications and alerts for workflow optimization
  • The Publisher tool makes it easy to share business data with stakeholders, investors, clients, and the internal team

Oracle BI limitations 

  • System requirements, including memory and disk space, can be limiting
  • Limited dashboard customization compared to other business intelligence tools

Oracle BI pricing

  • Contact sales for pricing

Oracle BI ratings and reviews

  • G2: 3.3/5 (10+ reviews)
  • Capterra: 4.1/5 (80+ reviews)

6. Qlik Sense

Product sales dashboard created in Qlik Sense
via Qlik Sense

Designed for business users of all skill elves, this cloud analytics tool offers AI-powered insights and generates reports based on your company data. Machine learning and artificial intelligence tools offer data prep, natural language interactions, and predictive analytics. ✅

Qlik Sense best features

  • Various SAP Connectors let you integrate OLAP, BEx, ETL, and query tools for deeper data analytics
  • Data Warehouse Automation continually scrapes business data, refines models, and builds a trusted data catalog
  • Alerting and action automations let you send notifications and create tasks based on data insights
  • The single SaaS platform offers a hybrid cloud interface, offering greater control over security, sharing, and data storage

Qlik Sense limitations 

  • Large data analysis and data sets can slow down the tool
  • Some add-ons and plugins cost extra and plan pricing is high, which is challenging for smaller budgets

Qlik Sense pricing

  • Standard: $20/month per user
  • Premium: $2,700/month
  • Enterprise: Contact for pricing

Qlik Sense ratings and reviews

  • G2: 4.5/5 (600+ reviews)
  • Capterra: 4.4/5 (200+ reviews)

7. Yellowfin BI

Example of a dashboard created in Yellowfin BI
via Yellowfin BI

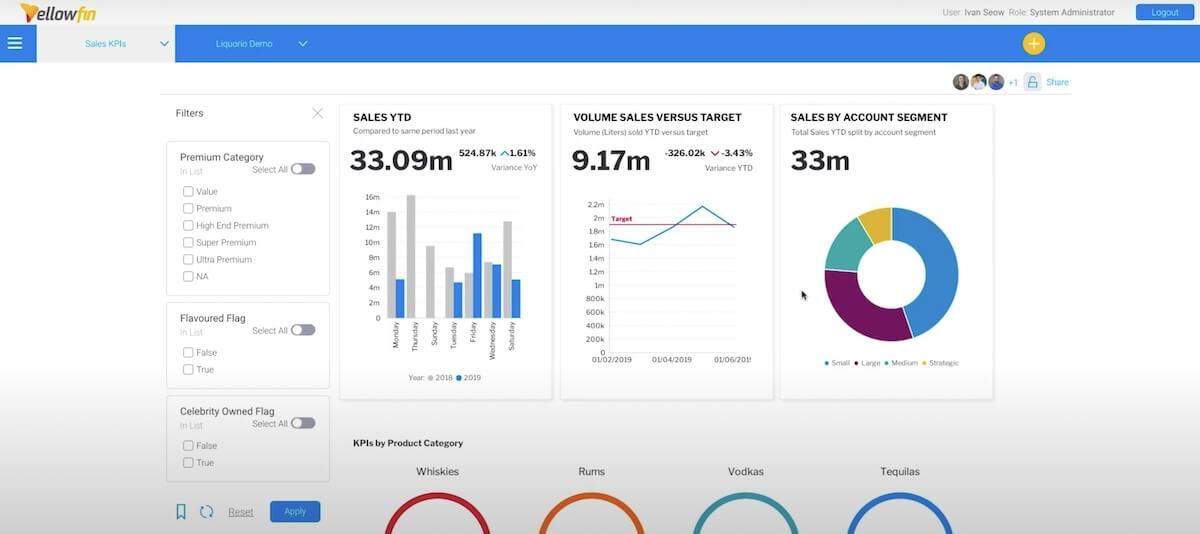
Visualize and understand data thanks to stunning dashboards and the option of self-service or AI-backed analytics with Yellowfin BI. Designed for all users, you don’t need to be a technical person to get this tool up and running. 

Yellowfin BI best features

  • Embedded operational workflows make it easy to generate action items based on business data and reporting
  • Set up alerts based on thresholds or use AI insights to monitor your business and automate notifications when critical signals are triggered
  • Drag-and-drop data visualizations cut down the time it takes to create engaging reports
  • Choose from various report builders and charts to make it easy for everyone on the team to create dashboards and visuals

Yellowfin BI limitations 

  • Data extraction can take time, especially with larger data sets
  • Some integrations could be smoother

Yellowfin BI pricing

  • Contact for custom pricing and plans

Yellowfin BI ratings and reviews

  • G2: 4.2/5 (100+ reviews)
  • Capterra: 4.6/5 (10+ reviews)

8. Dundas BI

Interactive visualization tools in Insightsoftware's Dundas BI
via Insightsoftware

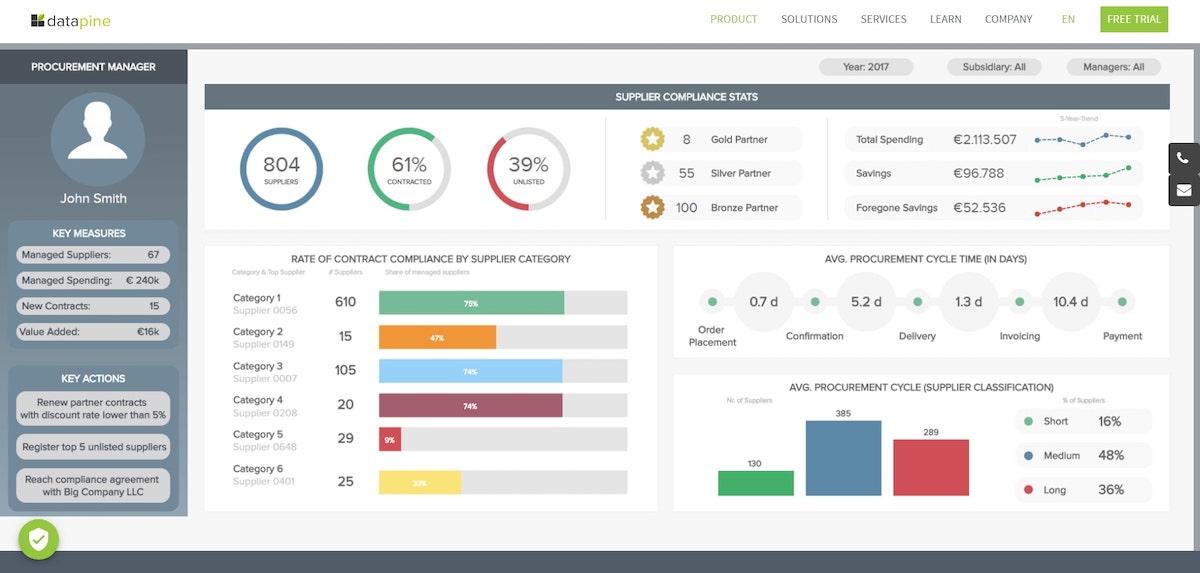
Dundas BI goes beyond visual dashboards with integrations and data structure tools that offer better visibility and enhanced analytics capabilities.

The premium tool focuses on user experiences, ensuring data insights are easy to share with team members and in the tool you use each and every day.

Dundas BI best features

  • Data connectivity and integration support reduce the time spent switching between tools so you get data insights faster
  • Interactive visualization tools let you control how you see and respond to data
  • The user-friendly interface offers customization and self-service support to drill down to the data that matters most
  • Flexible data warehousing enables greater control over the storage, extraction, and indexing of information

Dundas BI limitations 

  • Some users want more data analysis filters when segmenting
  • Large data sets may slow things down and cause glitches

Dundas BI pricing

  • Contact for pricing

Dundas BI ratings and reviews

  • G2: N/A
  • Capterra: N/A

9. Datapine

Example of a dashboard in Datapine
via Datapine

This modern business intelligence platform offers data security while making it easier to create reports, dashboards, and insights based on company metrics. Designed with a user-friendly interface, it’s easy for the whole team to use. That means everyone knows how to collect data, analyze it, and produce reports to inform decision-making at all levels of the business. 🛠️

Datapine best features

  • Choose from dashboard templates based on function, industry, and platform to create more targeted visuals 
  • Easy data connectors make it easy to gather data in one space without switching back and forth between tools
  • Predictive analytics tools take data and turn it into real-life scenarios so you can plan ahead
  • AI-based data alerts keep you on top of changes that can affect your business

Datapine limitations 

  • The mobile dashboard design isn’t as interactive as the desktop version
  • There’s a learning curve to explore the full suite of features

Datapine pricing

  • Free trial: 14 days
  • Contact for pricing

Datapine ratings and reviews

  • G2: 4.6/5 (20+ reviews)
  • Capterra: 4.9/5 (20+ reviews)

10. Sisense

Dashboards and visualizations in Sisense
via Sisense

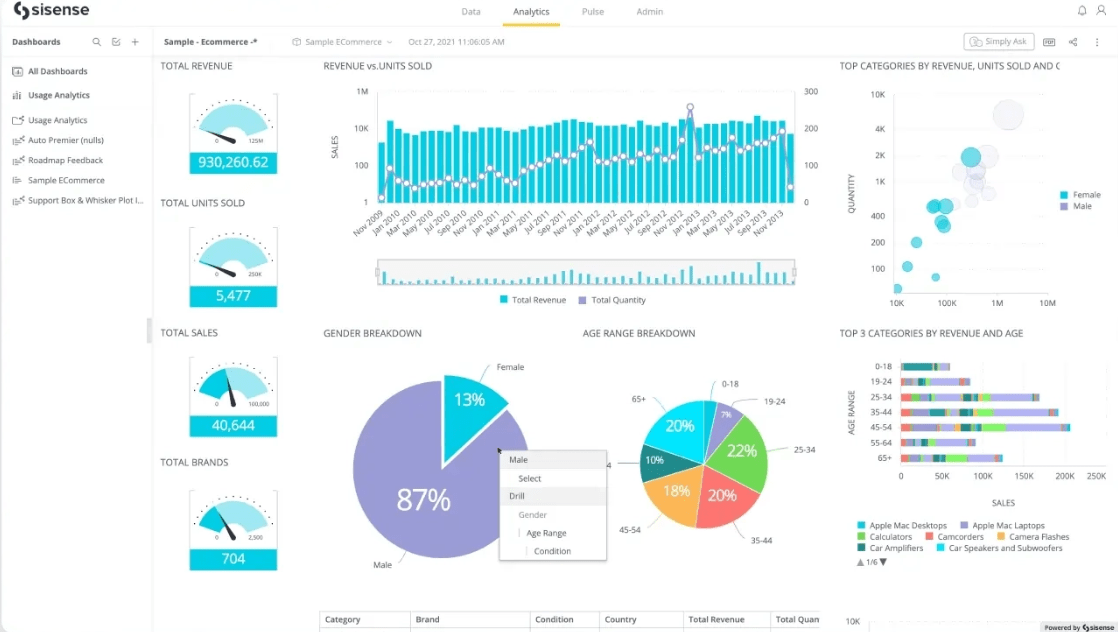
Sisense is a data analytics tool designed for developers to build data into products using APIs and SDKs. Built-in artificial intelligence and machine learning tools drill down into the metrics to offer data-driven insights. Use custom dashboards and visualizations to share action items and key takeaways based on the hard numbers.

Sisense best features

  • Visualize data with interactive charts that are linked to KPIs and other important metrics for users and clients
  • AI-generated insights highlight trends, identify problem areas, and emphasize key successes
  • Alerts and predictions keep you ahead of potential issues and ready for innovation
  • Data connectors let you control what types of data sources are used to put together reporting

Sisense limitations 

  • Some users experienced bugs using widgets and connectors
  • There are several plans to choose from, but pricing can be limiting for small teams

Sisense pricing

  • Contact for customized solutions

Sisense ratings and reviews

  • G2: 4.3/5 (800+ reviews)
  • Capterra: 4.5/5 (300+ reviews)
Summarize this article with AI ClickUp Brain not only saves you precious time by instantly summarizing articles, it also leverages AI to connect your tasks, docs, people, and more, streamlining your workflow like never before.
ClickUp Brain
Avatar of person using AI Summarize this article for me please

Other Business Tools

While these tools offer business intelligence support, software like ClickUp offers more comprehensive features to make collaboration simpler, streamline workflows, and offer greater control over managing projects.

ClickUp

Updating and adjusting time ranges on a chart using ClickUp Dashboards
Automatically update and adjust time ranges on incoming requests or tickets with Rolling Time Period in ClickUp Dashboards

ClickUp is a visual project management tool that lets you control how you share data insights and build workflows based on action items. Use ClickUp Dashboards to build charts and reports that reflect your company’s data. With these visuals, you can track real-time progress on goals, manage resources, and analyze tables for data-driven decision-making. 👨🏽‍💻

Then, take things a step further with ClickUp Views that let you go beyond data analytics. Instantly automate tasks based on data insights, and build intuitive workflows. 

Use the List view to get a breakdown of tasks and who’s working on what. Hop into Board view for a Kanban visualization of tasks, or switch to Calendar view to see a timeline of data-based work.

Connect all of your favorite tools in one place with ClickUp Integrations. Sync your favorite data analytics tools to make better business decisions, and link communication apps to keep the team updated on changes.

ClickUp best features

  • A user-friendly interface makes it easy to harness the power of organization
  • Real-time collaboration lets you work with the team instantly when you have new data insights or want to go over charts and reports
  • More than 1,000 templates, including decision-making templates, save time and effort when it comes to sharing data
  • Integrations let you connect the tools you use every day for a seamless work environment
  • ClickUp AI offers suggestions and ideas when it comes to implementing data into workflows

ClickUp limitations 

  • The sheer number of features means it takes a little time to fully leverage the tool
  • ClickUp AI is only available with paid plans

ClickUp pricing

  • Free Forever
  • Unlimited: $7/month per user
  • Business: $12/month per user
  • Enterprise: Contact for pricing
  • ClickUp AI is available on all paid plans for $5 per Workspace member per month

ClickUp ratings and reviews

  • G2: 4.7/5 (9,000+ reviews)
  • Capterra: 4.6/5 (3,800+ reviews)
Summarize this article with AI ClickUp Brain not only saves you precious time by instantly summarizing articles, it also leverages AI to connect your tasks, docs, people, and more, streamlining your workflow like never before.
ClickUp Brain
Avatar of person using AI Summarize this article for me please

Build Data-Driven Decisions and Workflows With ClickUp

With these business intelligence tools, it’s easier than ever to make data-driven decisions and generate valuable insights to move your business forward. But most are limited to insights, you’ll need another tool to actually schedule tasks and build workflows to get things done.

That’s where project management tools like ClickUp help. Sign up for ClickUp today to take your data insights and turn them into actionable tasks for each member of your team. Built-in dashboards and visual tools make it easy to dive deeper into analytics and create a game plan for scaling your business. 🙌

Questions? Comments? Visit our Help Center for support.

Sign up for FREE and start using ClickUp in seconds!
Please enter valid email address