

As a manager, it’s your job to not only keep your team on task but also to brag about your team’s accomplishments. Regardless of your manager or team lead, you need a solid reporting tool that shows—in black and white numbers—how effective your team really is.
But you’re busy, and we’re willing to bet you don’t have hours of free time to create reports with interactive dashboards from multiple data sources. Don’t reinvent the wheel: just use these 11 self-service reporting tools and software to do the hard work for you.
In this guide, we’ll give you a simple checklist of what to look for in a reporting tool, plus our top 11 favorite reporting tools of 2024.
11 Best Reporting Tools & Software in 2024
What Should You Look For in Reporting Tools?
Finding the right reporting tool is no picnic. With hundreds of business intelligence software options out there, you need to find reporting tools that blend project management with interactive reports and simple data visualizations for your projects—and that’s no easy task.
Be on the lookout for these key features:
- Data visualization software: Excel sheets of raw data are boring. Go with business reporting software that offers data visualization for your most important KPIs. Bonus points if it generates gorgeous graphs and interactive dashboards
- Analytics tools: The right report templates will pull real-time data so you have the most up-to-date information. This makes it easier to do forecasting and make data-driven business decisions—even if you have multiple data sources
- Collaboration: You should be able to share your report with multiple stakeholders in just a few clicks. It also needs to be so intuitive and user-friendly that anyone can understand the report
- Versatility: Don’t pigeonhole yourself. Go for reporting software that helps you with everything from financial reporting to SEO marketing reports and even project management software
11 Best Reporting Tools
1. ClickUp
Best for Agile Project Management Reporting
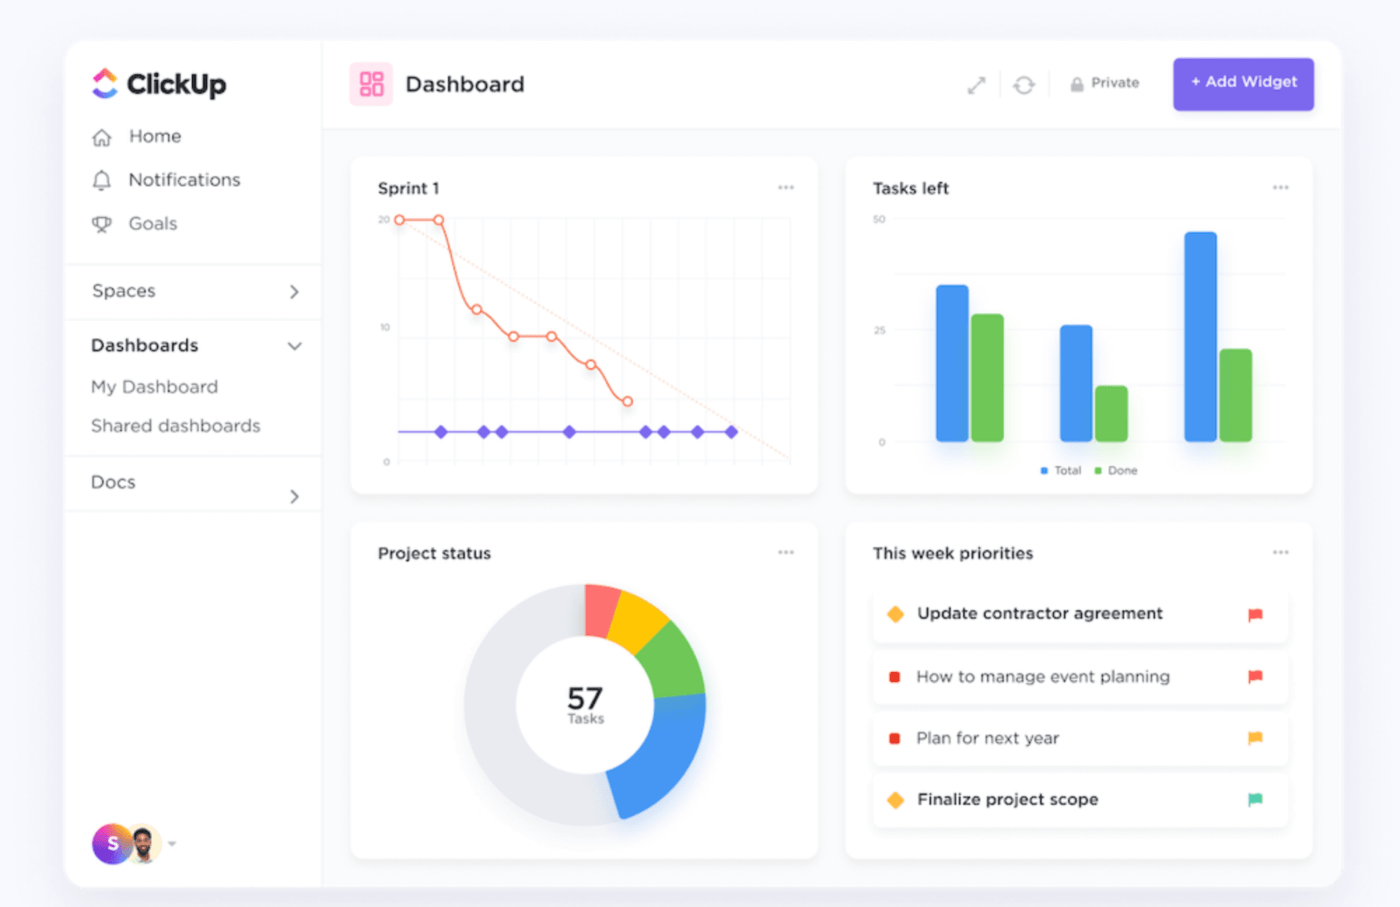
Not to humble-brag, but ClickUp offers the most robust reporting tools for managers and their teams. Our reporting software allows managers to build all-in-one ClickUp Dashboards as their mission control center.
It’s as easy as adding widgets, dropping in your data, and customizing visuals. You can see all work at a high level to manage people, tasks, time, documents, embeds, and sprints in one place.
ClickUp is the perfect reporting tool for business management. Set your quarterly goals and track every employee’s time in a single Dashboard. Resource management helps you visualize how well you’re leveraging your team, and workload analysis shows you how productive your team is by tracking task completion.
The end goal? Identifying what you’re doing well and removing bottlenecks in your processes. By visualizing every step of your workflow, you’ll run tighter teams and produce better work.
ClickUp best reporting features
- Workload & Box view: Rethink resource management with ClickUp’s unique Team View. Check your team’s workload to see who’s at risk of burnout and who’s free to take on more tasks
- Milestones: Convert tasks into Milestones to visualize how far you’ve come in a sleek Gantt-style chart
- Integrations: Need to pull reports from other platforms? ClickUp easily integrates with solutions like Tableau
- ClickUp Goals: Set goals in ClickUp and create timelines, targets, and progress tracking for every goal so you never lose sight of the finish line
- Pulse: Need a quick overview of who’s online and what they’re doing? Pulse reports show who’s online per hour and which tasks they’re working on
ClickUp limitations
- ClickUp requires an upfront learning curve for new users
- Some features are only accessible to paid subscribers
ClickUp pricing
- Free Forever
- Unlimited: $7/month per user
- Business: $12/month per user
- Enterprise: Contact for pricing
ClickUp ratings and reviews
- G2: 4.7/5 (2,000+ reviews)
- Capterra: 4.7/5 (2,000+ reviews)
2. MeisterTask
Best for Task Management Reporting
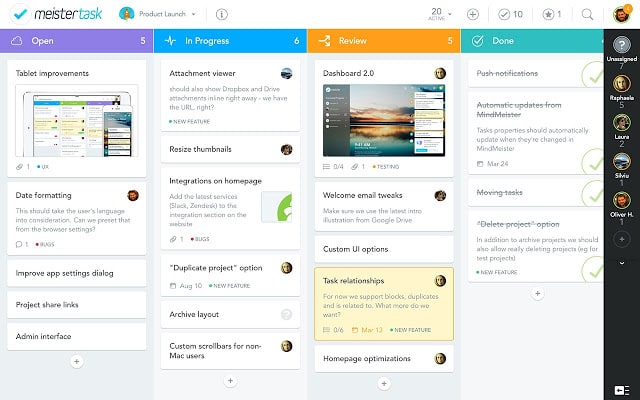
MeisterTask is primarily a task management and collaboration platform, but it pulls robust reports to help managers lead better teams. MeisterTask automatically collects data on all projects and team members. Just visit the Reports tab in your dashboard to see:
- Open tasks
- Recently created tasks
- Completed tasks
You can also set up custom reports to pull data on teams, individual contributors, or task completion by timeframe (e.g., Q4). MeisterTask generates colorful bar graphs at the top of every report, but you can drill down into individual data points on the bottom half of the report—although this is a lot of information to sift through manually.
MeisterTask best reporting features
- Quick customized reports with ready-made filters
- You can save custom reports to reuse in the future
- Reports export to Excel (XLS) or CSV files for external sharing
MeisterTask limitations
- The reporting tool features show an overwhelming amount of data, so it’s hard to quickly draw conclusions to stakeholders
- The custom filters are helpful but they don’t offer a lot of customization for enterprise reporting tools
MeisterTask pricing
- Basic: Free
- Pro: $11.99/month per user
- Business: $23.99/month per user
- Enterprise: Contact for pricing
MeisterTask ratings and reviews
- G2: 4.6/5 (150+ reviews)
- Capterra: 4.7/5 (1,000+ reviews)
3. Datapine
Best for Business Intelligence Reporting
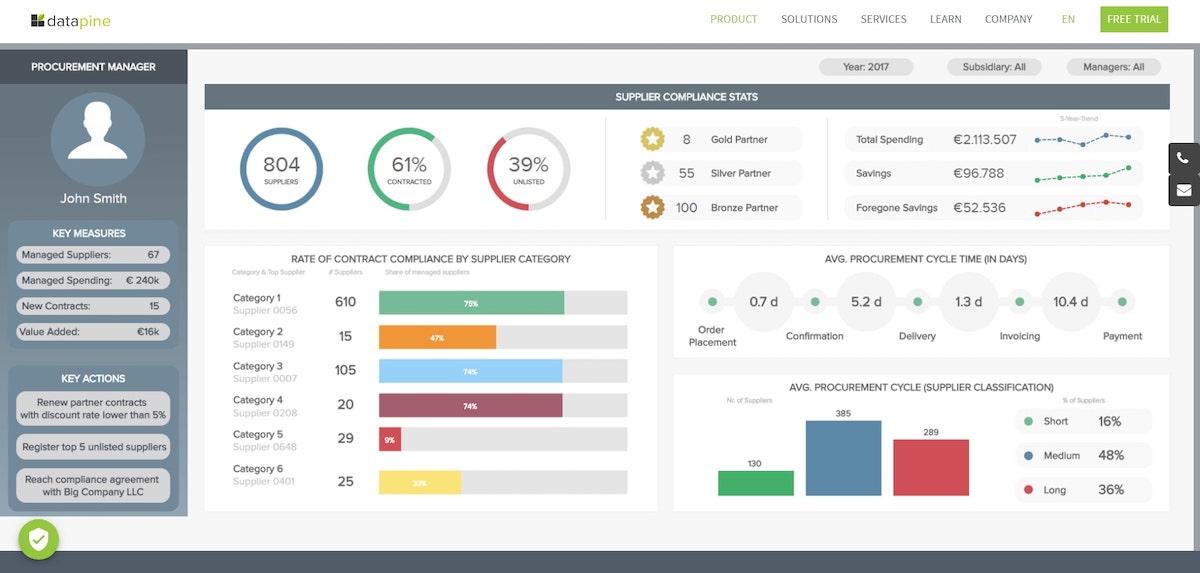
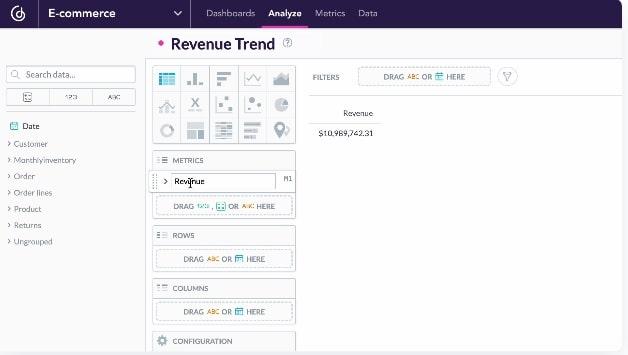
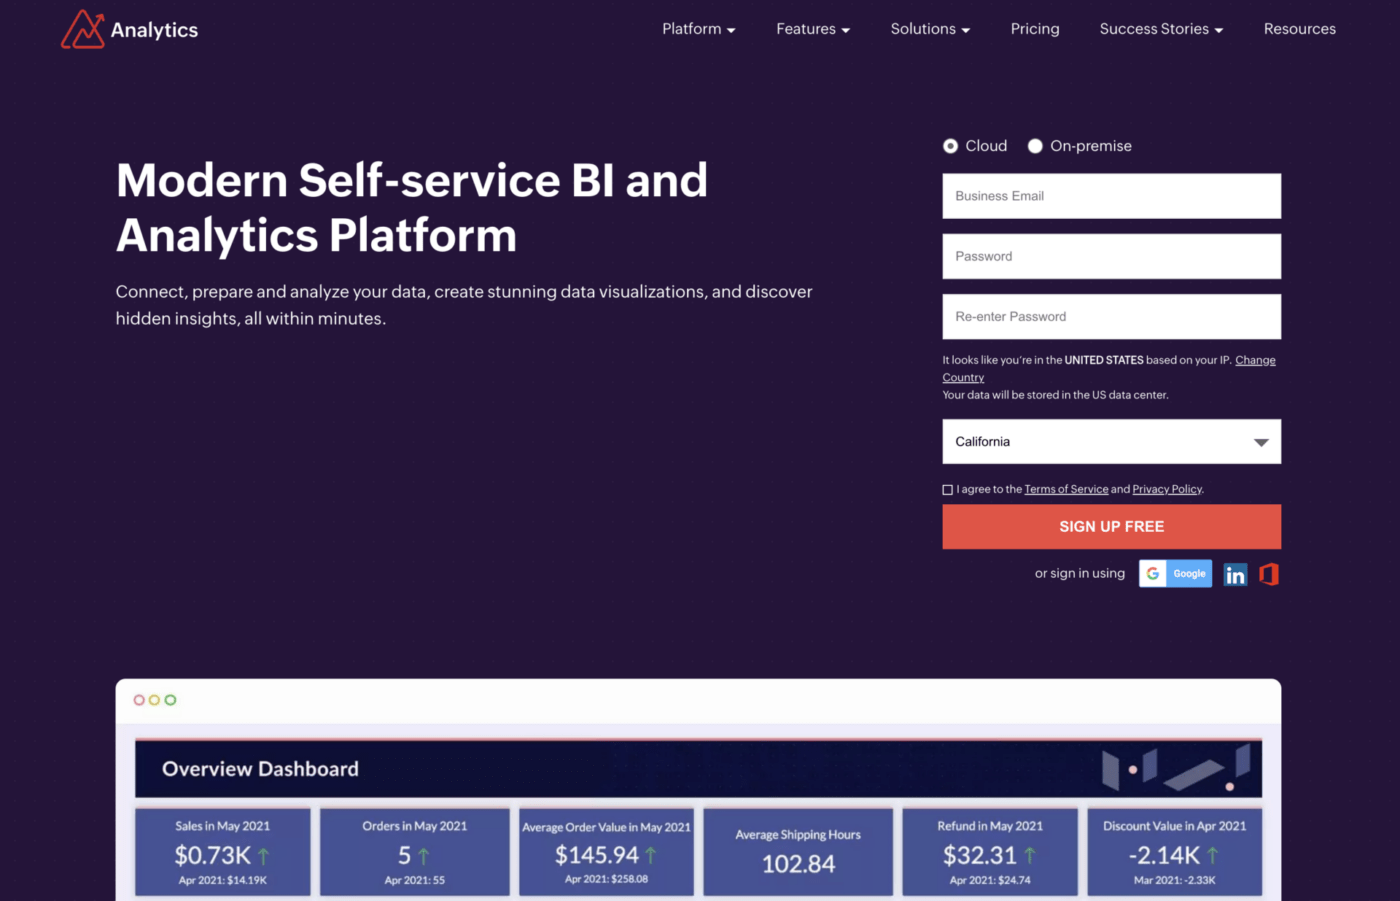
Datapine is based out of Germany, but its robust business intelligence (BI) software is available to anybody. Unlike MeisterTask, Datapine doesn’t track tasks for you. Instead, its reporting tools aggregates marketing data from your databases, files, social media, CRM/ERP, and helpdesk for robust BI reporting.
However, this marketing analytics tool specializes in data visualization, so if you want to really dig into your data, this is a strong option. If you need to keep a close eye on your team’s performance, Datapine’s data notifications proactively flag issues for you.
Datapine best reporting features
- 80 professional data reporting templates to choose from
- Embedded analytics
- Mobile-friendly
- Corporate performance management options
Datapine limitations
- Datapine bills itself as beginner-friendly, but its advanced reporting tools are still overwhelming
- It’s more expensive than other reporting tool options
- Some users report long cancellation periods
Datapine pricing
- Basic: $249/month per user
- Professional: $449/month for two users
- Premium: $799/month for three users
- Branding & Embedded: $1,099/month for three users
Datapine ratings and reviews
- G2: 4.6/5 (20+ reviews)
- Capterra: 4.9 (20+ reviews)
4. Whatagraph
Best for Visual Marketing Analytics Reporting
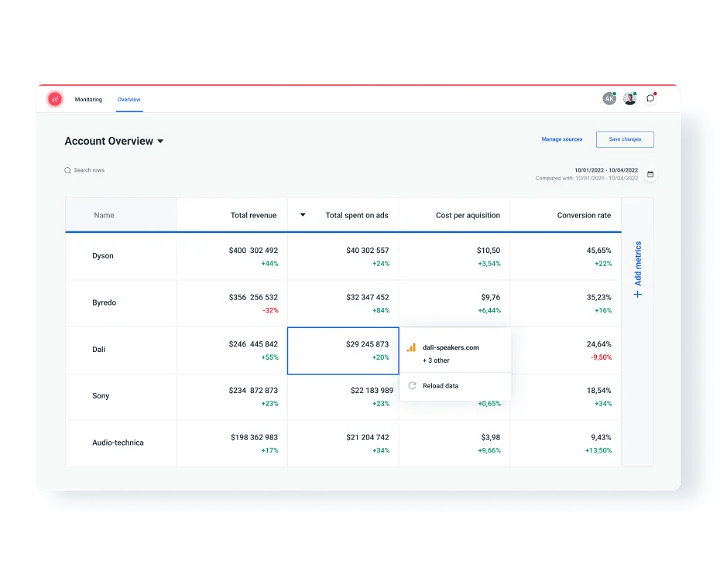
Marketers live and breathe data, and that’s why digital marketing managers flock to Whatagraph. This marketing reporting tool includes data visualization and custom branding. If you have an employee on a performance improvement plan, this reporting tool also includes employee performance tracking.
Whatagraph integrates with multiple marketing platforms like Google Ads, Twitter, Mailchimp, Shopify, Google My Business, and even Snapchat. If you need a connector that it doesn’t have, Whatagraph helps you connect to any data source.
Whatagraph best reporting features
- Marketing-specific report templates
- Custom branding makes it a great choice for marketing or advertising agencies
- Readymade API integrations speed up the normally tedious reporting process for business users
Whatagraph limitations
- Some users say there are inconsistent data connections with the reporting software
- Customer support isn’t always responsive
Whatagraph pricing
- Professional: $223/month, billed annually for 5 users
- Premium: $335/month, billed annually for 10 users
- Custom pricing: For unlimited users
Whatagraph ratings and reviews
- G2: 4.5/5 (230+ reviews)
- Capterra: 4.4/5 (80+ reviews)
5. Tableau
Best for Large Scale Data Visualization
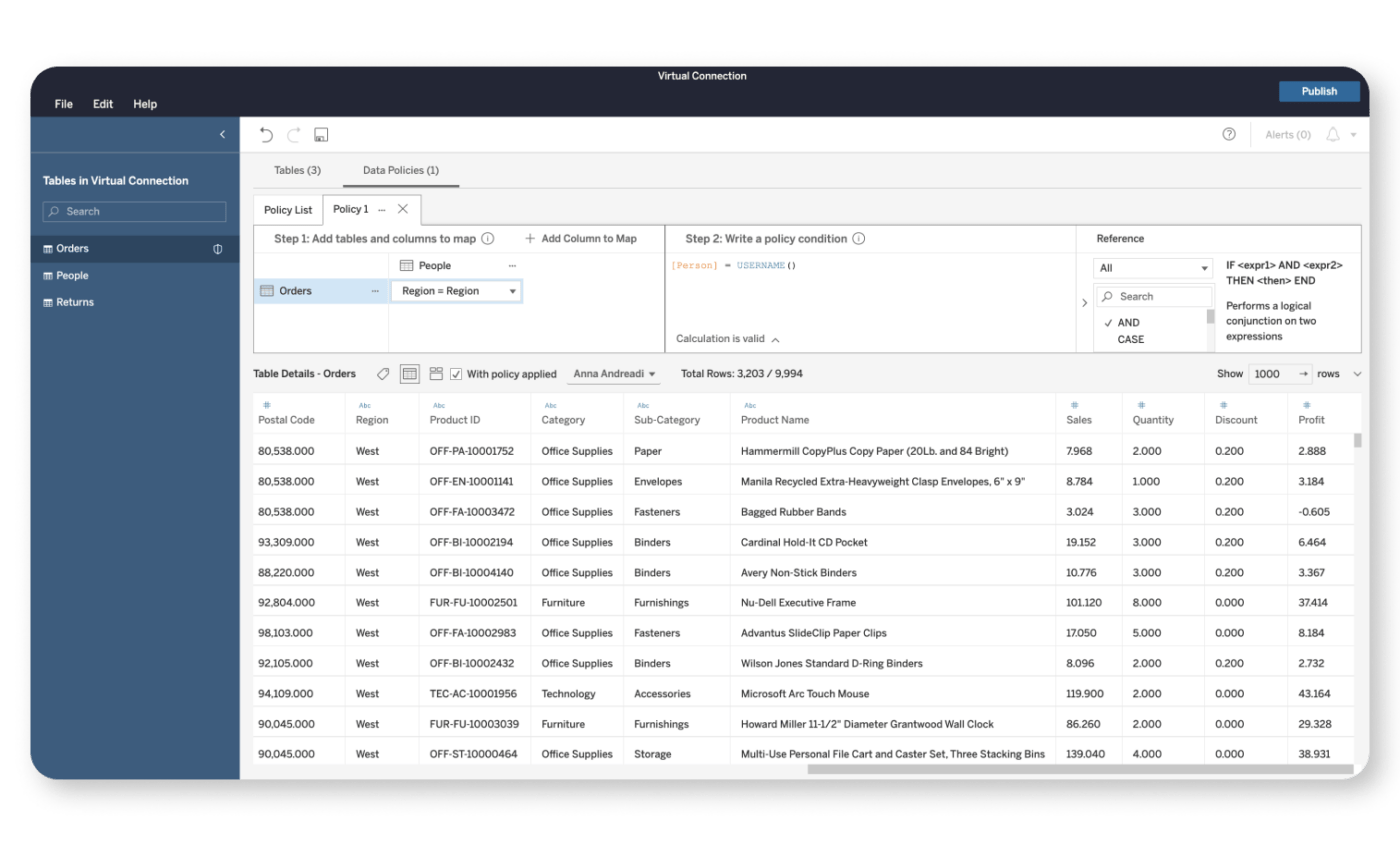
Tableau is a visual analytics reporting solution from Salesforce. If you already use Salesforce for customer relationship management (CRM), Tableau will automatically pull data from Salesforce to streamline your analytics even more and enable better CRM reporting.
Tableau’s reporting software includes integrations with Google Sheets, Excel, Salesforce (naturally), and Google to bring your data into one place. This reporting tool is better for business intelligence that analyzes an enterprise as a whole instead of drilling down on each team member’s tasks or performance.
But we do like their new feature, Tableau GPT. It uses generative AI to quickly analyze multiple data sources, spot patterns, and suggest next steps.
Tableau best reporting features
- Predictive AI feature speeds up analysis
- Integrates with data sources from most major databases and analytics platforms
- Tableau has the firepower to handle complex data visualizations
Tableau limitations
- There are so many bells and whistles on its interactive dashboards that it’s unwieldy for beginners
- You may need more workarounds if you don’t use Salesforce
- Tableau’s complexity makes custom formatting difficult for its reporting software
Tableau pricing
- Tableau Viewer: $15/month per user, billed annually
- Tableau Explorer: $42/month per user, billed annually
- Tableau Creator: $70/month per user, billed annually
Tableau ratings and reviews
- G2: 4.3/5 (1,600+ reviews)
- Capterra: 4.5/5 (2,000+ reviews)
6. ProWorkflow
Best for Workflow and Time Tracking Reporting
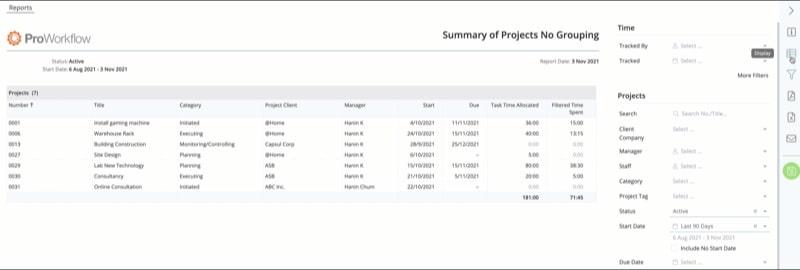
ProWorkflow specializes in remote collaboration, which makes it popular with managers at remote and hybrid businesses. Use this reporting tool to view all projects, tasks, time logs, contacts, workflows, and resources in one place. It even has features for invoicing, messaging, file sharing, and timelines, so it’s a solid option if you need an all-in-one workflow management tool.
If you’re a Microsoft organization, ProWorkflow integrates with Microsoft Teams and Outlook—it just doesn’t have as many integrations as other reporting tools so you might need to re-enter some data.
ProWorkflow best reporting features
- At $20 for unlimited users, ProWorkflow is very affordable compared to other data reporting tools in this list
- ProWorkflow includes a variety of features beyond reports, so it’s helpful for managers who need a lot of tools in one dashboard
- Great at handling and sorting business data
ProWorkflow limitations
- Since it isn’t a pure reporting tool, ProWorkflow lacks the power of other reporting software
- Contractors don’t have as much access to ProWorkflow’s tools, which can skew your business data
- Customization is hard to set up—especially from multiple data sources
ProWorkflow pricing
- Professional: $20/month per user, no user limit
- Advanced: $30/month per user, for a minimum of 5 users
ProWorkflow ratings and reviews
- G2: 4.1/5 (35+ reviews)
- Capterra: 4.5/5 (240+ reviews)
7. Thoughtspot
Best for Search-Driven Analytics
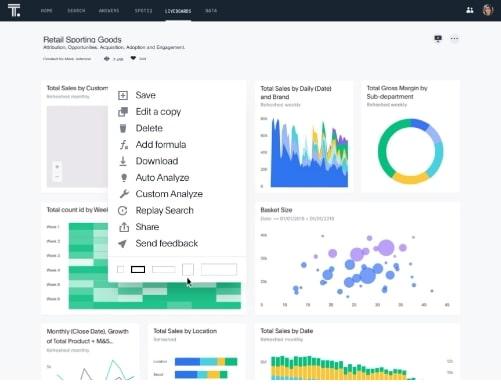
Thoughtspot bills itself as a powerful reporting platform powered by AI. Use this platform to search for answers about your business, visualize your data, and monitor performance.
Thoughtspot isn’t for beginners, so you’ll need serious data chops to use this platform. If you’re a data pro, use this platform to connect cloud data sets, model data, and set up AI data automation.
Thoughtspot best reporting features
- Thoughtspot AI can detect anomalies and alert you to issues ASAP
- Liveboards offer interactive reports for quick insights
- Its mobile app allows you to check data analytics anytime, anywhere
Thoughtspot limitations
- With so many complex features it’s best suited for data professionals only
- Lacks flexibility and customization for visuals
Thoughtspot pricing
- Team: $95/month for 5 users
- Pro: $2,500/month for unlimited users, billed annually
- Enterprise: Contact for pricing
Thoughtspot ratings and reviews
- G2: 4.4/5 (240+ reviews)
- Capterra: 4/5 (2 reviews)
8. Looker Studio
Best for Custom Data Modeling
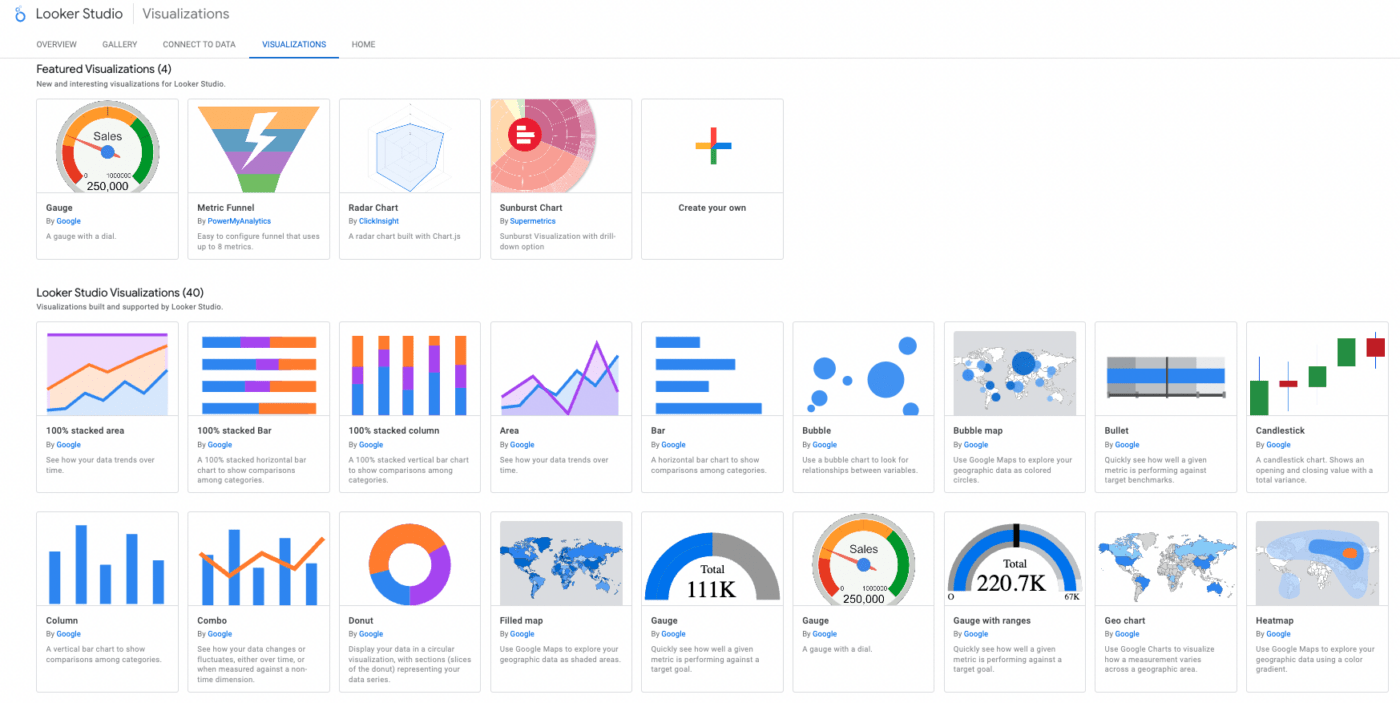
Google organizations, rejoice: Looker Studio is reporting software made by Google, for Google businesses. Looker Studio creates real-time data models, which means you can monitor your data across multiple areas of the business in a single interactive dashboard. This business intelligence software also offers proactive alerts to speed up decision-making.
Although Looker Studio is a Google product (like Google Analytics), it’s definitely not for beginners. You’ll need to know SQL and programming basics to make heads or tails of this platform.
Looker Studio best reporting features
- Looker Studio integrates with Google data, so it’s perfect if your business works in the Google Cloud
- Looker Studio comes with pre-built data templates
- This reporting tool integrates with Looker Actions to automate workflows
Looker Studio limitations
- Looker Studio is complex, so it’s best for programmers or data scientists
- Third-party data integrations are a bit bumpy
- Some business users report lags and performance issues
- Customization is lacking
Looker Studio pricing
- Custom pricing: Contact for a quote
Looker Studio ratings and reviews
- G2: 4.4/5 (370+ reviews)
- Capterra: 4.6/5 (190+ reviews)
9. GoodData
Best for Enterprise Level Reporting
GoodData is a cloud-based BI and analytics platform that developers use to add data dashboards to applications. But managers also turn to GoodData to create seriously customizable, real-time dashboards.
You’ll need a solid data team to create the reporting tool, but once it’s up and running, you’ll have a 100% customized reporting dashboard tailored to your team’s exact needs. The good news is that GoodData has a low-code/no-code setup, so you can set up data visualizations with a simple drag-and-drop interface.
GoodData best reporting features
- GoodData simplifies embedded analytics
- You can completely customize reports
- White label software available
GoodData limitations
- Expensive reporting tool
- Some users say that it’s too complex
- Lacks training and resources
GoodData pricing
- Professional: $1,000/month for unlimited users
- Enterprise: Contact for pricing
GoodData ratings and reviews
- G2: 4.1/5 (350+ reviews)
- Capterra: 4.4/5 (20 reviews)
10. Datadog
Best for IT and DevOps Reporting

Datadog is an all-in-one data management platform and reporting tool that handles everything from DevOps to security analytics to IoT monitoring. Its functionality is definitely more advanced, but that can be an upside if you manage an enterprise team or an IT department.
In terms of its reporting features, Datadog offers real-time business intelligence to every user in your organization. You can track literally everything: button clicks, actions in third-party systems, and even inventory changes.
Datadog best reporting features
- You can blend IT and business performance data into one dashboard
- Create custom alerts, as well as playbooks for each alert
- Refine your metrics with behavioral analytics
Datadog limitations
- Datadog lacks helpful project documentation and training
- The platform lacks an intuitive user interface
Datadog pricing
- Free
- Pro: $15/month per user
- Enterprise: $23/month per user
Datadog ratings and reviews
- G2: 4.3/5 (400+ reviews)
- Capterra: 4.6/5 (215+ reviews)
11. Zoho Analytics
Best for Integrated Business Data Reporting
Zoho Analytics is a self-service business intelligence and analytics platform that allows users to analyze their business data and create insightful reports and dashboards. It can process a large amount of data and create impactful visualizations to simplify data interpretation.
Zoho Analytics best reporting features
- Easy drag-and-drop interface to create reports and dashboards with ease
- AI-powered assistant Zia which can answer your questions in the form of reports.
- Ability to blend data from different sources to create cross-functional reports
- Enhanced collaboration features to share and collaborate on reports and dashboards
- Robust security measures including role-based access controls
Zoho Analytics limitations
- Some users report a steep learning curve for beginners
- Limited options for customization in the free version
Zoho Analytics pricing
Zoho Analytics has four pricing plans. Paid plans start at $24/month.
Zoho Analytics user ratings
- G2: 4.2/5 (100+ reviews)
- Capterra: 4.3/5 (200+ reviews)
Get the Strongest Reporting Software for Your Growing Business
Whether you want a plug-and-play reporting tool or you want to completely customize reports, our top 11 picks for reporting software will take your team to the next level.
The problem is, most of these tools aren’t cheap, and they’re complex to use. In our humble opinion, ClickUp is the most robust option for the money. Save time, reduce hassle, and do better business with ClickUp’s built-in reporting tools and templates.
Not sure if ClickUp is for you? Give us a test drive. Sign up for ClickUp to start building your first report—for free!


Everything you need to stay organized and get work done.

Recent Articles
9 Best Goal Tracking Apps in 2026(Tested for Personal and Team Goals) 
9 Best Goal Tracking Apps in 2026(Tested for Personal and Team Goals)
The 12 Best Client Collaboration Software Tools in 2026
The 12 Best Client Collaboration Software Tools in 2026
Best Due Date Tracking Software in 2026: 9 Tools Ranked
Best Due Date Tracking Software in 2026: 9 Tools Ranked
