

A Gantt chart gives a visual representation of a single project’s tasks and resources scheduled over time. Suitable for any team or industry, Gantt charts are a valuable tool for project managers to keep teams and stakeholders informed of progress at every phase.
We’ll cover not one but two ways to build a Gantt chart in Microsoft Word with easy-to-follow tutorials! ⚙️
How to Make a Gantt Chart in Word
If you’d like to create a simple Gantt chart table in Microsoft Word, jump to the Version 2 tutorial.
Note: In this tutorial, we use Microsoft Word for Mac Version 16.54. The steps and features may look different if you’re on another platform or version such as Google Docs or Google Sheets.
👉 Version 1: Creating a Gantt chart with a Excel table
1️⃣ Add the project schedule data into Microsoft Excel
- First, open a new Word document
- Select Blank Document > Create
- Under the Layout tab, select Orientation > Landscape

Created in Microsoft Word
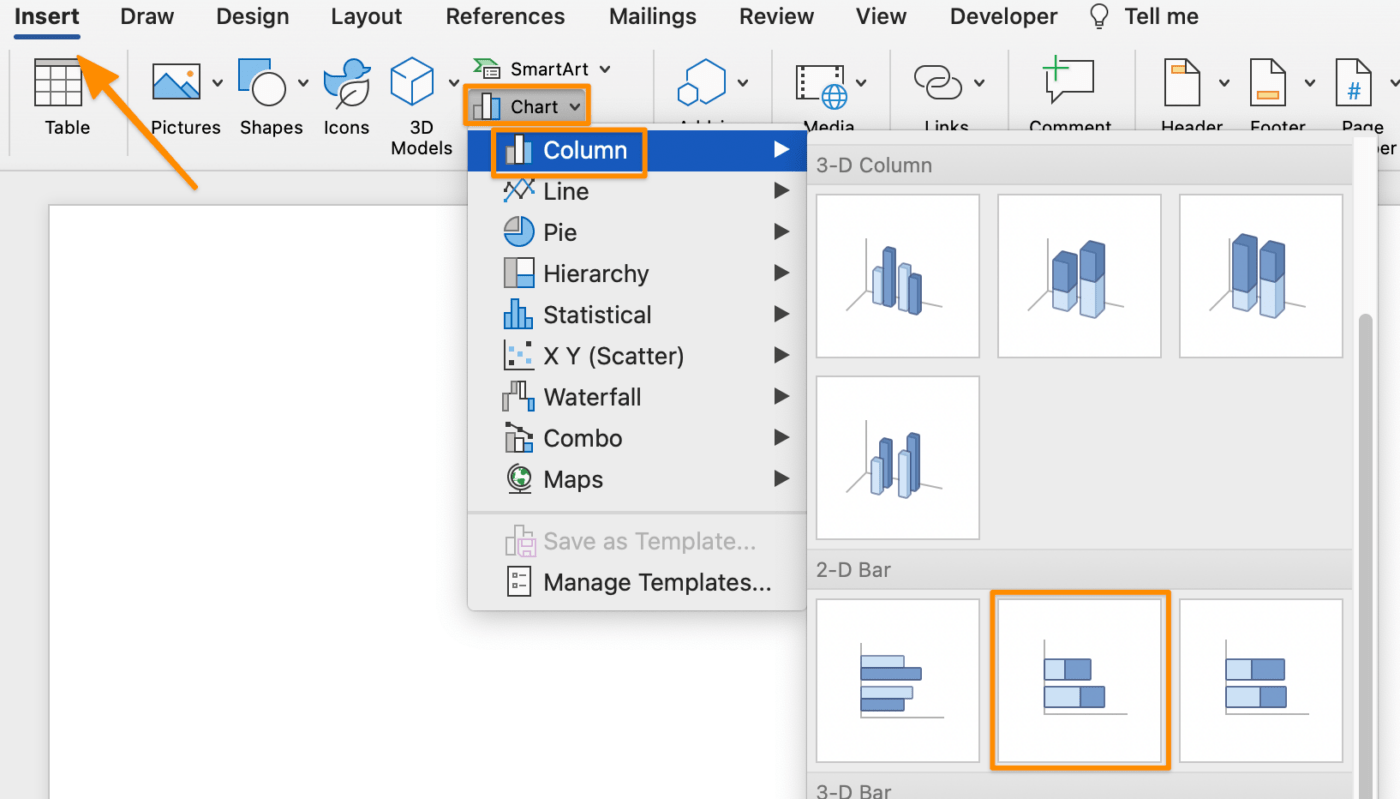
4. Go to the Insert tab > Chart > Column > Stacked Bar graph, and under 2-D Bar, click the middle chart
Note: An Excel window will open automatically
Created in Microsoft Word
5. In the Excel application, rename the first row of columns B, C, and D to Start Date, End Date, and Duration respectively

Created in Microsoft Excel
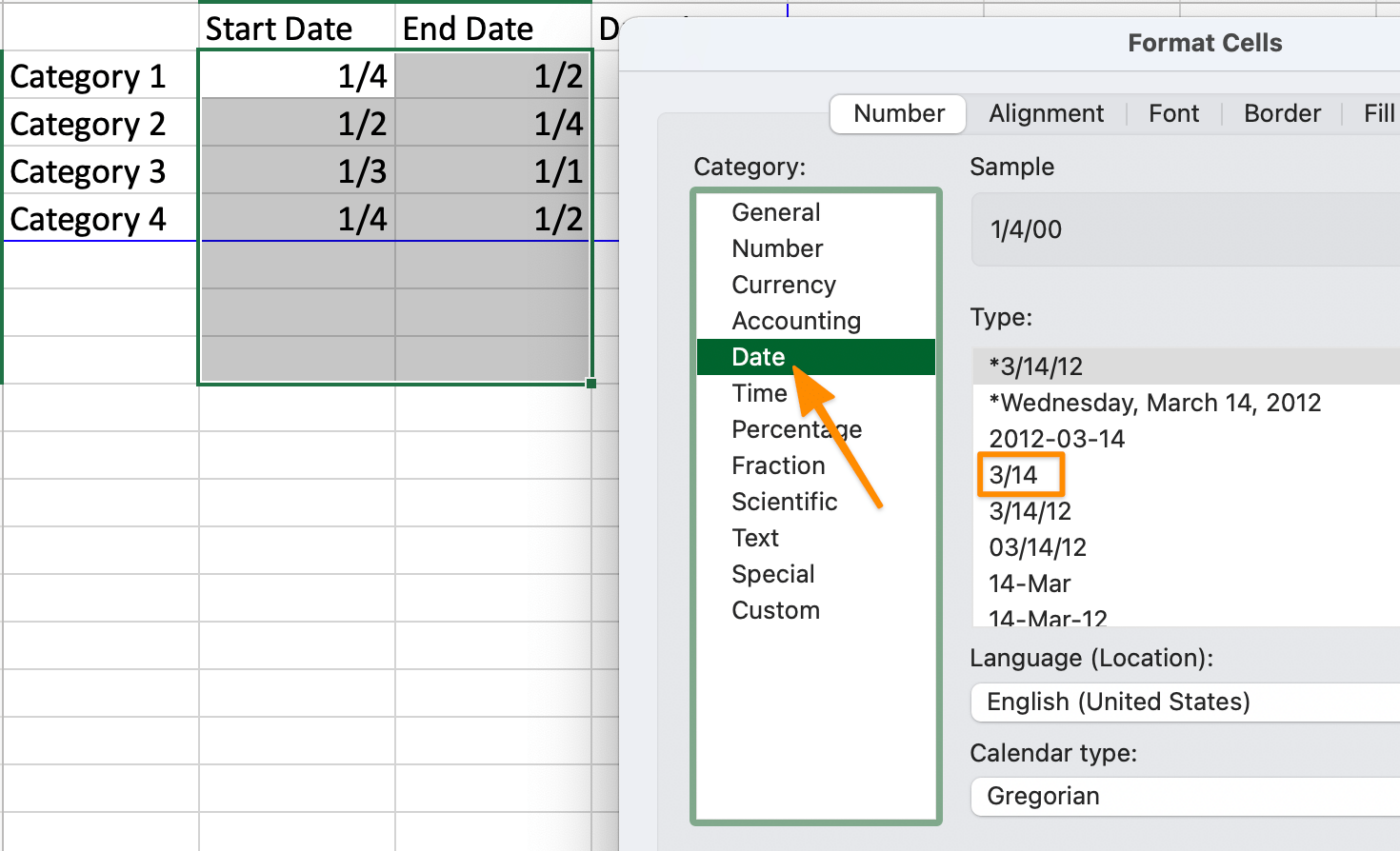
6. Highlight the cells B and C and right-click. Scroll down to Format Cells and choose your desired date format
Note: The number of cells highlighted depends on the number of tasks you’re adding to the Gantt chart
Created in Microsoft Excel
7. Starting with the first task, edit the placeholder data by adding your project information:
- Column A: task name
- Column B: start date
- Column C: end date

Created in Microsoft Excel
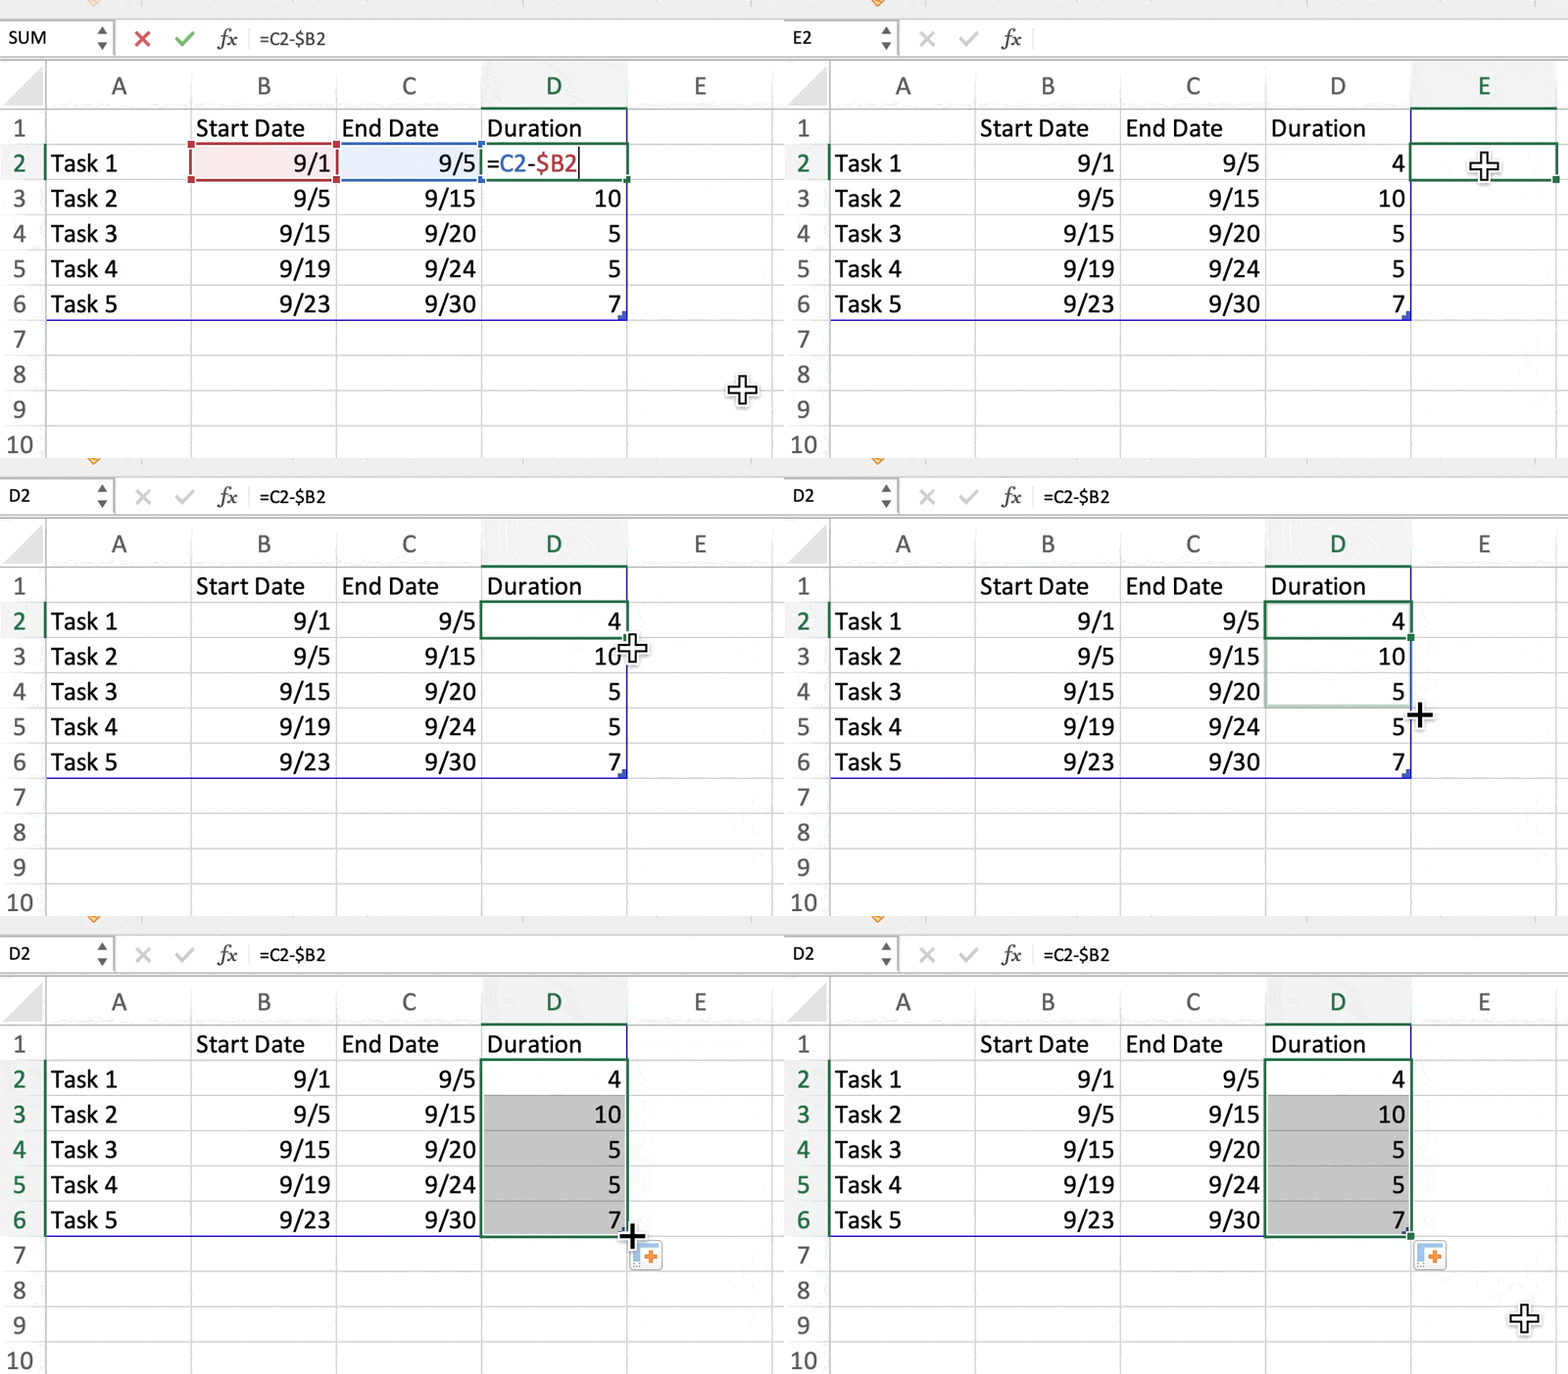
8. Select cell D2 and type =C2-$B2 in the formula bar

Created in Microsoft Excel
9. Select cell D2 again and click to drag the square at the bottom right corner until the last task in the column
Created in Microsoft Excel
2️⃣ Edit the Gantt chart in Word
- Return to the Word application
- Right-click End Date in the Chart legend > Delete Series

Created in Microsoft Word
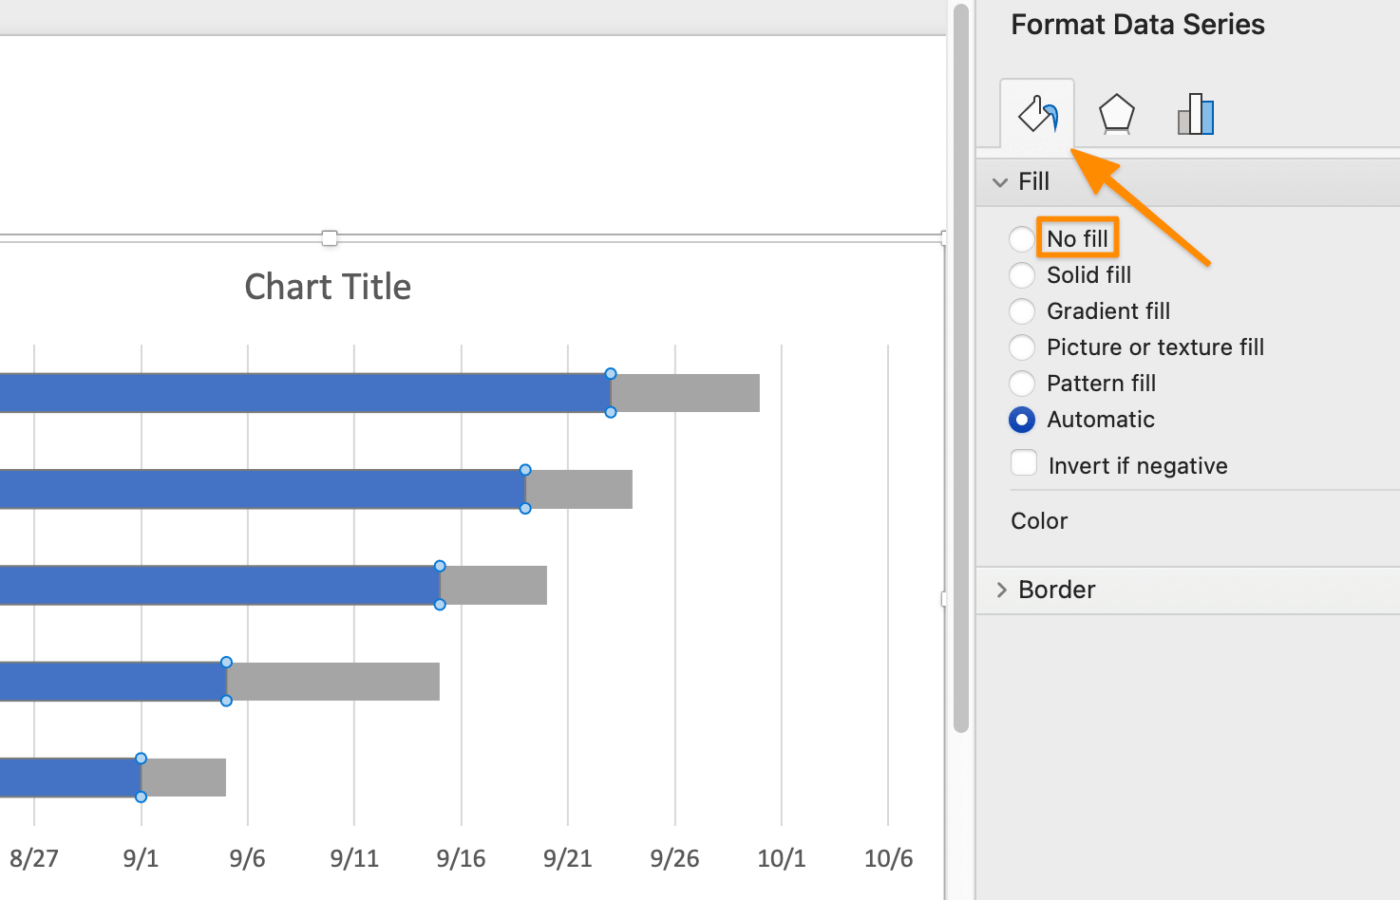
3. Click a blue bar to select them all > Fill > No Fill
Created in Microsoft Word
3️⃣ Customize the Gantt chart in Microsoft Word
Optional: Add a color scheme to the chart by selecting the table, and under the Format tab > choose your desired table color

Created in Microsoft Word
Optional: Add a color scheme to the task bars by selecting a task bar > Format tab > choose your desired table color

Created in Microsoft Word
4️⃣ Save as Gantt chart template
- Go to File > Save as Template… and a dialog box will appear
- Enter your calendar template name under Save As
- Add relevant tags under Tags (for Mac users)
- Choose where you want to save your calendar template
- Check the File Format is set to Microsoft Word template (.dotx)

Created in Microsoft Word
👉 Version 2: Creating a Gantt chart with a Word table
1️⃣ Insert the table and add the project schedule data
- Launch Microsoft Word
- Select Blank Document > Create
- Under the Layout tab, select Orientation > Landscape
- Add your Gantt chart title
- Place the cursor at the desired location to insert the table
- On the Insert tab, select Table > hover over a 2×8 table, and click to populate

Created in Microsoft Word
7. Click and drag the centerline towards the left with enough space for the task names

Created in Microsoft Word
8. Highlight all right columns and under the Layout tab, click Split Cells. Then, type 8 in the Number of columns box, and click OK

Created in Microsoft Word
9. In the table, type Week 1 through Week 8 in the first row and add all task names in the first column

Created in Microsoft Word
10. Highlight all rows except the first row, and under the Layout tab, click the up arrow under Height control to adjust the row height

Created in Microsoft Word
11. Highlight all rows except the first row again, and under the Layout tab, select the Center icon to center align text

Created in Microsoft Word
2️⃣ Add a color scheme to the task bars
1. Highlight the cells and go to Table Design tab > Shading > choose your desired color(s)

Created in Microsoft Word
Optional: Highlight the task bars in a single row, then go to the Layout tab > Merge Cells

Created in Microsoft Word
3️⃣ Customize the table border thickness
- Click the square icon at the top left of the chart to select everything in the table
- Go to the Table Design tab > under 1/2 pt > click 3pt
- Click Borders > Outside Border
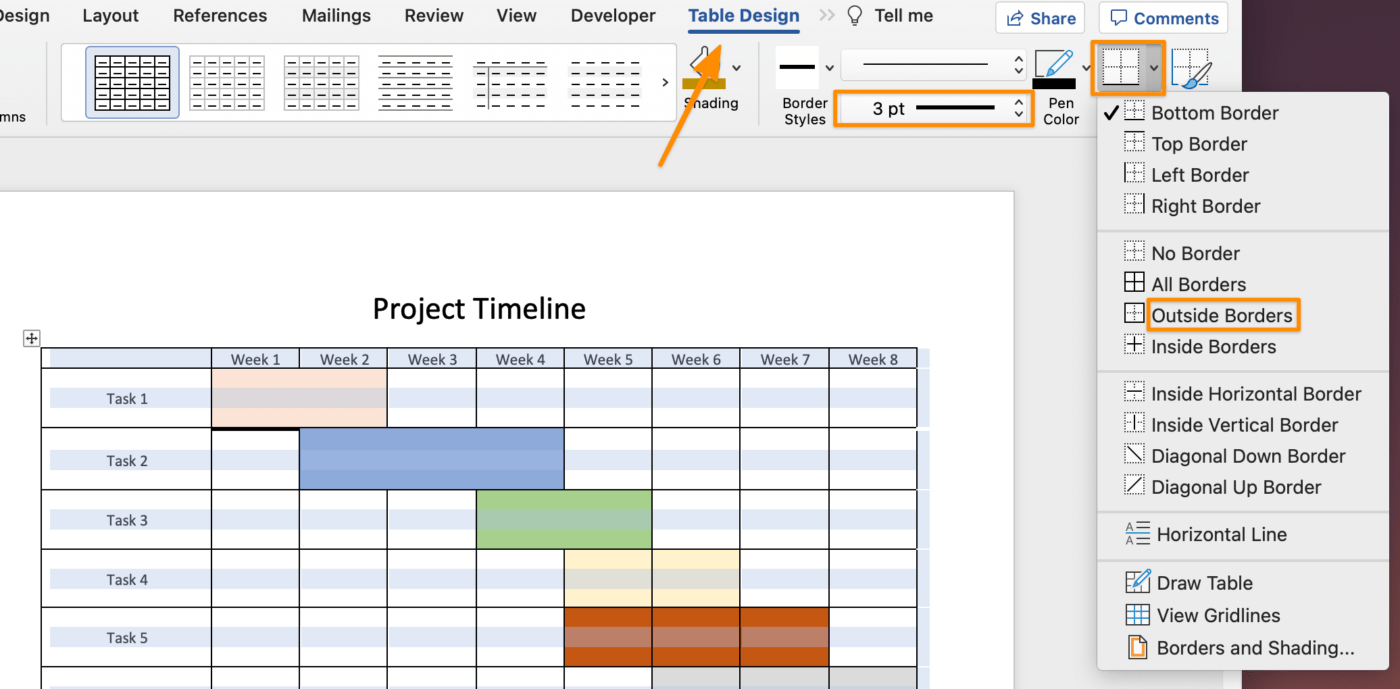
Created in Microsoft Word
4️⃣ Save as Gantt chart template
- Go to File > Save as Template… and a dialog box will appear
- Enter your calendar template name under Save As
- Add relevant tags under Tags (for Mac users)
- Choose where you want to save your Microsoft Word calendar template
- Check the File Format is set to Microsoft Word template (.dotx)

Created in Microsoft Word
✨ Bonus tutorials:
- Create a form in Microsoft Word
- Create a mind map in Microsoft Word
- How to make a flowchart in Microsoft Word
- How to make a Gantt chart in PowerPoint
Create Professional Gantt Charts in ClickUp
While it’s handy to know how to create Gantt charts in a popular tool like Microsoft Word or any project management software, that was a ton of work for a chart that will be unusable the next day… maybe in the next hour or two.
As we all know (and experience), projects change daily. So while you’re busy manually creating a dynamic Gantt chart in MS Word, the data, people, and circumstances might change, and you’ll have to start over.
This inevitable situation is why it’s essential to use an intuitive software tool to remove the manual work and update in real-time. With ClickUp, a powerful Microsoft Project alternative, you won’t need to create multiple versions of Gantt chart templates!
ClickUp is the ultimate productivity platform allowing teams to manage projects, collaborate smarter, and bring all work under one tool. Whether you’re new to productivity apps or an expert project manager, ClickUp’s customization can stretch to any team size for consistent collaboration.

Access ClickUp on any device, anywhere, any time
ClickUp’s Gantt view couldn’t be any easier to create and manage.
- Click + View in your desired Space, Folder, or List
- Select Gantt
- Enter a name for this view
- Check the Personal view box if you don’t want anyone else to access it
- Check the Pin view box if you want it always to display
- Click Add View
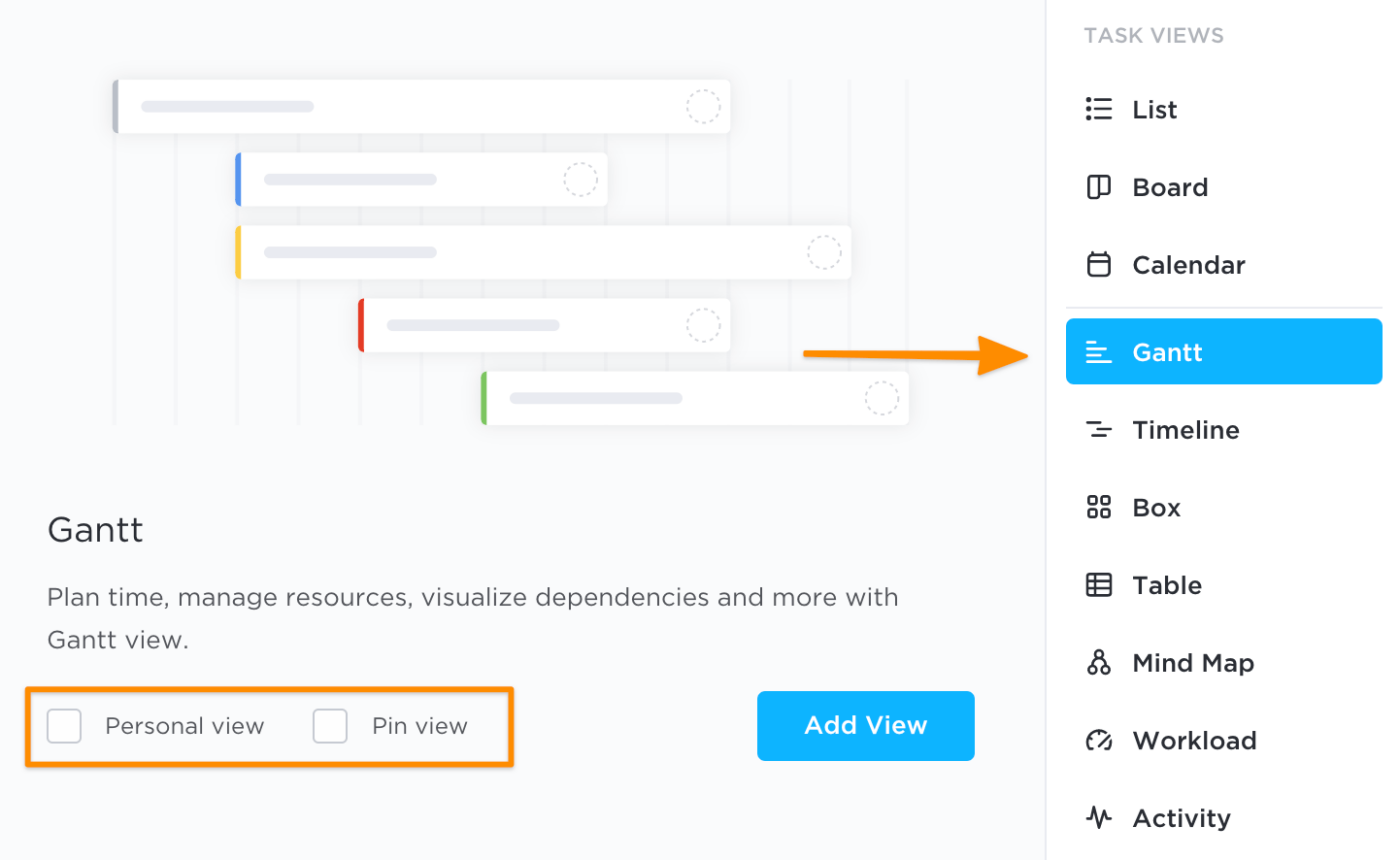
Add a view through the + in the Views Bar
What Microsoft Word can’t do that the ClickUp’s Gantt chart feature exceeds at is setting and managing dependent tasks:
- Quickly determine how much time is required to complete a task by hovering over the progress bar
- View the critical path (chain of tasks crucial to a project’s completion)
- Manage project tasks in singles or groups

Set dependencies and determine the chain of tasks crucial to a project’s completion with Critical Path and Slack Time
With the drag-and-drop editor, make changes in seconds to your Gantt Chart without starting from scratch:
- Adjust start dates and due dates without creating a second table
- Add tasks at any given time to accommodate the project plan scope
- Open a task for description, assignees, project data, and more
What’s next?
Create your professional Gantt chart in ClickUp, a feature-rich project management tool, and share it with anyone for free today!


Questions? Comments? Visit our Help Center for support.