
Sorry, there were no results found for “”
Sorry, there were no results found for “”
Sorry, there were no results found for “”
Understanding how a project moves from one stage to another depends on how well you can visualize the flow of the project. That’s what’s made flowchart software so popular for teams needing more visual clarity.
However, some teams focus on the free software available and want to know how to make a flowchart in Google Docs. It’s not the most beneficial and simple way to create a flowchart, but it can be done!
For quick sketches and midday doodles, this system is just fine. But for complex flowcharts and workflow diagrams, there are so many other effective and functional resources that are just as convenient as the trusted pen and paper—promise.
In the context of this post, we are going to focus on just one of those alternatives—creating flowcharts in Google Docs.
Now, you may be a long-time Google Doc user wondering how you could’ve possibly gone this long without knowing that your favorite document editor was capable of so much more, but you’re not alone!
Follow along as we tell you everything you need to know about making flowcharts in Google Docs including a step-by-step guide and a crash course on flowcharts.
A flowchart is a visual tool that graphically represents a process or workflow.
Most users prefer them to represent large amounts of data or use them to plan complex concepts. They are easy to read and help break down complicated processes in a more digestible way due to their visual nature—they’re also very accessible for team members who process information differently.
In project management, flowcharts are a key element in the planning phase because they complement any project methodology including adaptive project framework, project cycle management, or agile. As a visual aid, flowcharts provide:
If you’re thinking of making a flowchart in Google Docs, ClickUp’s free Data Flow Diagram Template gives you a cleaner way to map things out.
To understand how to create and read a flowchart, let’s first dive into its most typical qualities and attributes.
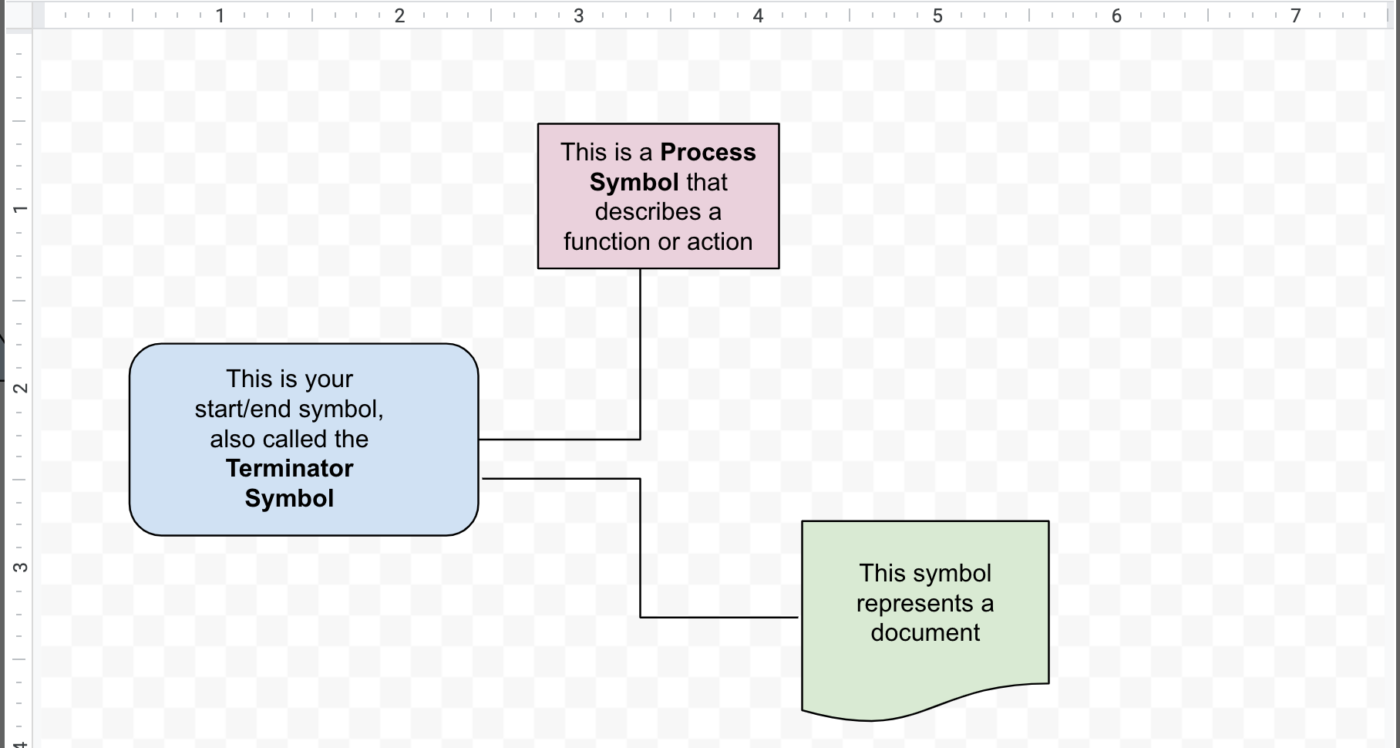
Like all of your favorite stories, most flowcharts have a beginning and an end, denoted by a rounded rectangle or terminal symbol.
The process shows what is being done and is depicted by a rectangular-shaped component that is labeled by an action. “Turn off the TV,” “feed the cat,” and “call the executive supervisor,” are some examples.
This is where flowcharts show decisions to simple questions. We’re talking yes or no and true or false questions here. The process—or algorithm—will run in two different directions depending on the answers to the questions. A diamond or rhombus represents the decision sign.
The direction of a process is shown by arrows, also called flow lines.
Google Docs is a powerful document editor tool that can also be helpful in project management too. It is most commonly used for composing and formatting text documents, editing alongside other users, and securely sharing pages, but the built-in Google Drawings is also a great resource for creating custom flowcharts. Here’s how:
First things first—we’re starting with a blank Google document.
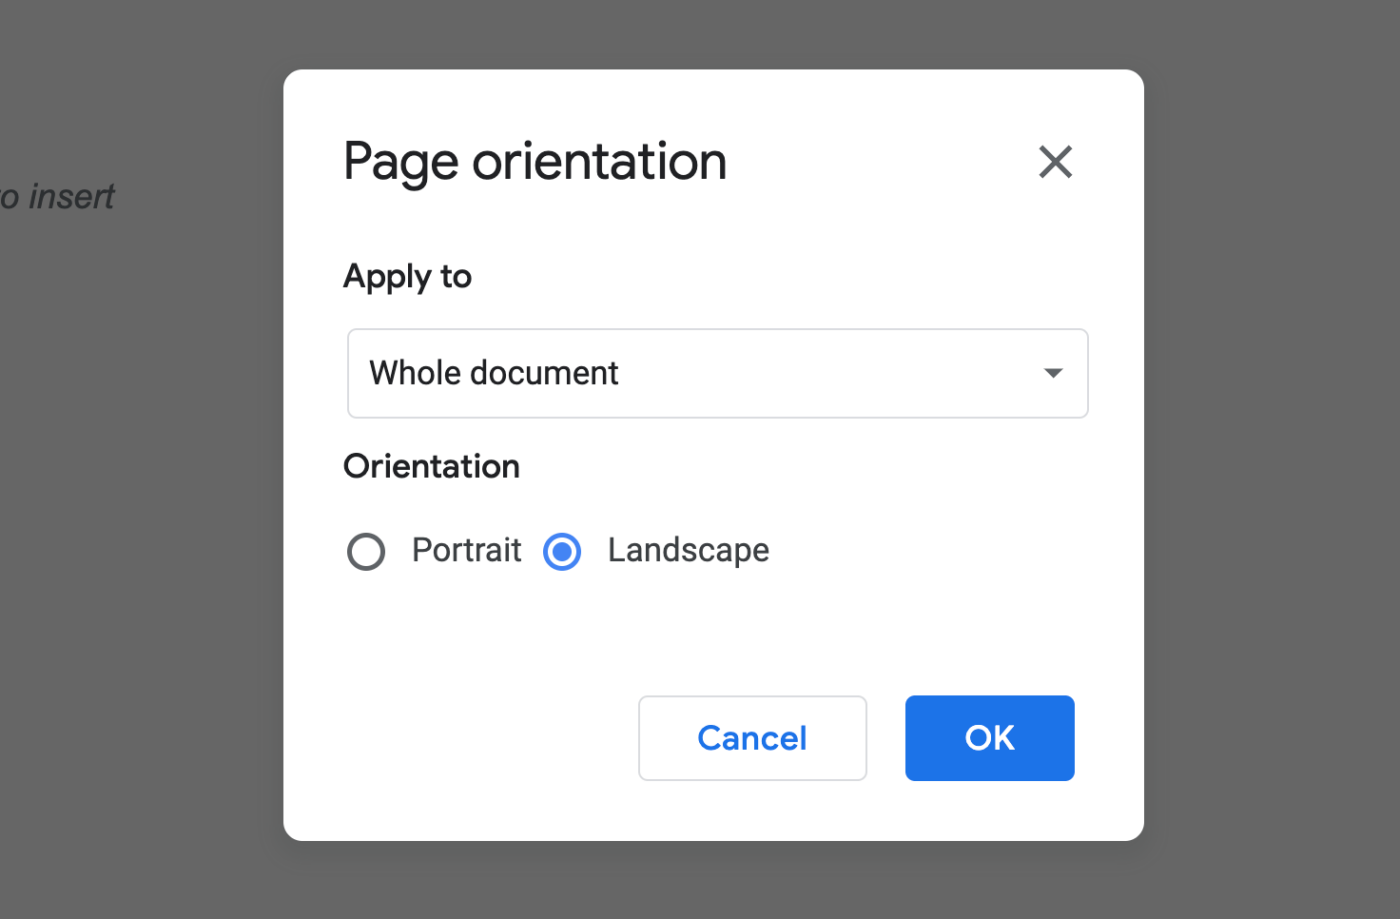
If your flowchart is horizontal, click Page setup from the File tab, then Landscape to convert the page’s orientation to landscape.
To make a flowchart, we’ll use Google Docs’ diagramming tool.
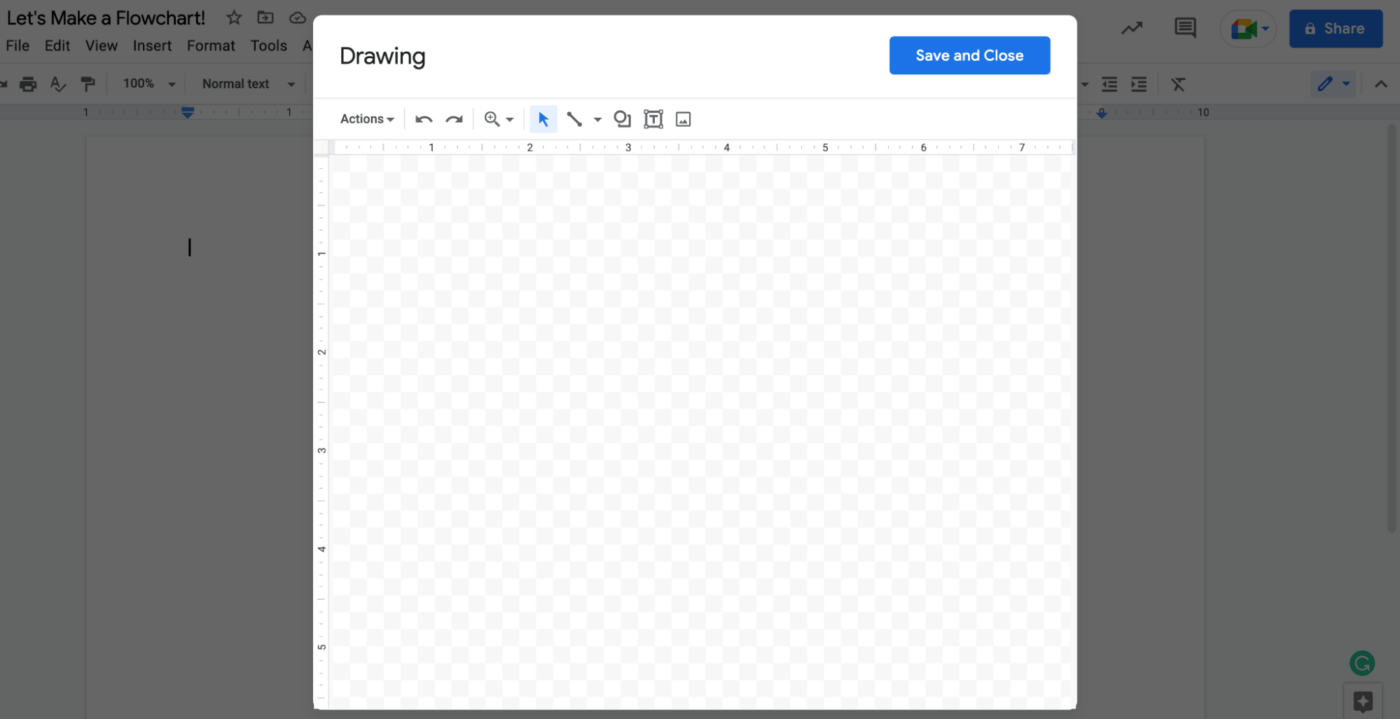
Access this tool by navigating to the top menu bar and selecting Insert, then hover your cursor over the Drawing option and select New.
At the top of your blank document, a blank sketching canvas will appear. Before we add anything, let’s just take a quick look around the tool.
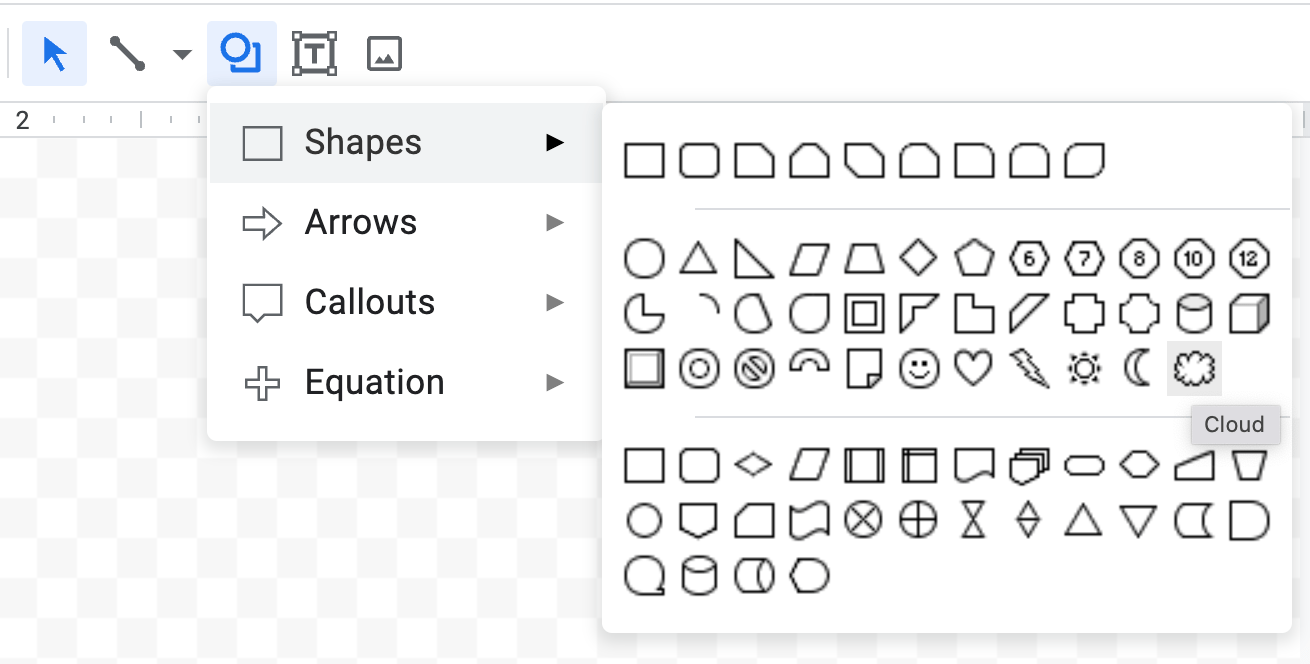
Click the Shapes tool on the drawing toolbar for a full view of your flowcharting objects, then select Shapes from the list of choices. You can also locate the many flowcharting shapes in the bottom section of your menu.
If you’re not sure what certain shapes mean in flowcharting, hover your mouse over the shape for a text description of its purpose.
Now for the good stuff—actually creating your flowchart!
To start adding content to the chart, go to the Shapes menu and choose the flowchart terminator—or the rounded rectangle.
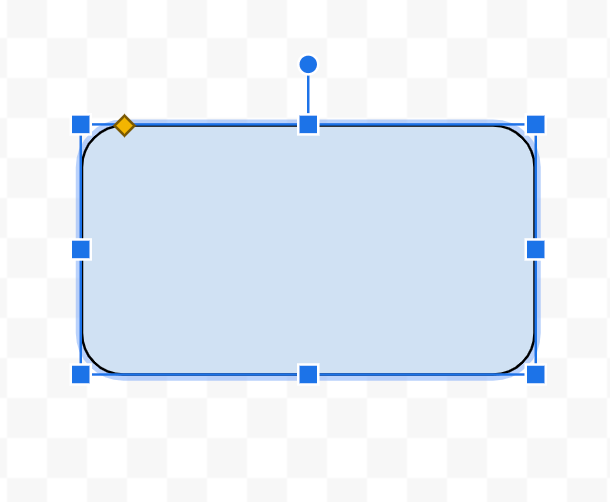
You can individually add each object to fill out your chart, or if you’ve resized any of them, you can copy and paste the shapes to make sure they’re all the same size.
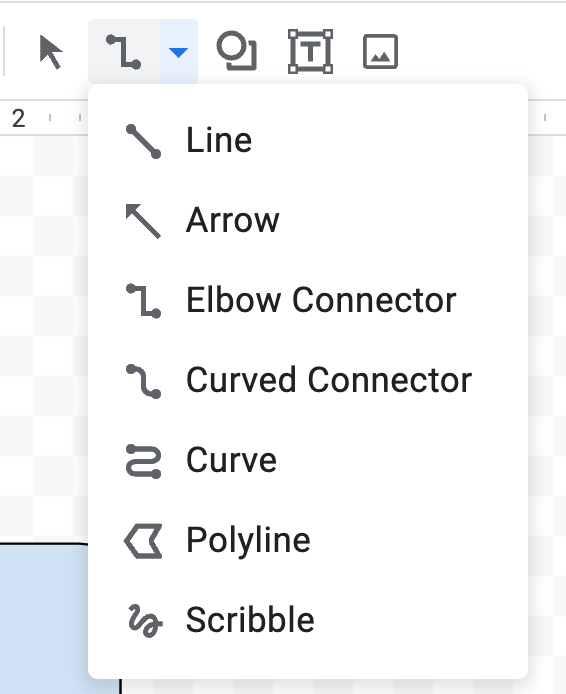
Click the Line tool on the toolbar, and select Arrow or Elbow Connector from the drop-down menu, depending on the sort of arrow or flow line you require.
Using the Text tool (the boxed T icon in the drawing panel), add text inside your shapes.
Highlight your text, then click the three dots in the toolbar to format and style your text. You can alter the font type, change the text size, and position it as you please.
To keep the same formatting across each shape, copy and paste the content to the next box, then just edit the text.
Okay, this step might take a little bit of getting used to.
People love Google Docs for its auto-save feature—where they can even work offline and open their doc at any time to view its most updated version without ever hitting save. But to make sure your flowchart is added to your Google document, you need to hit the blue Save and Close button when you’re finished.
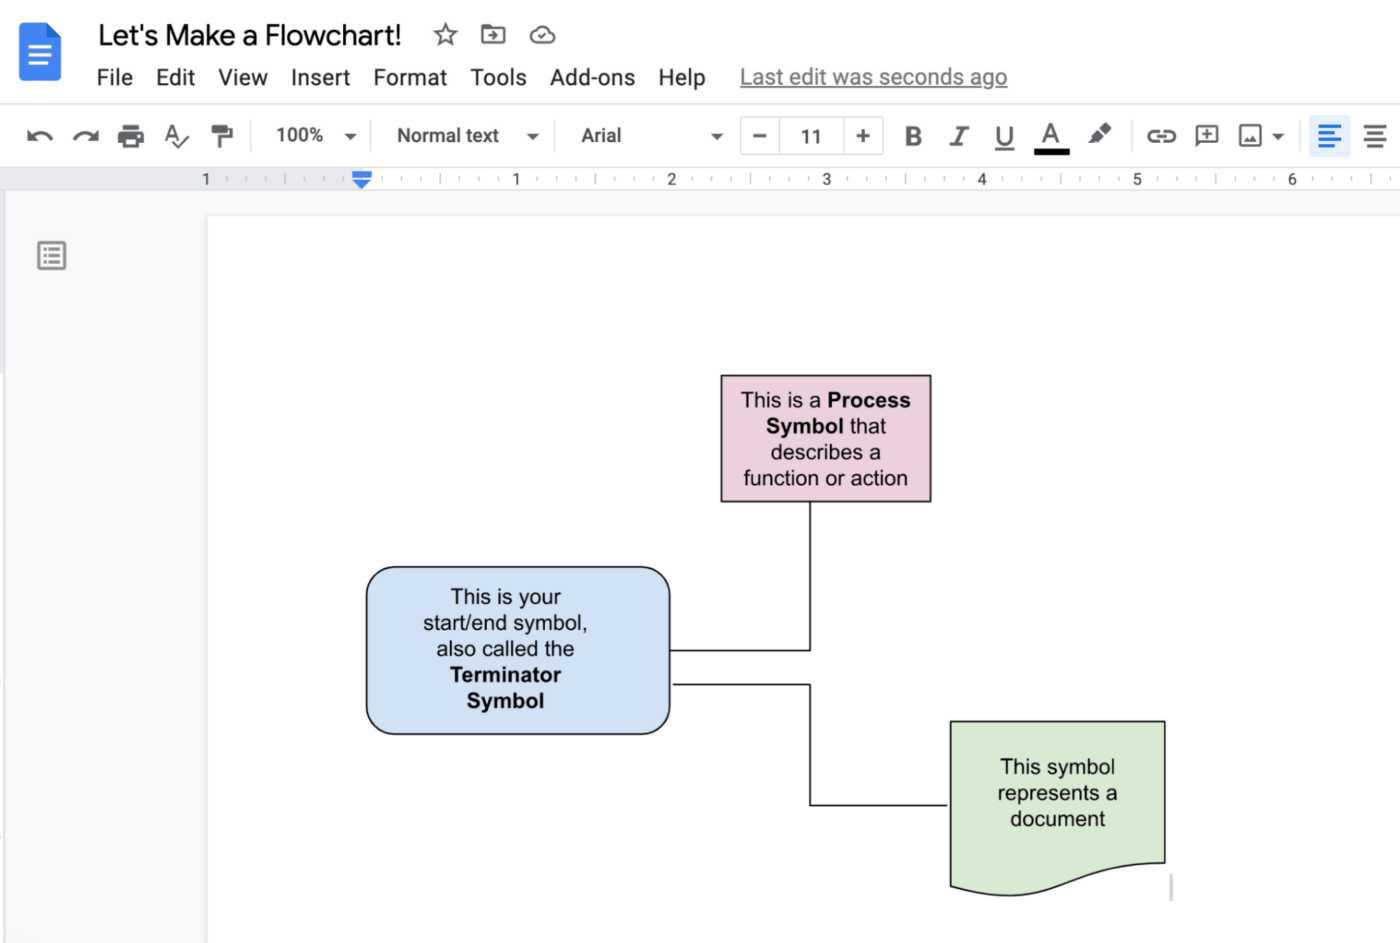
If you need to make adjustments to the flowchart, double-click on it and you’ll be sent back to the painting canvas.
And voila! You have yourself a Google Doc flowchart! 🎉
Bonus: Flowchart software for Mac & Google Docs Family Tree!
While there are several flowchart variations, we will focus on four of the most common use cases.
These four popular flowcharts are ideal for:
A process flowchart, also known as a process flow diagram, is the most adaptable of the four flowcharts because we can use it for virtually anything.
But most commonly, organizations use process flowcharts to explain how things operate in your company.
Workflow diagrams show how a process or an organization works. They assist you in analyzing the movement of data and documents throughout your entire organization.
When you need to show multiple categories of information side by side, the swimlane flowchart is your go-to tool.
Swimlane diagrams may appear to be quite similar to workflow diagrams, but the major difference is that they allow you to divide activities into several categories.
A swimlane flowchart is useful for documenting a comprehensive process that involves multiple teams or affects different parts of an organization.
A data flowchart shows how the process of data “flows.” It is helpful when you want to develop a new system or assess an existing one.
Although it is most commonly used for software design and development, data flowcharts are also useful to evaluate any spread of information, such as how data travels through an organization.

The Google Docs Flowchart Template from Template.net is a robust, user-friendly tool that helps streamline the process of creating professional and visually appealing flowcharts. This template offers easy customization of colors, texts, lines, and shapes, giving users complete control to design a flowchart that perfectly meets their specific requirements.
Whether you wish to illustrate a complex process, a workflow, or a system, the Google Docs Flowchart Template empowers you to effortlessly create a concise and clear graphical representation. Moreover, this flowchart template is entirely downloadable, editable, and versatile, granting users the freedom to access and modify their creations at their convenience. No need for a high degree of technical expertise, instead you can lay out intricate processes with ease using the features provided in this user-friendly template.
Google Docs is both intuitive and easy to share with the team. With live cursors to edit in real-time and without a save button, Google Docs makes document creation collaborative and—dare we say—fun.
But unfortunately, it’s not all rainbows and butterflies when it comes to Google Doc flowcharts.
Here are three of its most challenging limitations:
Google Docs is accessible through a web browser. This means users can work from anywhere as long as they have an internet connection.
Google now has a Drive software for Chrome and a Drive desktop program that allows you to access all of your Drive files, including Doc files, offline. It sounds fantastic, but there are a few limits you should know because you must plan ahead of time to work offline.
First, ensure that you’ve configured Drive for offline use and select the files you will access offline. If you don’t, you won’t be able to use Docs offline.
However, there is a drawback to this. There are no flowcharts if there is no internet connection. Flowcharts in Google Docs are reliant on the save button, so you can access flowcharts you’ve already made offline, but will face challenges when trying to make one from scratch without Wi-Fi.
Yes, Google Docs can display basic flowcharts, but this document editor was created for generating and sharing documents, similar to Microsoft Word.
If Google Docs had built-in flowchart templates or made the shapes tool a little simpler, the flowchart possibilities and user experience would be wildly different. But you must copy and paste shapes to replicate your work—a tedious and time-consuming process that is not ideal for complex charts.
So, you’ve made a flowchart in Google Docs. What now? Can you create tasks? Nope. What about assigning or scheduling them? Also nope.
While you can make a flowchart in Google Docs, there isn’t much else you can do to act on it because it isn’t actually connected to any real workflow, it just maps one out.
TBH, ClickUp is the only digital flowchart maker you’ll ever need.
ClickUp is an all-in-one productivity platform that teams of all sizes and across industries rely on to manage projects, create complex flowcharts, and optimize their processes with the entire team. Whether you’re a solopreneur or part of a large-scale enterprise team, ClickUp is flexible enough to align with any workflow—no matter what project style you use. 🏆
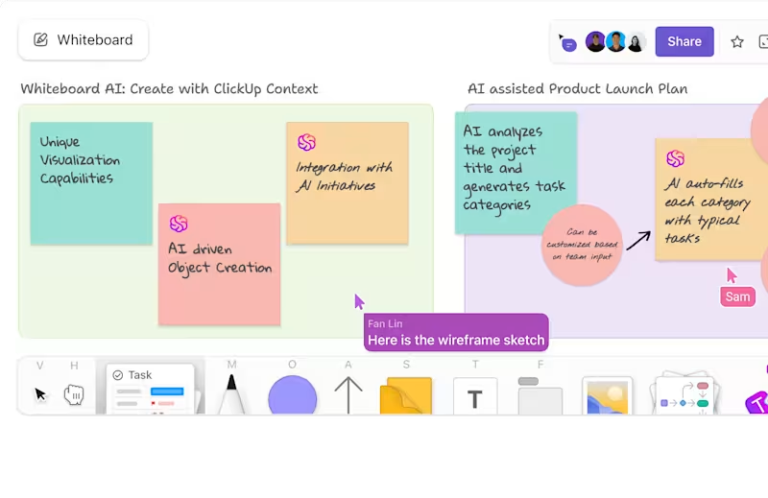
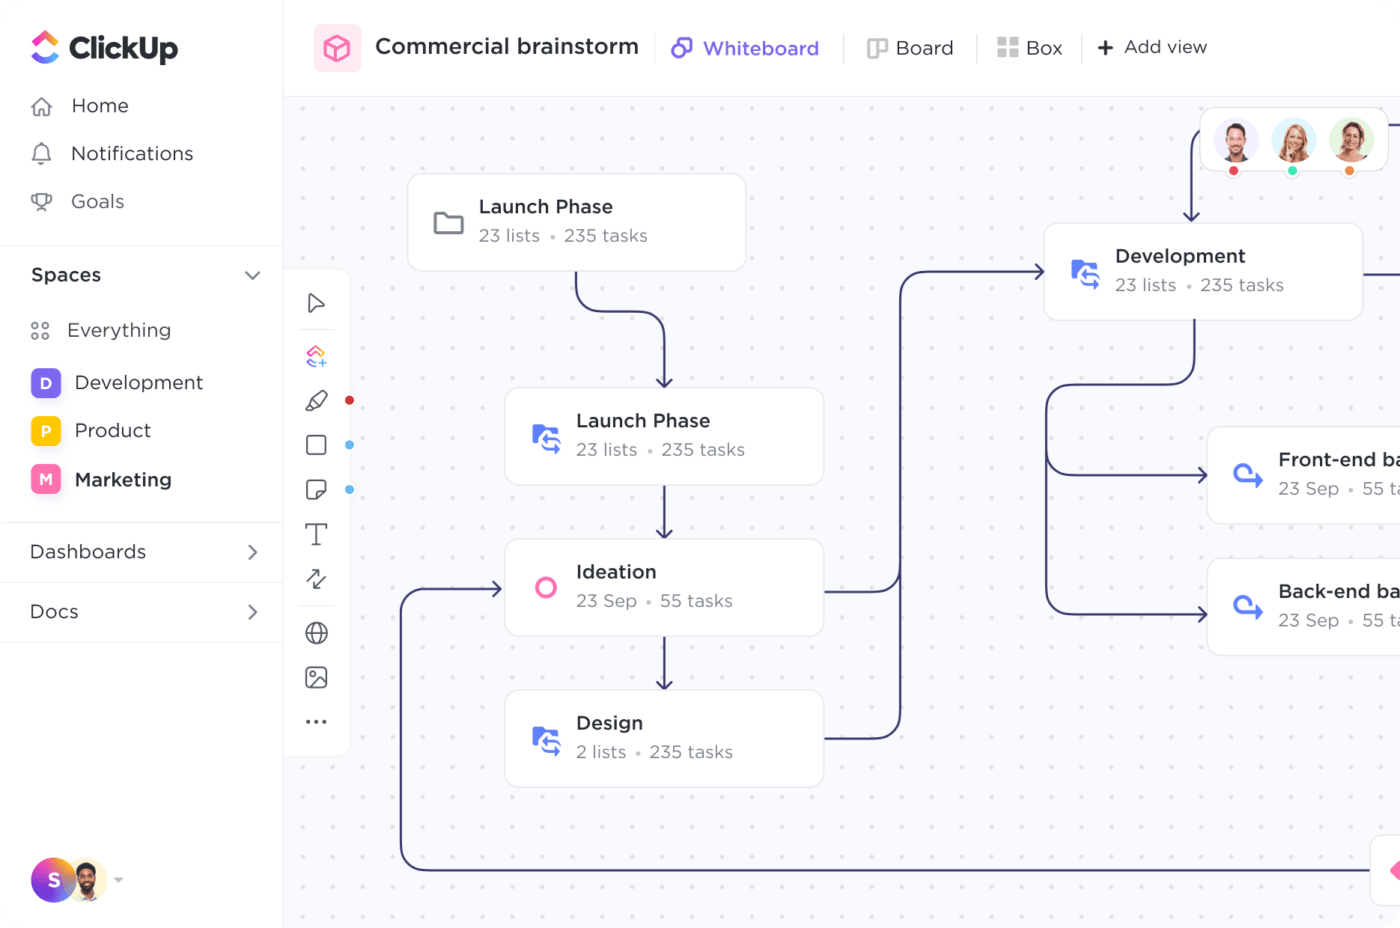
Easily create, edit, and share flowcharts for even the most complex of projects, and store it in your Workspace forever. Follow these simple steps from start to finish, then let your creativity run wild with flowcharts in ClickUp Whiteboards:
Starting with the final aim in mind, choose the best flowchart for you. Here are a few ideas to get your thoughts going—you may create a diagram to…
ClickUp Whiteboards offer all the creative and collaboration features you need to construct the flowcharts of your dreams—and then some. But the best part? This powerful tool is completely free. All you have to do is sign up!
From anywhere in your Workspace, simply go to + View, scroll down, and click on Whiteboard. You’ll be greeted with a blank canvas, full of possibility. But drawing your flowchart freehanded is not your only option! More on that in a little bit though. 🥳
You don’t have to make a flowchart all on your own. Collaboration invites new ideas, improvements, and innovation to any project—simply ask your team to be a part of the process with real-time editing and live cursors so you can work alongside members without overlap. 🤩
Adjust your Sharing & Permissions under Space Settings in ClickUp to invite team members to join your space. Once you’ve onboarded your team members, you’ll all share the same freedom to edit, create, and chart as you please.
Have more questions about how to onboard like a pro? Check out this post on how ClickUp’s Talent Development team uses ClickUp to onboard new team members!
We love ClickUp Whiteboards because they are truly limitless. You can create flowcharts by choosing a flowchart template, draw your chart freehand, or, use one of its adjustable shapes (that can be converted directly into ClickUp tasks).
You can draw connections between any shapes and media on your Whiteboard, meaning your flowchart can take place at any time, and form out of any cluster of information on your board.
Add text within a shape, on a sticky note, embed a ClickUp Doc and so much more—then use rich text editing to make your writing stand out on your chart. And for quick access, use ClickUp’s Slash Commands and keyboard shortcuts to choose from any number of styling and formatting options.
Since the canvas is infinite, you can make as many flowcharts as you need without ever running out of space, simply drag your cursor to an open area and continue creating on the same board! Share, edit, and present a clean flowchart from your Whiteboard at any time.
Plus, your Whiteboard is automatically connected to your workflow, so you can start acting on your ideas and putting your flowchart to use ASAP!

But that’s not all! ClickUp offers a feature-rich experience across all of its tools, making it as functional as it is fun to use.
To give you an idea of else you can expect, here are some additional ClickUp features for optimizing your flowcharts, workflows, processes, and more:
Making a basic flowchart in Google Docs may be free, but the time commitment is not!
Without templates, the ability to connect your Google Doc flowchart to your workflow, or a more intuitive UI, you’ll lose precious time that could’ve been focused on your team or project.
The good news is that ClickUp gives you access to a vast library of templates to start flowcharting in the way that makes the most sense to you, and a powerful digital Whiteboard to encourage your creativity, even if you’re starting from scratch.
Since flowcharts are useful for communicating a wide range of information, you can bet that the four examples above are only the tip of the iceberg.
Start crushing and exceeding your company goals with interactive, intuitive, and flexible flowcharts in ClickUp—and get started for free!
Access ClickUp Docs, Whiteboards, and flowcharting templates—plus 100MB of storage, and unlimited tasks and members with ClickUp’s Free Forever Plan.
So, what are you waiting for?

Manasi Nair
Max 24min read
Manasi Nair
Max 20min read
Manasi Nair
Max 24min read

© 2026 ClickUp


