Sorry, there were no results found for “”
Sorry, there were no results found for “”
Sorry, there were no results found for “”
As any seasoned software project manager knows, a project isn’t just a project. Success requires hard work and focus, but it also requires looking at the bigger picture. That’s why so many PMs use dependency diagrams to easily map their software dependencies.
A dependency diagram is technically a mathematical model, but it’s also an indispensable tool for software engineering teams—especially teams with large code bases. Dependency graphs visualize the different dependencies in a software project. This helps engineers understand the impact of changes before they make them and identify pesky bottlenecks before it’s too late.
You don’t need to manually create a dependency graph, either. Dependency graph software easily integrates with your data so you can design better code, faster. ⌛
In this guide, we’ll tell you how to spot a high-quality dependency graph tool, as well as our top 10 favorite options for the job.
Java, Python, JavaScript, and PHP are essential to your work, but let’s be real: Modern software ecosystems are complicated. And if you’re dealing with legacy code or large code bases, you need a tool that uses efficient algorithms to generate these graphs for you.
GitHub and other open-source platforms come with a lot of options, but in our opinion, tools with these features are your best bet:
Bottlenecks are no fun. Fortunately, careful planning eliminates most delays and problems. Generate dependency graphs at the start of any project to clarify your workflow and stay one step ahead.
You’re free to choose your faves, but in our opinion, these are the 10 best dependency graph tools.
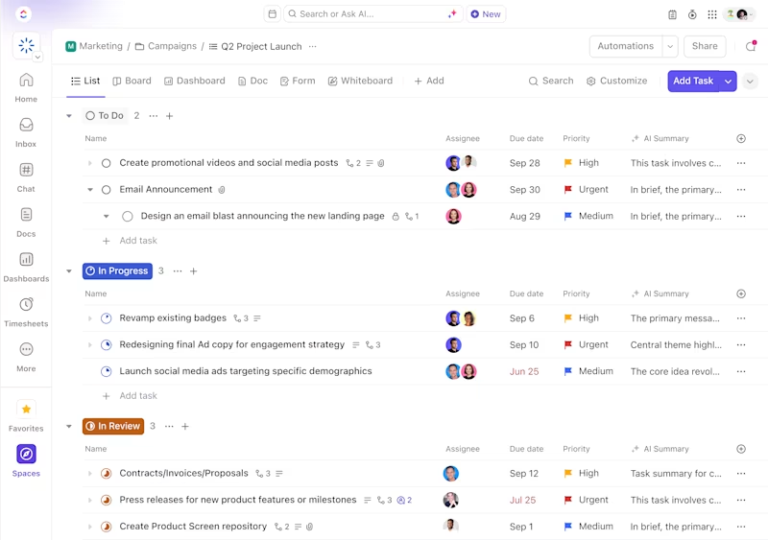
Not to toot our own horn, but ClickUp is the all-in-one web-based dependency graph software that developers use to build a perfect database. Easily link tasks, documents, and dependencies to bring everything into one place. With ClickUp Dependencies, you create a clear order of operations so everyone knows what order you need to complete tasks.
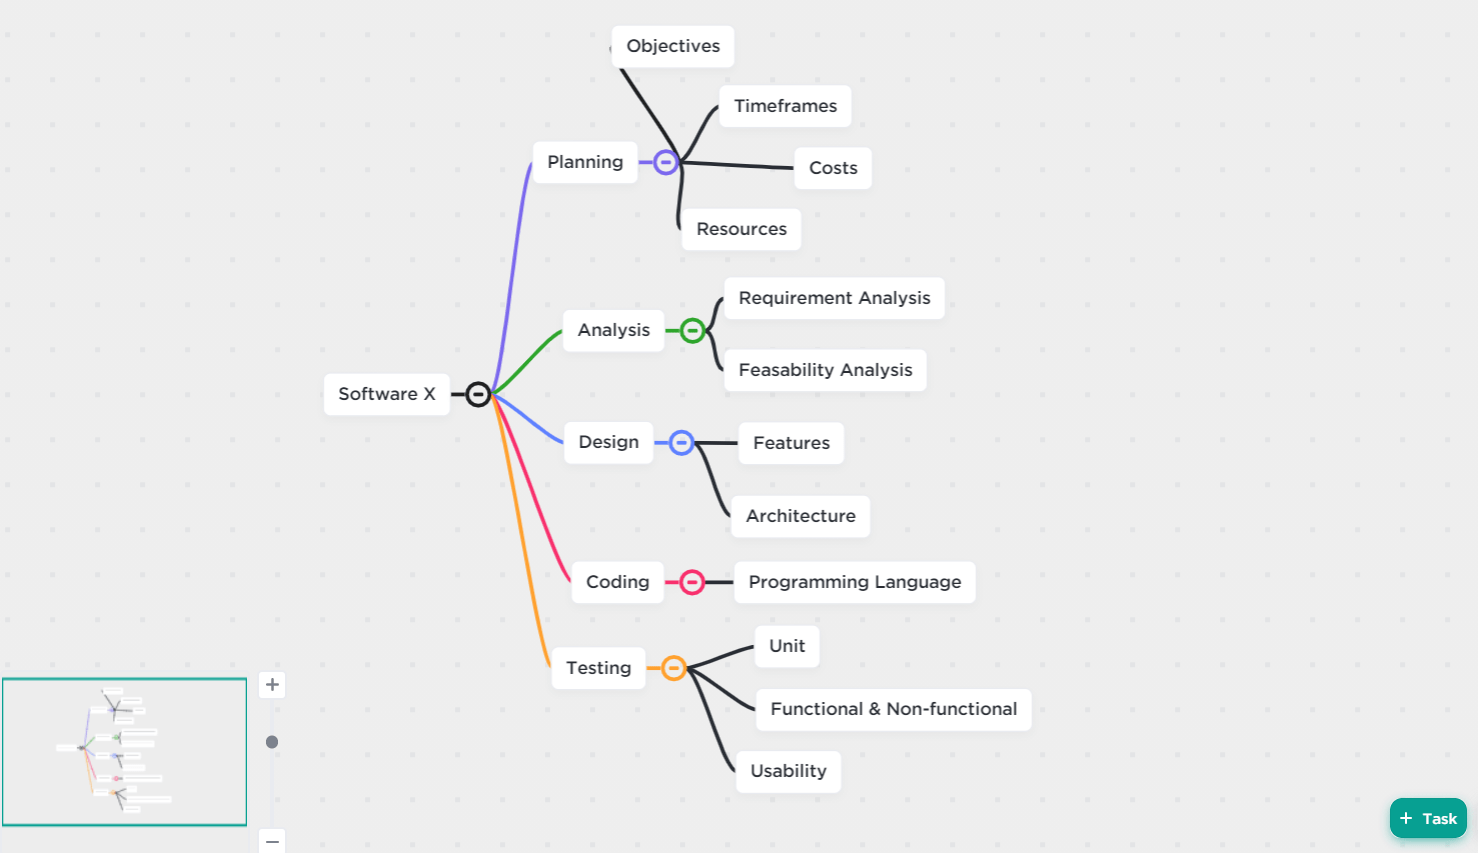
It isn’t just for software development, either. In ClickUp, you can create dependencies for projects themselves, linking clients to certain tasks or orders. Use the ClickUp Gantt chart view to manage project timelines or use ClickUp Mind Maps to brainstorm before project kickoff. ✨
That’s right: You can use the same system for the folks in programming, marketing, HR, customer service, and more. There are enough job-specific features in ClickUp to keep everyone happy.
📮ClickUp Insight: When a goal falls short, only 34% of our survey respondents revise their strategy and 33% just give up. 🫢
But failure isn’t the end; it’s feedback.
You can easily unpack what went wrong with ClickUp Mind Maps and Whiteboards, explore new ideas, and chart a smarter course forward. Think of it as your built-in bounce-back plan.
💫 Real Results: ClickUp users say they can take on ~10% more work—because setting realistic goals means more wins and fewer meltdowns.
Whimsical combines diagramming and whiteboarding into the same software. It’s a helpful tool not just for brainstorming ideas, but for sharing them with your team and executing them.
Use the Flowchart tool to drag and drop your way to gorgeous dependency graphs. Whimsical allows you to collaborate with your team in real-time to create clear, colorful graphics that get everyone on the same page.
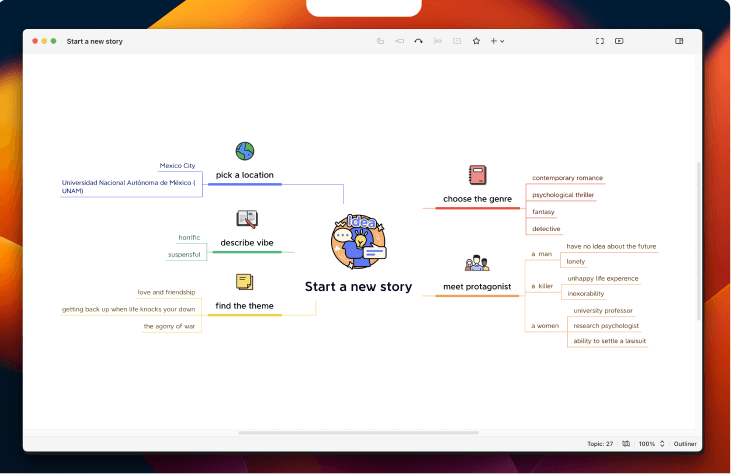
XMind is a mind-mapping and brainstorming app that’s been around since 2006. This dependency graph software captures ideas using premade templates, which it calls Structures, to bring your ideas to life. Pluck a Structure for fishbone graphs, org charts, tree tables, and a lot more.
We also like that XMind allows you to add your own color themes. If you’re sharing graphics with other folks, the customization feature makes it easy to drop in your company branding in just a few clicks.
Keep in mind that this is a more marketing-centric tool. As a software team, you may need to manually plug in your data to correctly display dependencies. ?
Check out these Xmind alternatives!
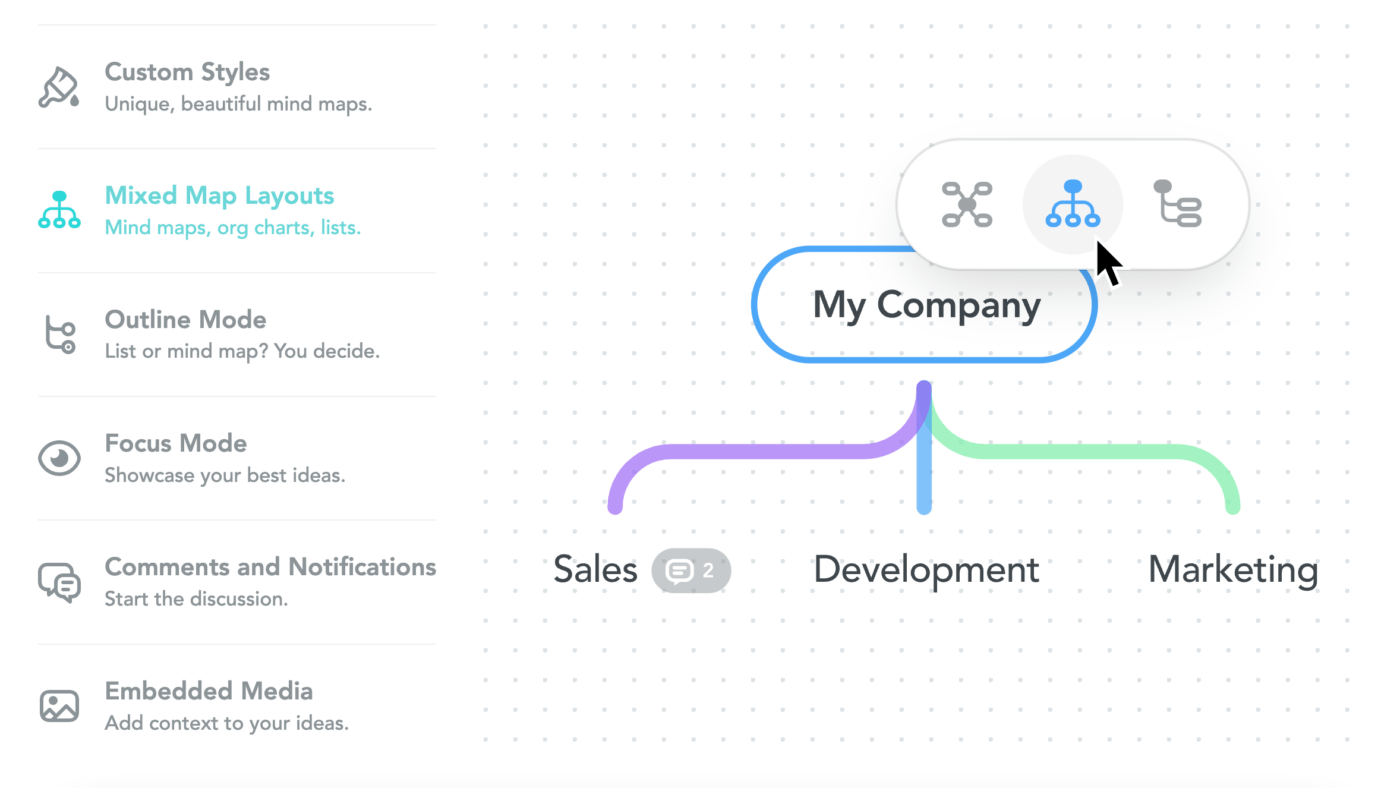
EdrawMind is primarily an idea visualization solution, but you can use it as a dependency graph tool. Non-technical teams also use it for outlining, mind maps, and brainstorming.
We love that EdrawMind integrates AI into all of its tools, too. This seriously speeds up the time spent formatting and creating content. Just plug in a few guidelines and AI will spit out a mind map for you to run with.
EdrawMind has a different type of pricing structure. The lifetime plan gives you access to lifetime upgrades and priority support. If you upgrade to the Bundle Plan, you also get access to EdrawMax and EdrawProj, which is ideal if you want all Edraw tools.
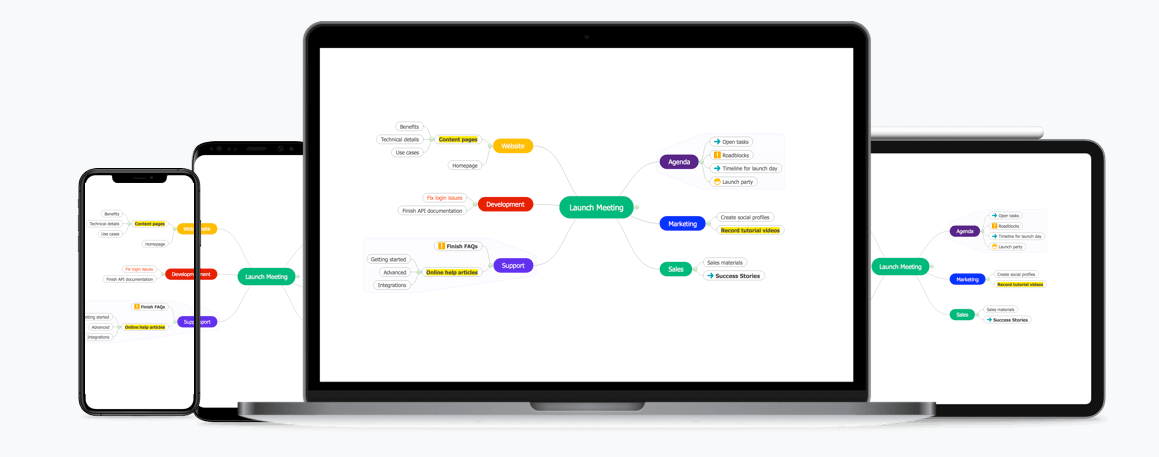
MindMeister is a tool for idea visualization, collaboration, task management, and even presentations.
Are you pulling ideas from multiple sources? MindMeister allows you to add links, attachments, and embedded content to each graphic from sources like YouTube and Google Drive.
If you want task management and a note-taking app, you’re better off buying the MindMeister bundle so you get access to all MindMeister products in the same suite.
Creately is a data-powered dependency graph software that connects the dots across projects and teams. It has graphics solutions tailored to software and IT, as well as product, marketing, HR, and sales. ???
For software developers, Creately offers a visual studio where you build out architecture before coding. It even helps with implementation and traceability after launch.
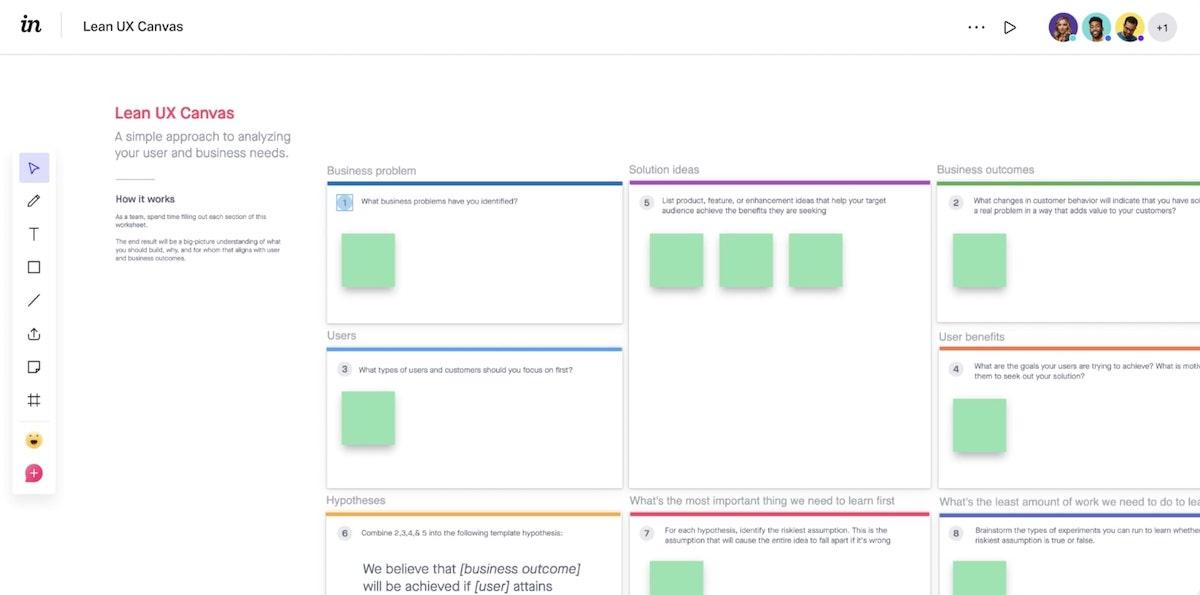
InVision is a collaborative whiteboard tool for real-time collaboration. While it doesn’t necessarily have features tailored to software development, InVision does include tools that streamline the development process.
Build out your UI/UX experience in a graph first and then share it with other stakeholders to get input before you write a single line of code. This cuts down on revisions down the line after you’ve built the solution.
Oh, and if you’re already using another whiteboard software and want to switch, you’re in luck. InVision’s importer tool gives you the power to port whiteboards from tools like Miro or Mural over to InVision.
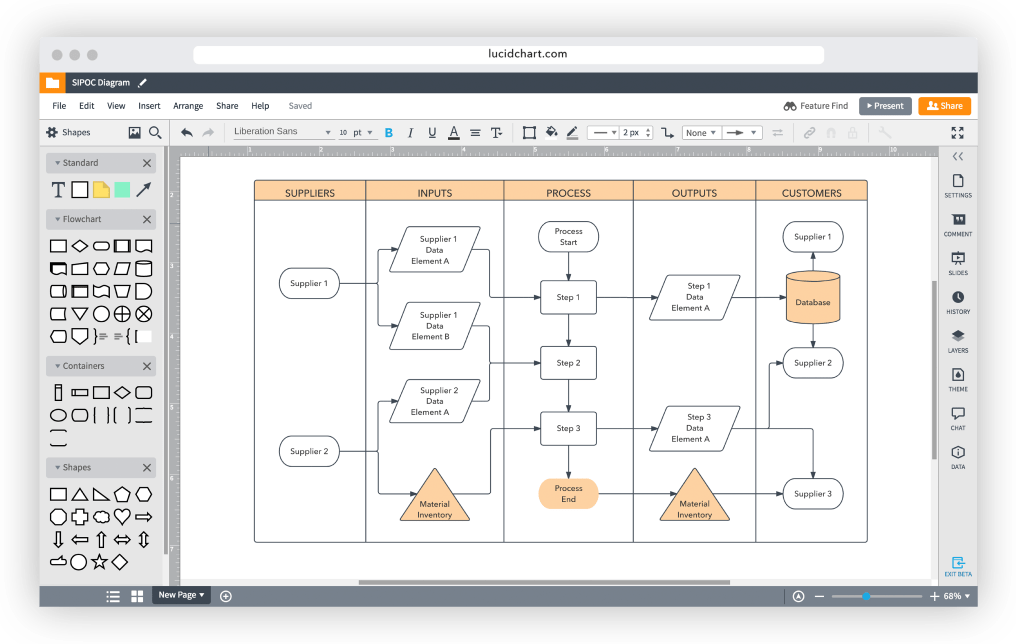
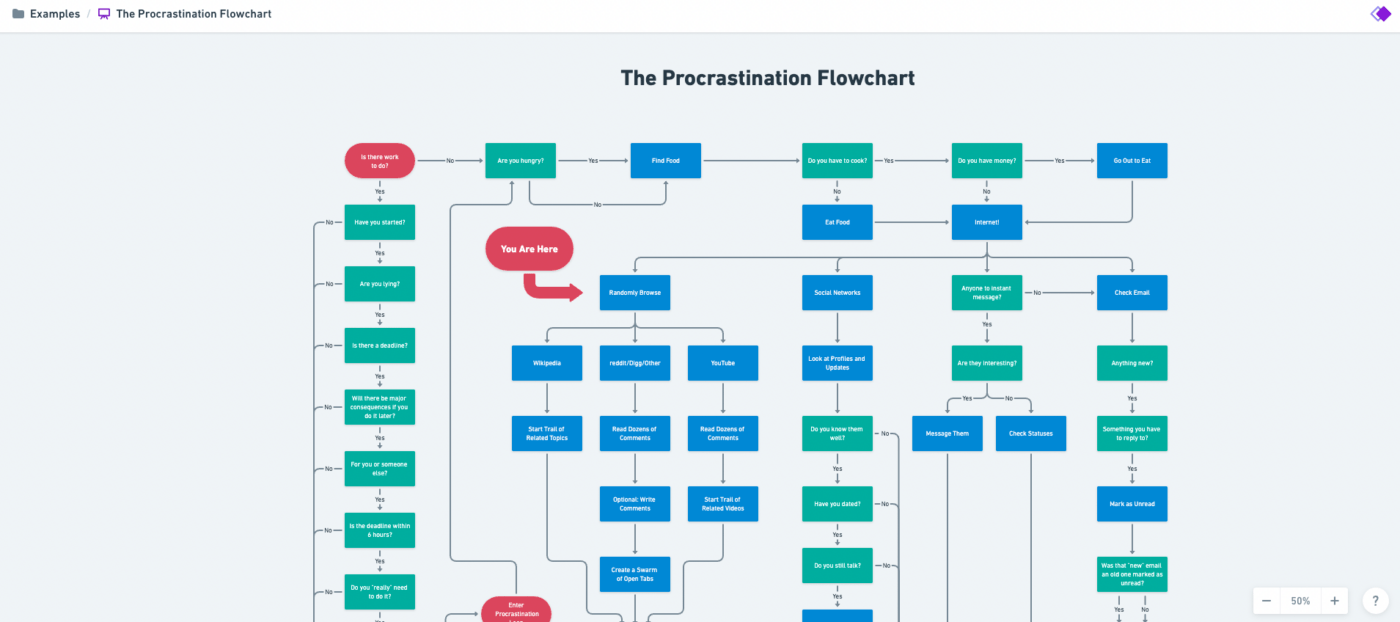
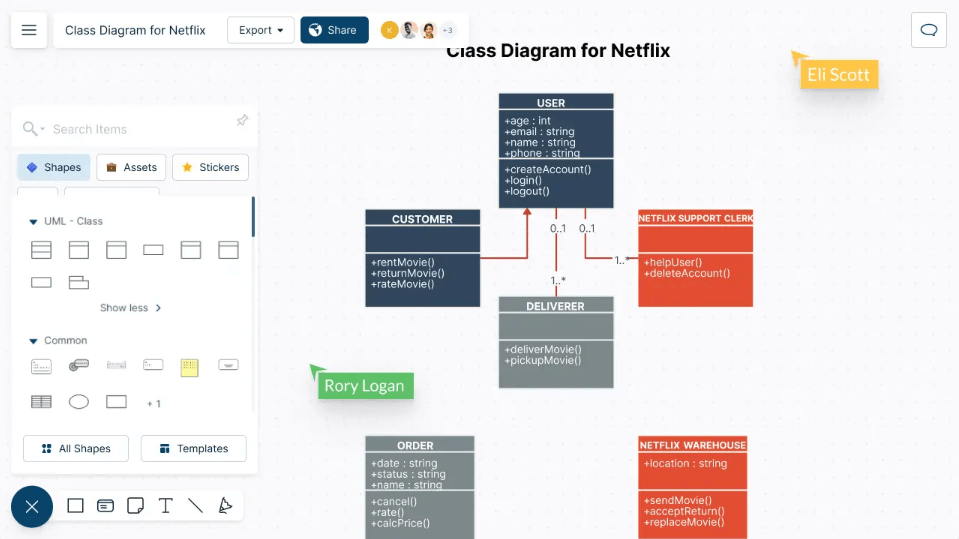
Lucidchart is a diagramming application used for visualizing systems and architecture. Thanks to its integrations with solutions like Confluence, Lucidchart is a popular dependency graph software for programmers.
Use this software to visualize how data flows through your business, systems, and processes. Lucidchart pulls live data to show how these changes will have an impact on your system as a whole.
Check out these Lucidchart alternatives!
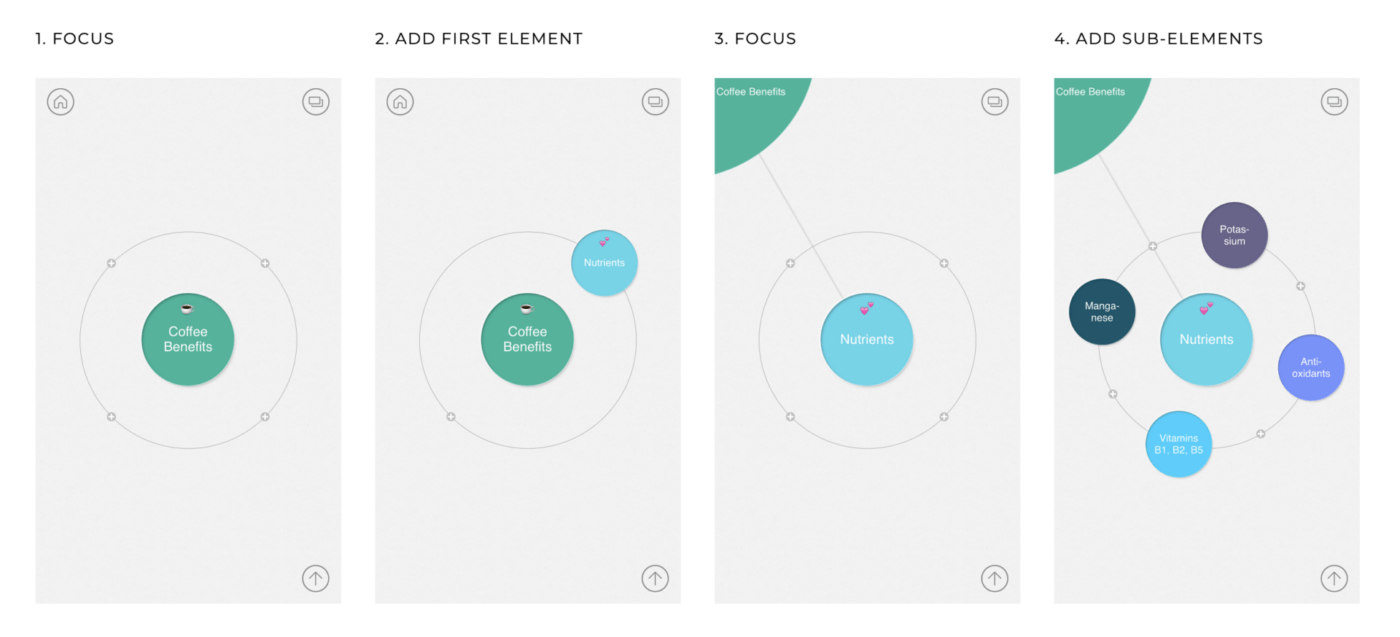
Mindly is a tool for capturing and organizing ideas. It’s basically an on-the-go mind-mapping and brainstorming tool. This tool is tailored more toward creative types, so it won’t have specific features for software programmers.
However, if you work with a front-end team, Mindly is a helpful tool for storing all of your spur-of-the-moment ideas. ?
We like that Mindly is mobile-first, so it’s available on Android and iOS—and even MacOS—so it’s ideal for cross-platform folks who need syncing across devices.
Sure, it has limited features, but most of these features are available for free. Even if you do upgrade, it’s $7 for unfettered access to everything. That’s pretty budget-friendly, wouldn’t you say?
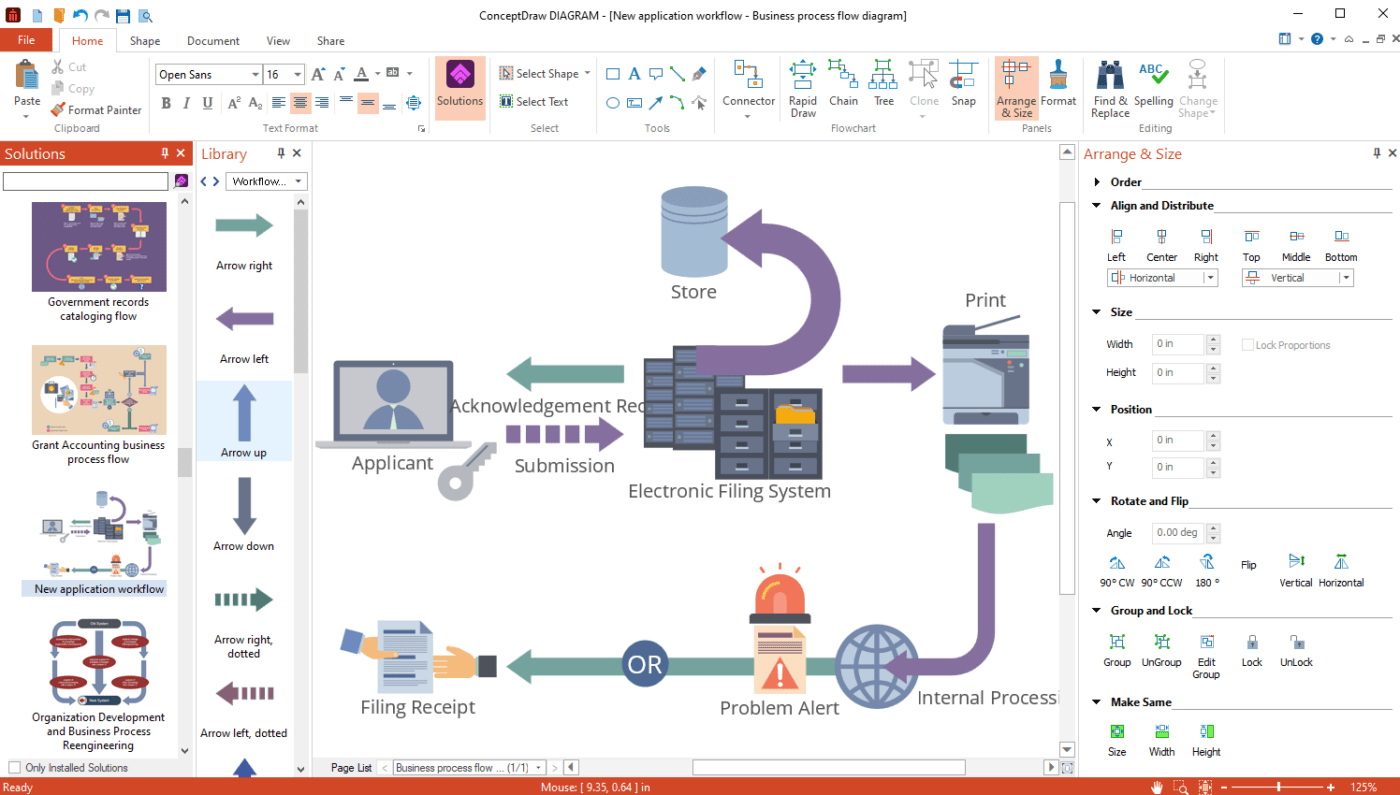
ConceptDraw is part of the ConceptDraw Office Suite, which gives managers end-to-end help with business documentation. These folks have thousands of stencils and hundreds of templates—plus add-ons—to boost your workflows.
The Live Objects feature is especially helpful for software teams. Live Objects pull in external data to give you a live view of how changes will affect your current workflows. You can use it for performance KPIs, but it works great for dependencies, too.
Dependency graph software makes it easy to create dependency graphs. The right dependency graph tool reduces your graphic designer’s workload and gives you the power to create stunning graphs that get your team on the same page.
But guess what? You don’t need to buy a fancy schmancy graphics tool. Just use ClickUp: We give you access to a lot more than graphic templates (although ours are pretty great). ?
With ClickUp, you get access to Docs, Whiteboards, team chats, documentation, and even an AI tool on the same platform. Save hours every week by planning and completing all of your project to-dos in the same place.
But don’t take our word for it. ClickUp is Free Forever, with no credit card required. Sign up for ClickUp now.

Manasi Nair
Max 26min read
Manasi Nair
Max 28min read
Manasi Nair
Max 27min read

© 2026 ClickUp