


Still downloading templates?
There’s an easier way. Try a free AI Agent in ClickUp that actually does the work for you—set up in minutes, save hours every week.
Sorry, there were no results found for “”
Sorry, there were no results found for “”
Sorry, there were no results found for “”
How do you encourage your team to think about and achieve organizational goals? The first step is to take a deep inventory of your key performance indicators (KPIs).
You might worry that KPIs will get the team motivated for the first few months, then be lost in long email threads and revisited the day before an important meeting with senior leadership.
However, well-designed KPIs will empower teams to solve inefficiencies, eliminate time-sucking requests, and align tasks and projects with company-wide goals. This is what we want for you and your team, so we’ve put together a catalog of KPI examples and templates to answer your questions:
In what condition does a metric become a KPI? Who is part of the KPI development process? Where do I track KPI progress? How do I drive action and motivate my team toward the outcome?
We’ll cover all of the above—and then some—because KPIs are the secret weapon of modern business strategy. And everyone is qualified for the task.
A Key Performance Indicator or KPI is a quantifiable metric used to monitor progress in achieving business objectives. More specifically, a KPI gives performance insight into an organization’s most important asset: the people.
Everyone—front-line employees, managers, and senior leadership—has an influence on organizational goals. So as a team leader, you have the responsibility to give the people thoughtful, specific, and measurable KPIs.
For a KPI to be effective, it should have these five key elements:
If you’re more of a visual learner, check out this vlog about setting KPIs!
If you take one thing away from this guide, let it be this: effective key performance indicators allow people to make accurate and fast decisions.
Businesses should target the metrics that have the most impact on their sustainability. When you focus on needle-moving projects, tools, and systems, you are building a business roadmap to maximize your speed toward revenue growth.
So here is a step-by-step checklist to help you plan your KPIs the right way:
Let’s start with the basic understanding that sales KPIs look different from product KPIs, which are different from finance KPIs. Ask these questions to understand what to prioritize and how to measure success.
That said, if a key performance indicator does not contribute to a business goal, it’s gotta go!
Bonus: Product requirements document templates
Once you have these insights, organize the metrics into two categories: leading and lagging indicators.
We’ll say it: KPI reports are not the most thrilling to build.
It’s an (almost) everyday task requiring time to turn raw data into actionable insights. So much so, KPI reports typically have a short life span after it reaches an inbox for a few reasons:
Getting the right information at the right time is a necessity for data-driven businesses. People want to access KPIs on their smartphones, desktops, and even on the big screen at the office. If you’re looking for a free dashboard tool to meet these needs, try ClickUp!
Here at ClickUp, we’re super fans of KPIs and you, so our team got to work and pulled together a list of key performance indicators and free templates sorted by the department or industry.
Customer acquisition cost (CAC) measures the total expense incurred to acquire a new customer, including sales and marketing costs such as advertising, salaries, and software tools.
This metric helps businesses evaluate the efficiency of their customer acquisition strategy and determine profitability. A high CAC may indicate inefficiencies, while a low CAC suggests cost-effective growth.
CAC = Total Sales & Marketing Expenses/Number of New Customers Acquired
Example: If a company spends $50,000 on marketing and sales in a month and acquires 500 new customers, the CAC is $100.
Sales activities per rep track the total number of tasks a salesperson completes in a given period, such as calls, emails, meetings, and follow-ups. This KPI helps assess productivity and efficiency, ensuring that sales reps are engaging with enough prospects to meet revenue goals.
Sales Activities Per Rep=Total Sales Activities/Number of Sales Reps
Example: If a team of 5 sales reps makes 1,000 calls and sends 500 emails in a month, the sales activities per rep is 300.
This sales KPI measures the percentage of leads that turn into paying customers, helping businesses understand the effectiveness of their sales funnel.
A low conversion rate may indicate gaps in the sales process.
Lead to Client Conversion Rate=(Number of New Clients/Total Leads)×100
Example: If a business receives 2,000 leads in a month and 200 of them become customers, the lead to client conversion rate is 10%.
Total sales revenue is the total income generated from selling goods or services over a specific period. This KPI is crucial for assessing business growth and financial performance.
Total Sales Revenue= Price per Unit×Quantity Sold
Example: If a company sells 500 units of a product at $50 each, the total sales revenue is $25,000
Sales cycle length refers to the average time it takes to convert a lead into a customer, from the initial contact to the closing of the deal.
A shorter sales cycle typically indicates an efficient sales process, while a longer cycle may require process improvements.
Sales Cycle Length= Days to Close Deals/Total Number of Closed Deals
Example: If a company closed 10 deals in a month, taking a total of 600 days, the average sales cycle length is 60 days.
ARPU measures the average revenue generated from each customer over a specific period. It helps businesses assess profitability per customer and identify trends in customer spending.
ARPU=Total Revenue/Total Customers
Example: If a SaaS company earns $100,000 in revenue from 2,000 customers, the ARPU is $50 per customer.
CLV estimates the total revenue a business expects from a single customer over their entire relationship. This helps in budgeting for customer acquisition and retention.
CLV=Average Purchase Value×Purchase Frequency×Customer Lifespan
Example: If customers typically spend $200 per purchase, buy twice a year, and stay with the company for 5 years, the CLV is $2,000 per customer.
The churn rate measures the percentage of customers lost over a given time. A high churn rate may indicate dissatisfaction or better competitors.
Churn Rate=(Lost Customers/Total Customers at Start)×100
Example: If a subscription service starts with 1,000 customers and loses 50 in a month, the churn rate is 5%.
Overtime hours measure the total number of extra hours employees work beyond their scheduled hours. This KPI helps businesses track workload distribution, assess potential burnout, and evaluate staffing efficiency.
High overtime hours may indicate understaffing, while consistently low overtime could suggest optimized scheduling.
Overtime Hours= Total Hours Worked – Scheduled Hours
Example: If an employee is scheduled for 40 hours a week but works 50 hours, they have 10 overtime hours for the week.
This KPI tracks the number of new or improved operational processes within a given period. It helps measure efficiency improvements, innovation, and continuous optimization efforts within the organization.
A higher number of developed processes suggests proactive workflow enhancements.
Inventory costs represent the total expenses related to storing, managing, and maintaining unsold goods. This KPI is critical for optimizing inventory levels, reducing waste, and improving cash flow.
Inventory Costs=Storage Costs+Depreciation Costs+Insurance+Handling Costs
Example: If a company incurs $5,000 for storage, $1,500 for depreciation, and $500 for handling, the total inventory cost is $7,000.
This KPI measures the percentage of office space actively used by employees. It helps organizations optimize their workspace, reduce unnecessary costs, and improve workplace efficiency.
Office Space Utilization=(Occupied Space/Total Available Space)×100
Example: If an office has 10,000 square feet of space and 7,500 square feet are actively used, the office space utilization rate is 75%.
This KPI tracks the percentage of employee perks utilized, such as wellness programs, gym memberships, or learning stipends.
A high percentage indicates strong engagement, while a low percentage suggests perks may not be relevant or well-communicated.
Company Perks Usage=(Employees Using Perks/Total Employees)×100
Example: If 250 out of 500 employees use a company-sponsored gym membership, the usage rate is 50%.
This KPI tracks how many employees leave over a period. High turnover can indicate poor job satisfaction or weak retention strategies.
Turnover Rate=(Employees Who Left/Total Employees)×100
Example: If a company has 500 employees and 25 leave in a year, the employee turnover rate is 5%.
Order fulfillment time measures how long it takes from order placement to delivery. A shorter time indicates efficiency.
Order Fulfillment Time=Delivery Date−Order Date
Example: If an order was placed on January 1st and delivered on January 5th, the average order fulfillment time is 4 days.
FCR measures the percentage of customer service issues resolved in the first interaction, improving satisfaction.
FCR=(Issues Resolved on First Call/Total Issues)×100
Example: If a customer support team resolves 150 out of 200 cases on the first call, the first-call resolution rate is 75%.
17. Return on equity
Return on equity (ROE) measures a company’s profitability by showing how efficiently it generates profit using shareholders’ equity.
A higher ROE indicates strong financial performance, while a lower ROE may suggest inefficiency or excessive debt reliance.
ROE=(Net Income/Shareholder Equity)×100
Example: If a company has a net income of $500,000 and shareholder equity of $2,000,000, the return on equity is 25%.
Net profit margin shows the percentage of revenue that remains as profit after all expenses, including taxes and operating costs. A higher net profit margin indicates a company is effectively controlling costs.
Net Profit Margin=(Net Profit/Total Revenue)×100
Example: If a company has $1,000,000 in revenue and $200,000 in net profit, the net operating profit margin is 20%.
COGS represents the direct costs of producing goods or services, including raw materials and labor. It does not include indirect expenses like sales or marketing costs.
COGS=Beginning Inventory+Purchases−Ending Inventory
Example: If a company starts with $50,000 in inventory, purchases $30,000 in materials, and ends with $20,000 in inventory, the cost of goods sold is $60,000.
This ratio compares a company’s total liabilities to shareholder equity, showing how much debt is used to finance operations. A high ratio indicates higher financial risk.
Debt to Equity Ratio=Total Liabilities/Shareholder Equity
Example: If a company has $3,000,000 in total liabilities and $2,000,000 in shareholder equity, the company has $1.50 in debt for every $1 of equity. In other words, the debt-to-equity ratio is 1.5.
Free cash flow (FCF) represents the cash available after accounting for capital expenditures. It indicates a company’s ability to invest, expand, or return money to shareholders.
FCF=Operating Cash Flow−Capital Expenditures
Example: If a company generates $500,000 in operating cash flow and spends $200,000 on capital expenditures, the free cash flow is $300,000.
Gross profit margin shows how much revenue remains after covering direct production costs.
Gross Profit Margin=[(Revenue−COGS)/Revenue]×100
Example: If a company has revenue of $500,000 and COGS of $200,000, the gross profit margin is 60%.
This KPI tracks how quickly a company collects customer payments. A higher ratio means faster collections.
ART=Net Credit Sales/Average Accounts Receivable
Example: If net credit sales are $1,000,000 and the average accounts receivable is $250,000, the company collects its receivables 4 times a year.
The burn rate shows how quickly a company is spending cash before reaching profitability.
Burn Rate=[Cash Balance at Start−Cash Balance at End]/Number of Months
Example: If a startup has $500,000 in cash and spends down to $400,000 over 5 months, the burn rate is $20,000 per month.
Try ClickUp’s Accounts Payable Template
ROMI measures the profitability of marketing efforts, helping businesses evaluate which campaigns generate the highest return.
ROMI=(Revenue from Marketing−Marketing Cost)/Marketing Cost)×100
Example: If a campaign generates $50,000 in revenue from a $10,000 marketing spend, the ROMI is 400%.
Bounce rate refers to the percentage of emails that failed to reach recipients’ inboxes due to invalid addresses or full mailboxes.
Bounce Rate=(Bounced Emails/Total Emails Sent)×100
Example: If 50 emails bounce out of 1,000 sent, the bounce rate is 5%.
CTR measures the number of recipients who clicked a link within an email or ad compared to the total number who saw it.
CTR=(Clicks/Total Impressions or Emails Sent)×100
Example: If 200 people click a link in an email sent to 5,000 recipients, the CTR is 4%.
This KPI tracks how often content appears in users’ feeds without paid promotion.
Subscriber count tracks the number of people who have opted into an email list or service.
This KPI measures how actively customers interact with content.
Engagement Rate=[(Likes+Shares+Comments)/Total Followers]×100
Example: If a brand has 10,000 followers and gets 500 total interactions, the engagement rate is 5%.
CPL measures how much a company spends to acquire a lead.
CPL=Total Marketing Spend/Total Leads Generated
Example: If a campaign costs $5,000 and generates 250 leads, the CPL is $20 per lead.
This KPI tracks how many visitors complete a desired action (e.g., signing up or purchasing).
Conversion Rate=(Conversions/Total Visitors)×100
Example: If 200 people sign up from 5,000 visitors, the conversion rate is 4%.
Dive into more marketing KPIs and learn the best approach to set your goals!
33. Traffic to MQL (marketing qualified lead) ratio
This measures the effectiveness of website traffic in generating qualified leads.
Traffic to MQL Ratio=(Marketing Qualified Leads/Total Website Traffic)×100
Example: If a website gets 50,000 visitors and 500 MQLs, the traffic-to-MQL ratio is 1%.
Crawl errors indicate the number of URLs that search engines cannot access, affecting SEO.
This measures the percentage of visitors who leave a website without interacting further.
Bounce Rate=(Single-Page Visits/Total Visits)×100
This measures how fast a webpage loads.
Page Load Time=Total Load Time/Total Page Views
Example: If a website has a total load time of 300 seconds for 100 page views, the average page load time is 3 seconds.
The number of people who visit your website from your social media and other referring websites.
Also Read: Software development KPIs
This measures customer feedback on a design project or product.
Customer Satisfaction Rate=(Positive Responses/Total Responses)×100
This tracks how long it takes to complete a design project.
Production Cycle Time=End Date−Start Date
This KPI measures how many designs get approved without major revisions.
Approval Rate=(Approved Designs/Total Submitted Designs)×100
Example: If 80 out of 100 submitted designs are approved, the approval rate is 80%.
The average number of issues related to not following brand guidelines, processes, or procedures.
The average time it takes for project reviewers and project contributors to respond back to questions, comments, and requests.
The average number of rounds or time it takes to reach the final design.
Runway refers to the number of months a startup can operate before running out of cash, assuming no new revenue or funding. A longer runway gives the startup more time to achieve profitability or raise additional capital.
Runway=Monthly Burn Rate/Cash Balance
Example: If a startup has $300,000 in cash and spends $30,000 per month, it has a 10-month runway.
MRR tracks the predictable, subscription-based revenue a startup generates each month. This is crucial for SaaS and subscription-based businesses.
MRR=Total Number of Subscribers×Average Revenue Per User (ARPU)
Example: If a SaaS startup has 1,000 customers paying $50 per month, the MRR is $50,000.
The percentage of users who complete any major event in the onboarding process.
The amount of cash spent per month
The number indicates whether your users are ready to recommend your product to their friends, colleagues, etc.
Net promoter score=Total % of promoters – total % of detractors
This KPI measures how many users engage with a new product feature after its release.
Feature Adoption Rate=(Users Who Used the Feature/Total Users)×100
Example: If 5,000 out of 50,000 users try a new feature, the feature adoption rate is 10%.
Sprint velocity measures the average amount of work a development team completes in a sprint, helping estimate future workload capacity.
Sprint Velocity=Total Story Points Completed/Number of Sprints
Example: If a team completes 120 story points over 6 sprints, the average sprint velocity is 20 story points per sprint.
This KPI tracks how quickly reported software bugs are fixed.
Bug Resolution Time=Total Time Spent Fixing Bugs/Total Bugs Fixed
Example: If a team fixes 50 bugs in 500 hours, the average bug resolution time is 10 hours per bug.
This metric tracks the number of support requests following a new software release. A high number may indicate quality issues.
Support Tickets Per Release=Total Tickets Opened/Total Releases
Example: If 300 tickets were opened after 5 product releases, there are 60 support tickets per release.
The number of tickets moved to a higher-level Customer Support Manager to resolve.
The scale rate of a customer’s overall experience with a company’s product, service, or employee.
55. Net Promoter Score (NPS): The number indicating whether your users are ready to recommend your product to their friends, colleagues, etc.
56. Month Over Month (MoM) Monthly Recurring Revenue (MRR) Growth Rate: The percentage increase or decrease month over month in net MRR
57. Annual Recurring Revenue (ARR): The predicted amount of yearly revenue earned from existing customers
58. Churn Rate: The percentage rate at which customers leave a business over a given period of time
59. Processes Developed: The number of improvements made to current operational processes
60. Lead Velocity Rate: The total number of manual and automated tests performed
This measures the percentage of employees leaving the company within a specific period. A high turnover rate can indicate issues with workplace culture, management, or compensation.
Turnover Rate=(Employees Who Left/Total Employees)×100
Example: If a company has 500 employees and 25 leave in a year, the turnover rate is 5%.
Time to fill tracks the number of days it takes to hire a new employee from job posting to offer acceptance. A longer time to fill may indicate inefficiencies in the hiring process.
Time to Fill=Total Days to Hire All Employees/Total Positions Filled
Example: If a company fills 10 positions, taking a total of 300 days, the average time to fill is 30 days per hire.
This KPI measures how well employees retain and apply new skills after training sessions.
Training Effectiveness=(Post-Training Performance Score/Pre-Training Performance Score)×100
Example: If employees score 60% before training and 90% after, the training effectiveness improved by 150%.
The absenteeism rate measures the percentage of unplanned absences in the workforce. High absenteeism may indicate employee dissatisfaction or burnout.
Absenteeism Rate=(Total Unplanned Absences/Total Workdays Available)×100
Example: If employees miss 200 workdays out of 10,000 total workdays, the absenteeism rate is 2%.
The percentage of applicants who were hired vs. total number of applicants you processed (track with ATS!)
The total cost of hiring each employee (including hiring, training, or onboarding costs and other HR KPIs).
The amount of money spent on employee training and development
Get more templates for all your work tasks from our Templates Center!
Once you’ve collected and measured your data, you’ll need to present them in an easy-to-understand format. This is where an all-in-one solution like ClickUp comes in to provide the best visualization tools!
Also Read: Top Customer Experience KPIs & Metrics to Track
KPIs are essential in the workplace because they:
Before you can track key performance indicators, you have to know how to write strong, impactful KPIs. This is a vital skill that, when mastered, can significantly improve your overall business strategy. Here’s how to create a KPI that genuinely measures your team’s effectiveness and efficiency.
Before you can measure business performance, you must know what you’re aiming for. Start by clearly defining your business objectives.
These may vary depending on your business, but common objectives include increasing sales, achieving financial stability, improving customer and employee satisfaction, fostering employee engagement, or enhancing product quality.
Not every aspect of your business needs a KPI. Thus, the next step is to identify your business’s vital areas which impact the success of your objectives.
For instance, if your objective includes financial stability, then the financial department might be a critical area to keep an eye on.
Now that you know your objectives and the essential areas, it’s time to choose an appropriate key performance indicator. A good KPI should be quantifiable, directly tied to your key business objectives, and critical to your organization’s success.
Choose indicators that give a broad overview while still highlighting the details necessary for making smart decisions.
An effective KPI is a quantifiable measure and easy to track. After all, you can’t manage what you can’t measure. Stick to a limited number of clear and specific metrics that give a direct indication of your performance.
Including a clear timeframe is essential for gaining an accurate reading of your performance. For instance, note down whether your targets are expected to be achieved within a quarter, six months, or an entire fiscal year.
Remember that KPIs are not static. They are dynamic and must be reviewed periodically to ensure their relevance to the evolving business environment.
Continuous review also helps identify if the KPIs are being met and if any adjustments need to be made.
Lastly, communicate your KPIs to your team members so everyone is on the same page and working towards the same goals. Well-defined KPIs are typically simple, understandable, and attainable.
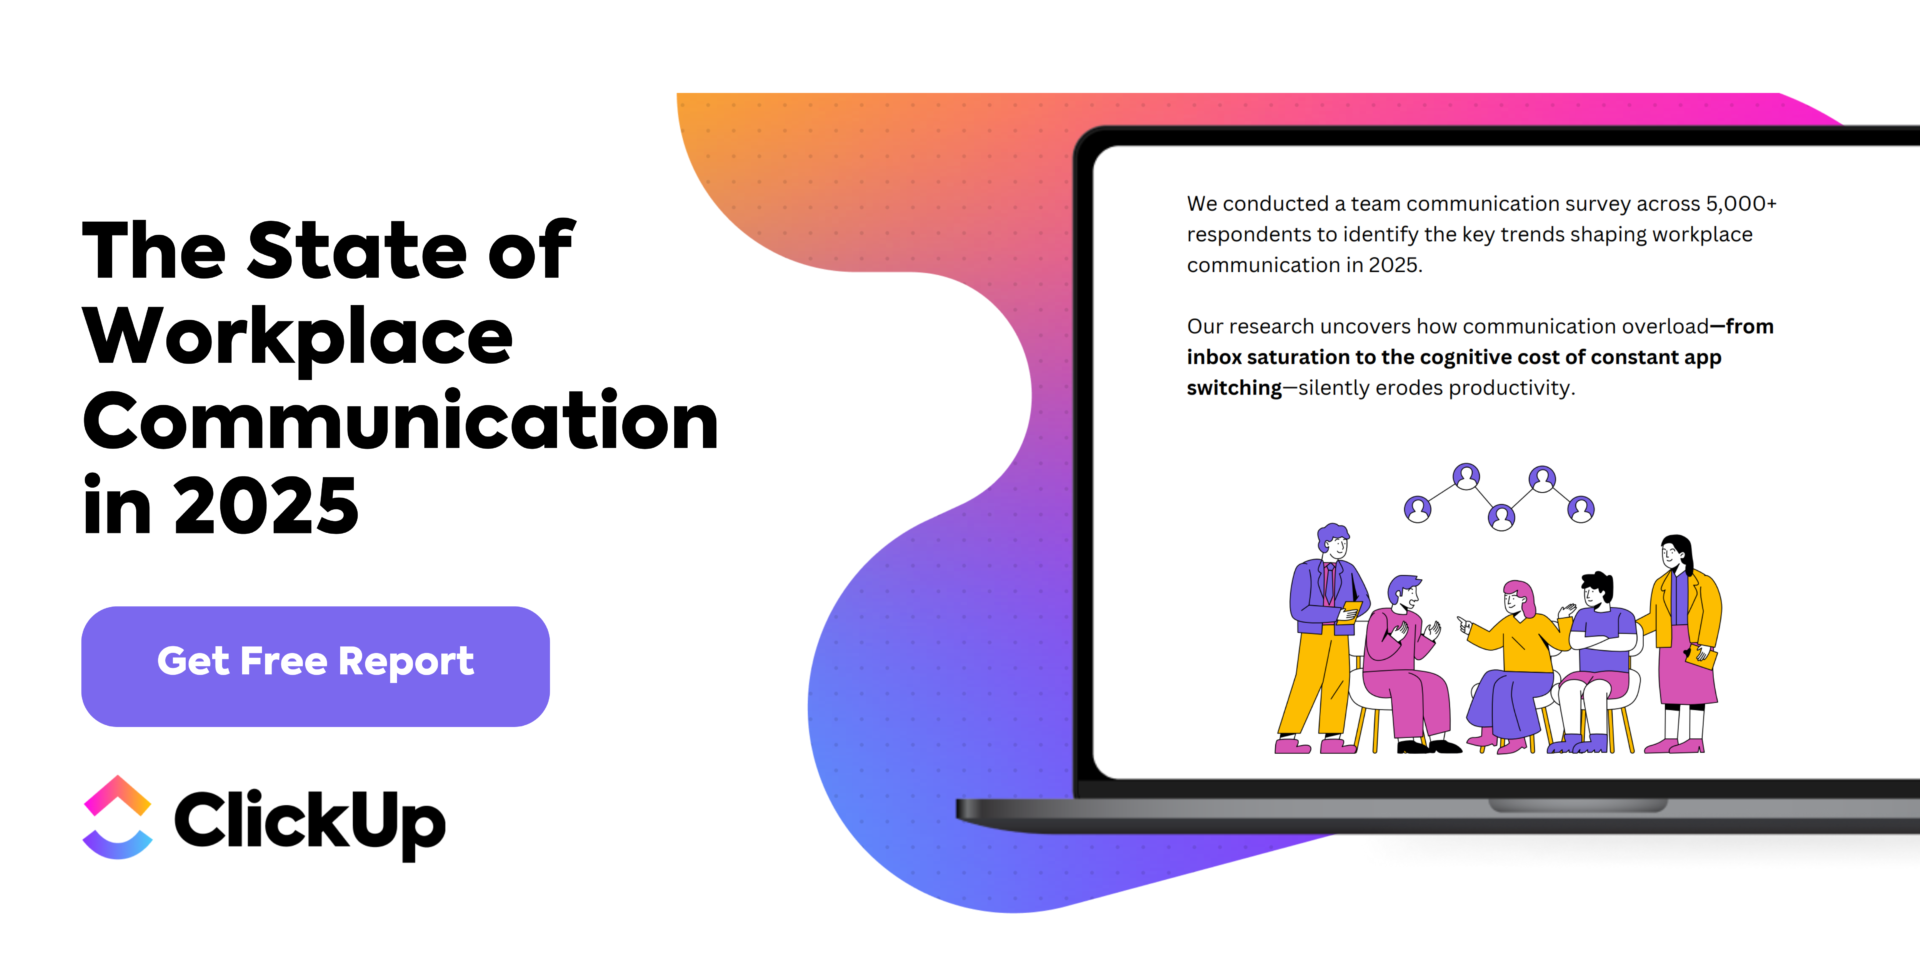
📮ClickUp Insight: 83% of workers rely primarily on email and chat for team communication.
According to research by ClickUp, fragmented communication, involving scattered messages across multiple channels, hinders productivity.
📥 Download The State of Workplace Communication Report by ClickUp to uncover more insights—and what you can do to close the gaps.
Keep in mind that writing KPIs is more of an art than a science. You would need to keep adjusting and defining them until you find the format that best suits your needs.
Need help? We’ve got you. ClickUp’s KPI template makes it easy to set, track, and visualize key performance indicators that are crucial for business success.
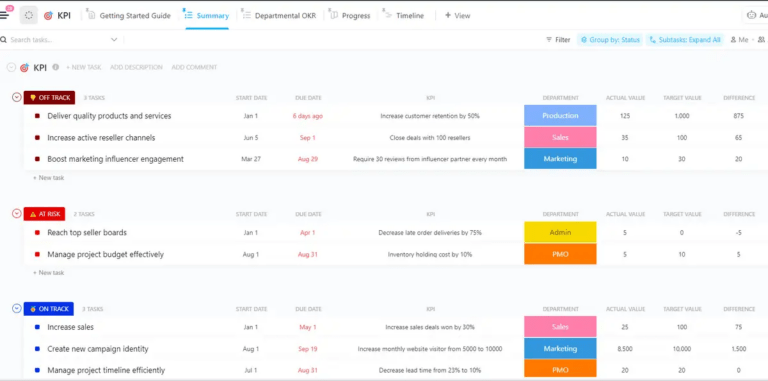
The Departmental OKR View will help you keep track of objectives and key results across departments, while the Progress View will provide an in-depth overview of progress on each individual KPI.
Use the Timeline View to plot out milestones and keep track of deadlines.
With your key performance indicators and templates ready to track, the next step is to compile them into a digital solution like ClickUp!
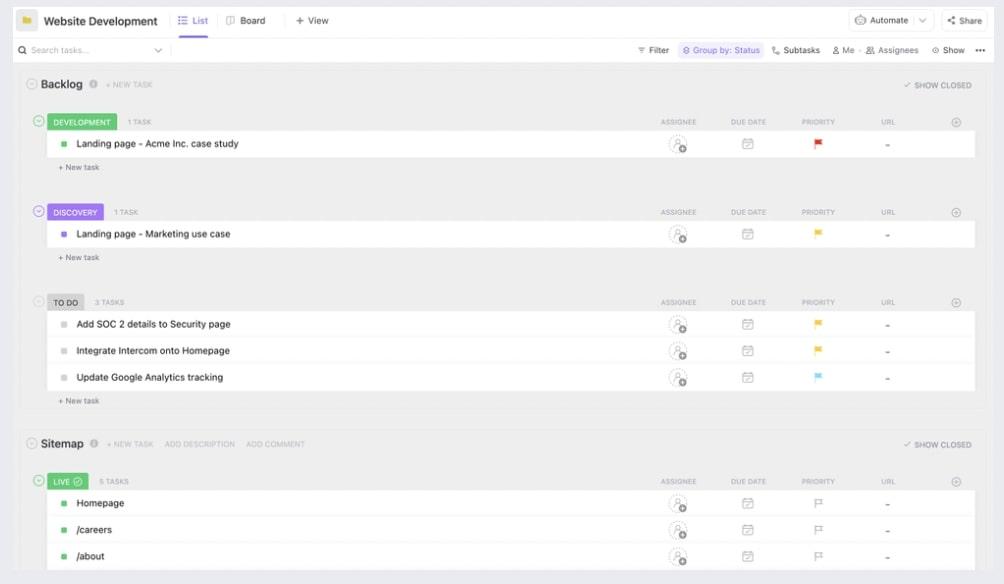
ClickUp is an all-in-one productivity platform where teams come together to plan, organize, and collaborate on work using tasks, Docs, Chat, Goals, Whiteboards, and more. Easily customized with just a few clicks, ClickUp lets teams of all types and sizes deliver work more effectively, boosting productivity to new heights!
Here’s a closer look at why teams love using ClickUp as their goal-tracking hub and KPI analysis dashboard:
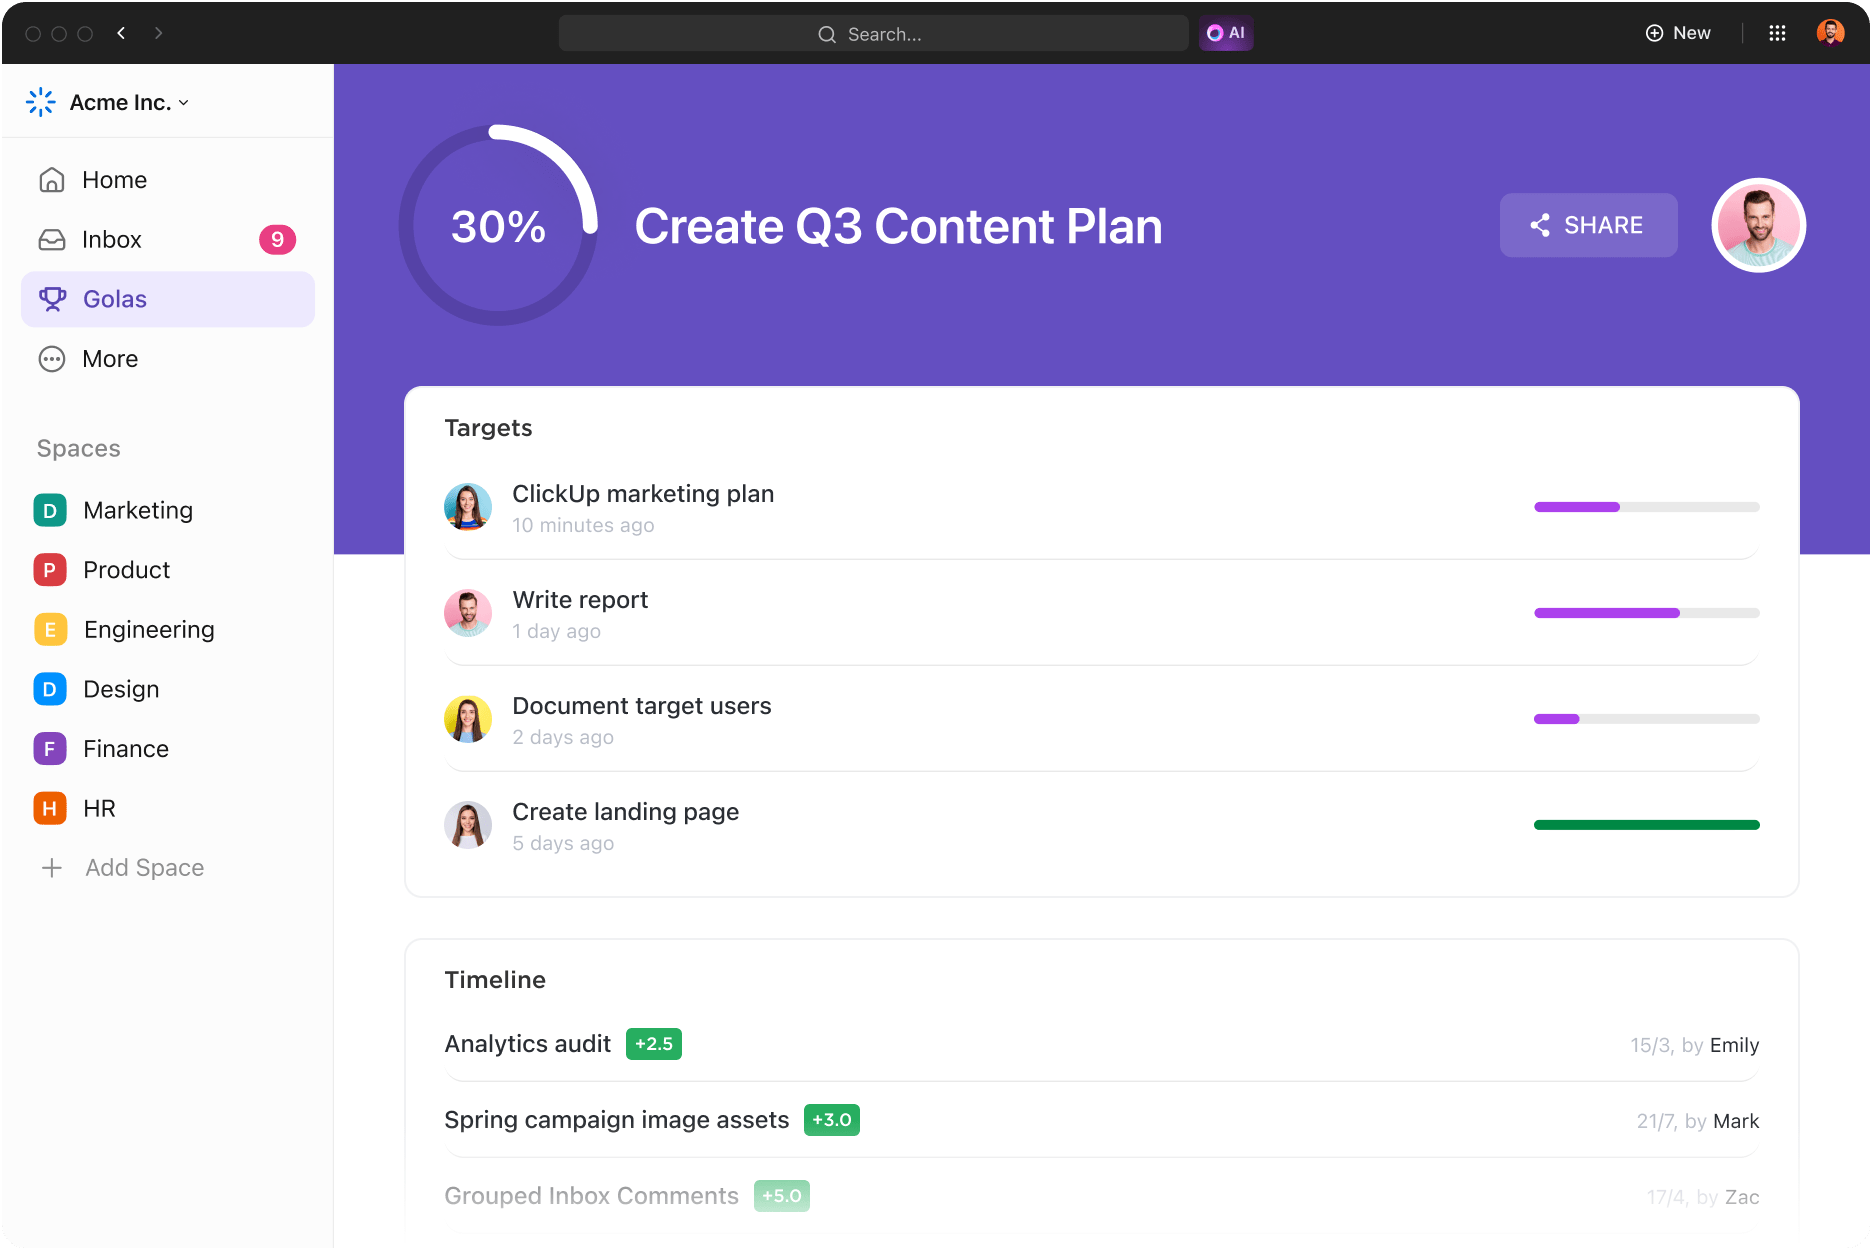
Goals in ClickUp are high-level containers broken into smaller Targets. Once you take action on a Target, click the Target name to update your progress. Depending on which type you use, your Target will have different tracking options:
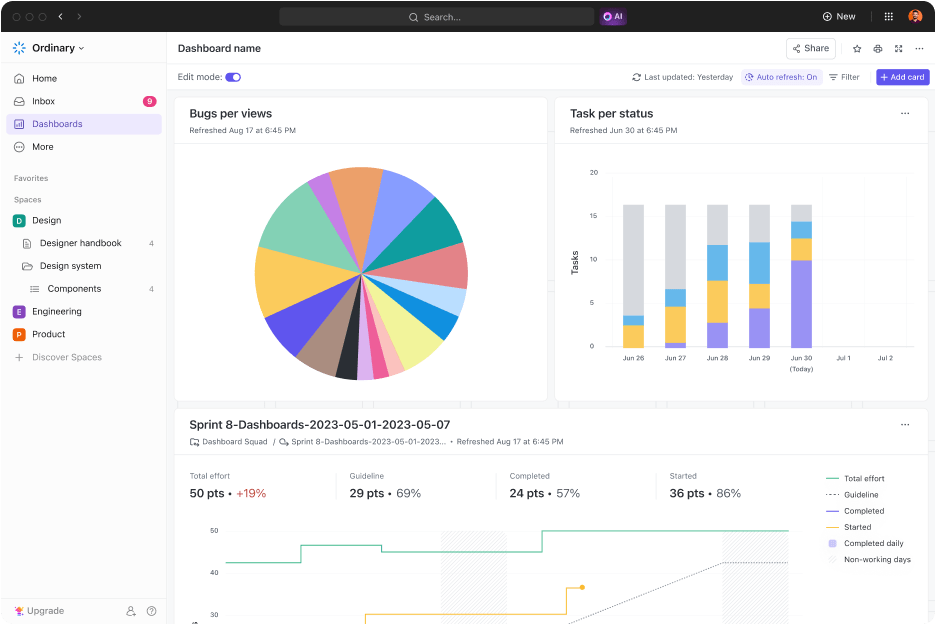
Dashboards in ClickUp will replace the weekly reports piling up in your manager’s inbox. Build, display, and interact from a single source of truth with all the KPIs front and center.
And you don’t need to be a data scientist or graphic designer to create Dashboards in ClickUp! With a drag-and-drop action, you can organize your Dashboards to visualize how work is happening in your Workspace in any way you want.
Where is the team meeting, exceeding, or not making progress on KPIs? With KPI software, KPI timelines and reporting exist in a centralized location, so anyone can quickly retrieve the data and understand where they are and where they need to be.
It’s easy to get lost in the data for hours to generate a one-page KPI report. That’s the old way of productivity.
The right KPI software will simplify the reporting process and give you more time to focus on strategic discussions and activities.
Keep riding the growth wave, and if you need a fail-proof navigation tool, ClickUp’s got your back!
Sign up for a free ClickUp account today.
KPIs help define clear and measurable criteria for success, allowing teams to work towards specific goals while continuously measuring their progress. This provides teams with a sense of direction, focus and purpose, which can lead to increased engagement and motivation.
The selection of appropriate KPIs will depend on the team’s purpose, goals and objectives. While there is no one-size-fits-all approach, a team can identify KPIs by considering their goals and objectives, analyzing past performance, and considering external factors that may impact their overall performance.
If your team is not meeting KPI targets, you should first try to identify the root cause of the issue. This may involve providing additional training, resources, and support to members of the team. Additionally, you should review and revise the KPIs to make sure they are achievable, relevant, and realistic.

© 2026 ClickUp

There’s an easier way. Try a free AI Agent in ClickUp that actually does the work for you—set up in minutes, save hours every week.