Sorry, there were no results found for “”
Sorry, there were no results found for “”
Sorry, there were no results found for “”
Numbers tell stories. And in product management strategies, those stories guide billion-dollar decisions.
But here’s the thing: Most product teams drown in data without knowing which metrics matter.
The challenge? Finding the signal through the noise. Many teams struggle to identify which KPIs truly matter for their products.
That’s because, in a product manager’s day-to-day life, tracking the right product OKRs isn’t just about collecting numbers—it’s about measuring what moves the needle.
In this blog post, you’ll find 15+ essential KPIs that can help you spot growth opportunities, catch issues early, and make smarter product decisions.
Product management frameworks and KPIs, help you measure what matters, from user engagement to revenue impact.
Think of KPIs as your product’s health indicators. Just as a doctor checks vital signs, you track these metrics to spot issues early and make smart decisions about your product’s future. These measurements guide your product goals and keep teams focused on real results.
Product KPIs typically fall into four key buckets:
Many teams face common product management challenges, such as measuring too many metrics or focusing on vanity numbers that look good but don’t drive business growth.
🧠 Fun Fact: Key Performance Indicators (KPIs) were conceptualized in the 20th century by Frederick Taylor who used data to track how well companies were meeting goals. He did this to make factories and other businesses work better and produce more.
The most successful product managers base their strategies on hard data using product management tools, not hunches.
Here’s a deep dive into the essential product management KPIs to help you measure and improve your product’s performance.
Your product’s financial health needs constant monitoring. These business performance KPIs give you the complete picture.
These metrics are essential for the product management process. They provide insight into a product’s financial health by analyzing income streams and profit margins, allowing businesses to track performance and make informed decisions.
Here’s a breakdown of key revenue metrics that fall under this category:
This is the total income your product generates from sales before deducting any expenses. It shows your product’s earning power and is often the starting point for analyzing financial performance.
📌 Example: If you sell 1,000 units at $50 each, your gross revenue is $50,000.
This is what remains after deducting operating costs, such as refunds, discounts, or returns, from the gross revenue. Net revenue provides a clearer picture of what you’re earning after adjustments.
📌 Example: if your gross revenue is $50,000 and operating costs are $10,000, your net revenue is $40,000.
The percentage of revenue left after accounting for the direct production costs of your product.
The formula for calculating Gross Margin:
Gross Margin % = (Gross Revenue−Production Costs/Gross Revenue) x 100
It reflects how efficiently you manage production costs relative to revenue.
💡Pro Tip: To improve your gross margin, negotiate better supplier deals, optimize production, and eliminate waste. If possible, adjust pricing based on perceived value rather than just cost—premium brands always do this!
The percentage of revenue represents actual profit after accounting for all expenses, including taxes and overhead costs.
The formula for calculating Net Margin:
Net Margin % = (Net Revenue/Gross Revenue) × 100
It’s the ultimate measure of profitability, showing how much of your revenue turns into profit.
📖 Also Read: Product Strategy Templates for Product Teams
Revenue and growth KPIs are key performance indicators that track the financial trajectory of your product.
These metrics help you understand your income stream, the value each customer brings, and how much revenue you generate per user. Let’s break down each of these key metrics with examples:
Monthly Recurring Revenue (MRR) measures the predictable income you can expect each month from your subscription-based customers.
It’s a critical metric for businesses with a subscription model, as it helps forecast future income and financial stability.
📌 Example: if you have 100 customers, each on a $50 monthly plan, your MRR is 100×50=$5,000. This indicates that you can rely on $5,000 each month from these customers.
Customer Lifetime Value (CLV) represents the total revenue a customer can expect over their entire relationship with your business. It helps companies to determine how much they should invest in acquiring and retaining customers.
The formula for CLV is CLV=Average Monthly Revenue×Average Customer Lifetime (in months)
📌 Example: if a customer pays $100 per month and stays with you for 2 years (24 months), the CLV would be: 100×24=2,400
So, the CLV for this customer is $2,400.
This tells you how much you can expect to earn from that customer over the course of their entire relationship with your business.
👀 Did You Know? Loyal customers not only stay longer but often become your best marketers through word-of-mouth! Companies that excel at personalization generate 40% more revenue than average players.
Average Revenue Per User (ARPU) measures the average revenue generated per user or customer during a specific period (usually a month).
The formula is, ARPU = Total Revenue/Total Number of Users
For example, if you have 1,000 users generating $50,000 in revenue monthly, the ARPU would be: 50,000/1,000 = $50.
On average, each user contributes $50 to your monthly revenue.
Acquisition KPIs are crucial metrics that help you measure how effectively you’re growing your user base, from attracting new customers to converting existing customers into paying ones.
Customer Acquisition Cost (CAC) is the amount you spend on marketing and sales to acquire each new customer.
It’s an essential metric for understanding how cost-efficient your customer acquisition efforts are.
The formula for calculating CAC is, CAC =Total Marketing and Sales Spend / Number of New Customers Acquired
So if you spent $10,000 on marketing campaigns in a month and gained 100 new customers, your CAC would be: 10,000/100=100
CAC = $100
This means it costs $100 to acquire each new customer. Monitoring your CAC ensures that your marketing spend is sustainable and delivers a good return on investment (ROI).
💡Pro Tip: To lower your Customer Acquisition Cost (CAC), focus on optimizing organic channels like SEO and content marketing, leveraging customer referrals, and improving retention. A satisfied customer who stays longer and spreads the word reduces the pressure on paid acquisition efforts while maximizing ROI.
Conversion rate measures the percentage of visitors who take a desired action, such as signing up, purchasing a product, or subscribing to a service.
It’s a critical indicator of your marketing and sales funnel effectiveness.
Formula: Conversion Rate (%) = (Number of Conversions/Total Visitors) × 100
If your product page receives 1,000 visitors and 50 subscribers, your conversion rate is: (50/1,000)×100. So the conversion rate = 5%
5% of your visitors became paying customers.
Improving your conversion rate often involves optimizing your product page, offering better incentives, or streamlining the user experience.
Discussing the importance of product instrumentation, gathering the right customer feedback, and using this data to inform critical product decisions on a podcast, McKinsey On Building Products, Trisha Price, Chief Product Officer of Pendo.io, notes:
Remember Google Glass and the fanfare and excitement attached to its launch? There was a lot of news and hype around it, but it ultimately failed because very few people bought or used it. It goes to show that applause and fanfare are not the right measures of a successful product. You need to measure the value that your product is delivering to customers and users.
Happy customers are the foundation of a successful business—they stay loyal, spend more, and spread the word. To ensure your customers are satisfied, you need to measure their experiences. Here’s how you can do it:
Ask, ‘On a scale of 1-5, how satisfied are you with our product?’. A higher score means they’re loving it!
This measures customer loyalty by asking, ‘How likely are you to recommend us to a friend?’. Scores range from -100 to +100, with higher being better.
Here, you’re finding out how easy your product is to use by asking, ‘How much effort did it take to get this done?’. The lower the score, the smoother the experience.
These KPIs give you actionable insights into customer behavior.
Engagement KPIs help you understand how people use your product. It’s like checking if they’re just stopping by or getting involved. Here’s how you can track it:
Monitor your Daily Active Users (DAUs) and Monthly Active Users (MAUs). These numbers reveal how often people are engaging with your product.
For instance, if you have 1,000 MAUs but only 100 DAUs, it’s a sign people aren’t coming back daily. That’s your cue to figure out ways to boost daily engagement—maybe through notifications, fresh content, or new features.
Dive deeper into how people are using your product. Metrics like session duration (how long they stick around) and feature usage (which parts of the product they use most) are gold mines of insight.
For example, if a particular feature gets tons of use, double down on improving or expanding it. On the flip side, if a feature isn’t being touched, you may need to rethink or promote it better.
🧠 Fun Fact: Ever clicked repeatedly on something that wasn’t working? That’s called a rage click; behavior analytics tools track them to identify frustrating UX issues. If users are rage-clicking, something’s broken—or they think it is!
Retention KPIs tell you how well you’re holding onto your users—it’s all about their staying power. Here’s what to focus on:
Your customer retention rate shows how many people stick with you over time.
For example, if you start with 100 users and 90 of them are still with you after a month, that’s a 90% retention rate—pretty solid!
The goal is to keep this number high, meaning your users see value in what you offer and keep returning.
Want to keep those users happy? Listen to them! Regularly gather feedback through surveys or user interviews.
This helps you spot issues early and find areas for improvement. Whether you’re fixing a pain point or adding a feature users crave, these insights allow you keep users engaged and loyal.
👀 Did You Know? User Feedback = Product Goldmine! A survey of 1,200+ product pros revealed a significant shift—companies are doubling down on user research to fine-tune their software. The takeaway? You’re building in the dark if you’re not listening to real user input!
Here’s what matters when choosing your KPIs:
📖 Also Read: Free Product Management Templates
92% of knowledge workers risk losing critical decisions due to scattered docs, while only 8% use project management tools. This is a clear call for product managers: organize, centralize, and track. Great products start with great execution!
ClickUp, the everything app for work, combines project management, knowledge management, and chat—all powered by AI to help you work faster and smarter.
A ClickUp user, Kellock Irvin, Product Manager at EDF Renewables quotes:
As someone leading product, it’s my job to protect our engineers’ time and ensure they know not just about what we’re working on now, but also our future obligations—ClickUp helps me do that. ClickUp helps me stay out of “chaos” mode. We can now be as proactive as possible about the projects we’re working on.
When managing products, keeping tabs on your KPIs shouldn’t feel like juggling flaming torches.
Here’s how you can set up ClickUp for Product Teams:
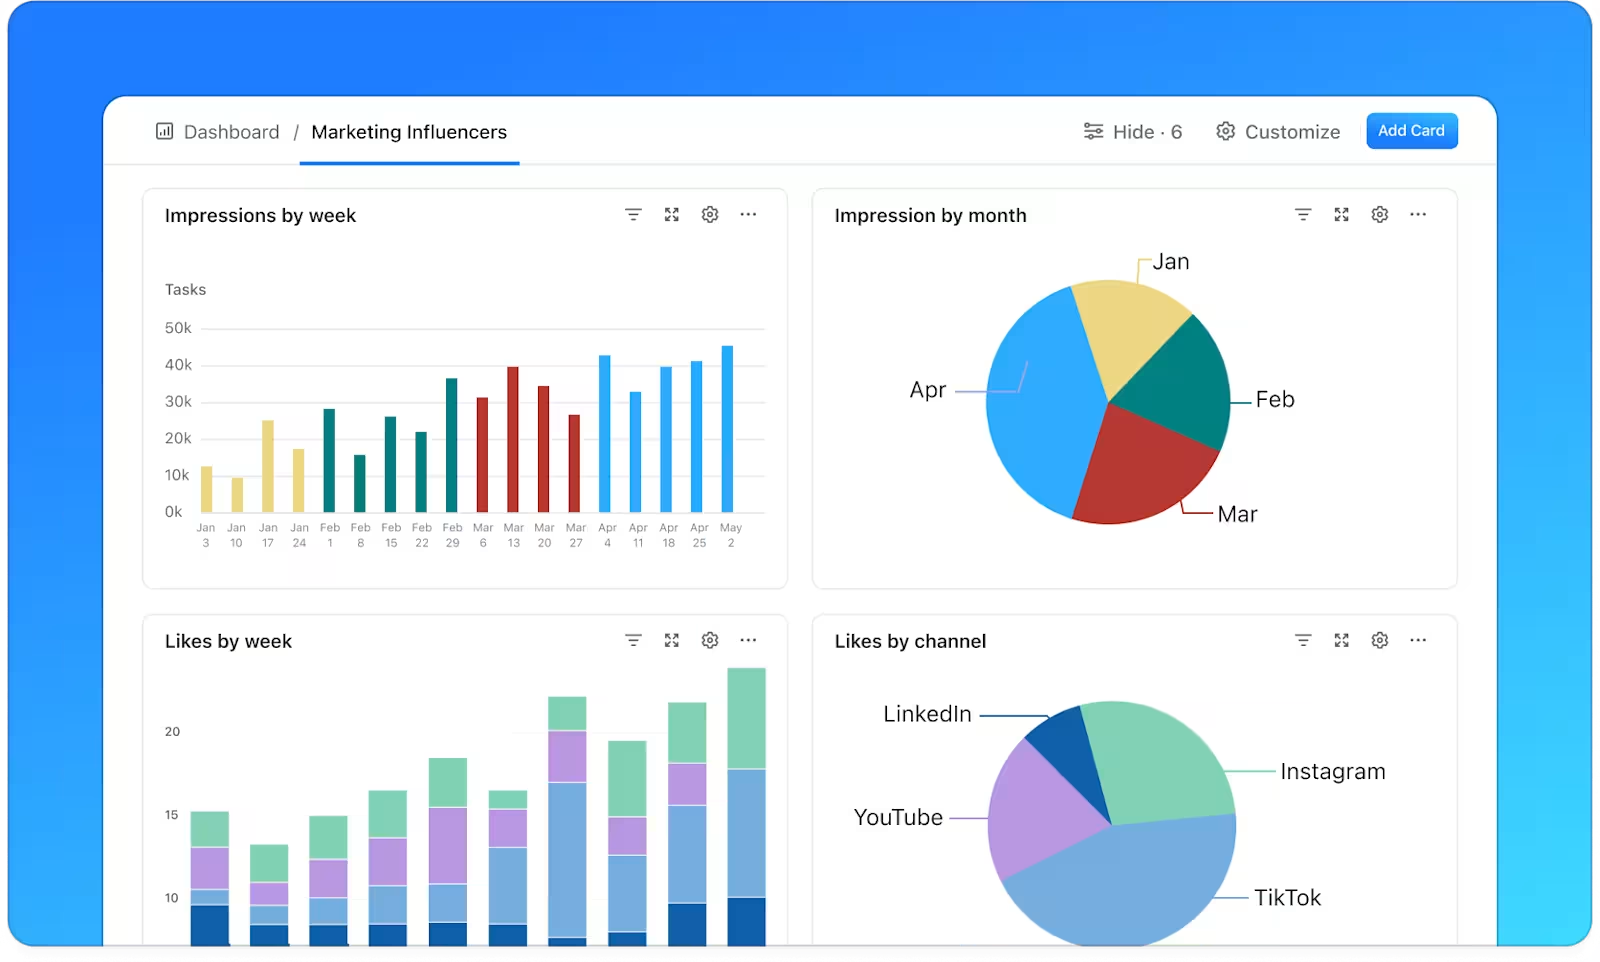
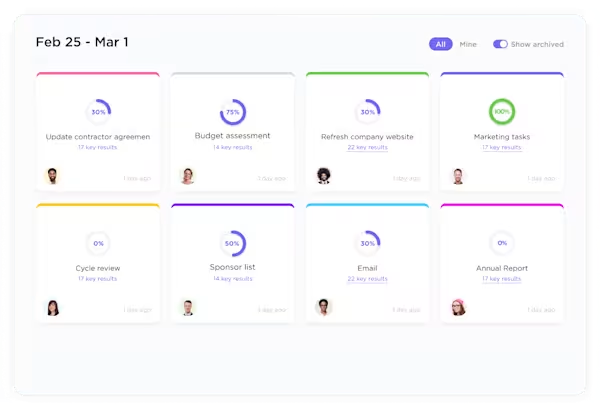
ClickUp Dashboards bring all your product metrics into a single view, making it simple to spot issues and opportunities.
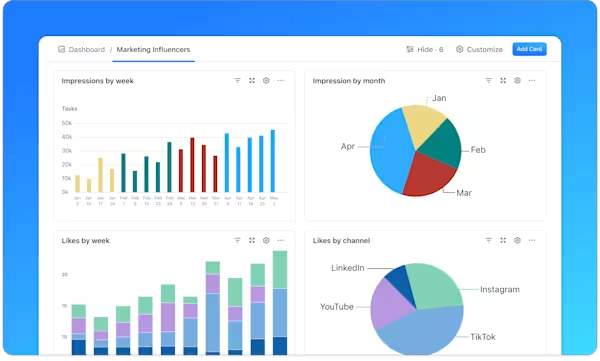
Dashboards also become your single source of truth, centralizing essential information in one place. They pull in data from multiple sources and display it exactly how you need it.
Using pie chart widgets, you can visualize the status of all sprint tasks at a glance. This helps identify bottlenecks early and keep development on schedule.
Want to turn abstract product management targets into measurable wins? ClickUp Goals helps you break down big objectives into bite-sized targets and track real-time progress.
Create your main objective in ClickUp Goals, then split it into smaller weekly targets. For that 25% adoption goal, you might set:
Each target gets its tracking method—numbers, true/false checkboxes, or task completion. As your team completes activities, ClickUp automatically updates the progress.
📮ClickUp Insight: 92% of workers use inconsistent methods to track action items, which results in missed decisions and delayed execution.
Whether sending follow-up notes or using spreadsheets, the process is often scattered and inefficient. ClickUp Goals ensures seamless conversion of conversations into trackable goals—so your team can act fast and stay aligned.
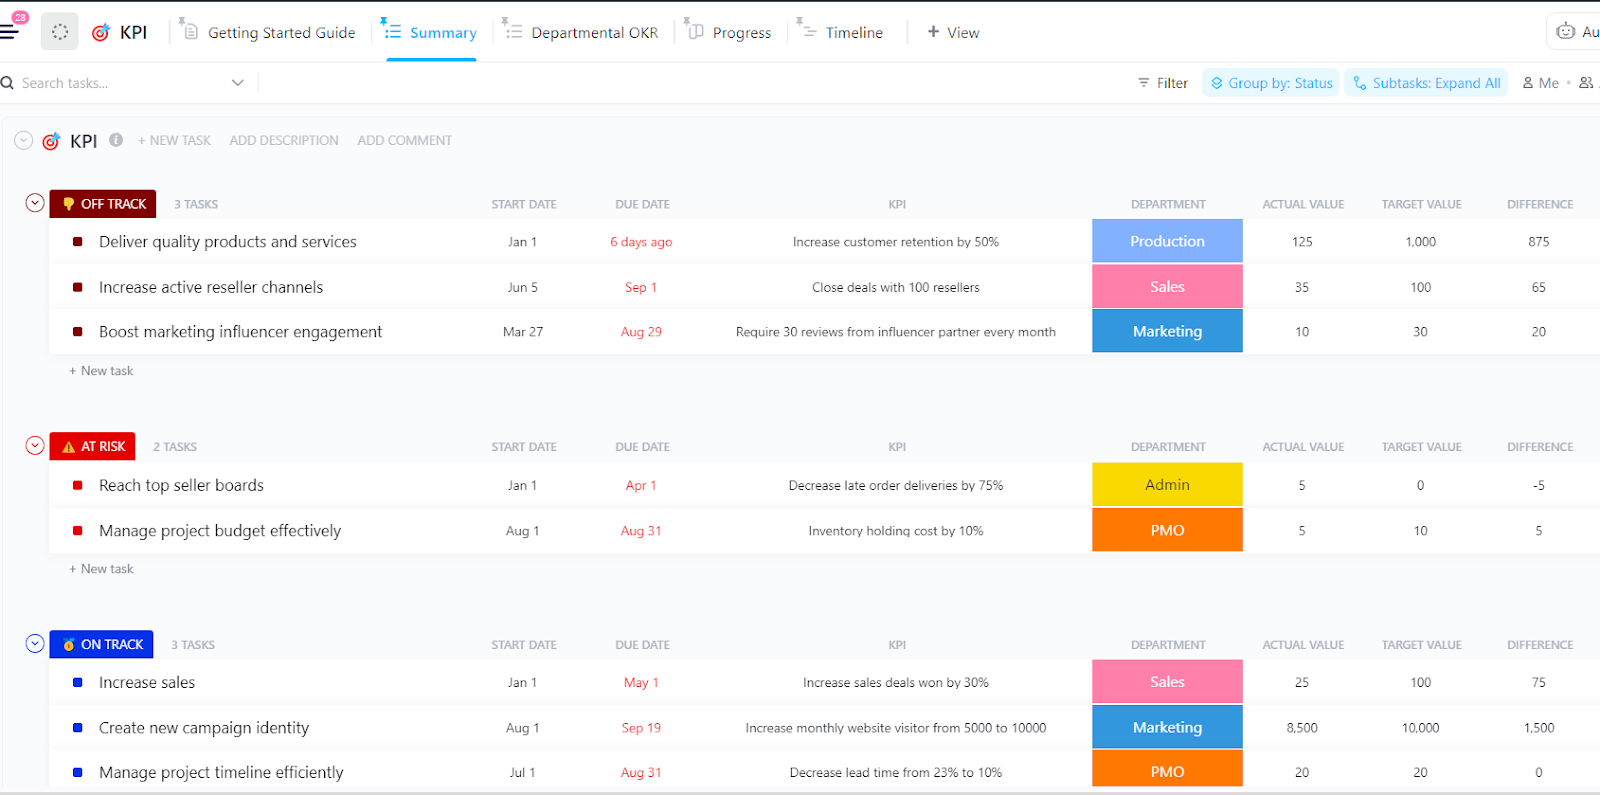
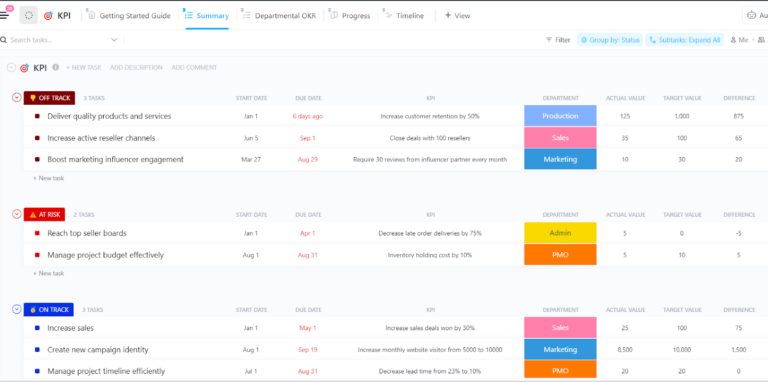
Want to get started? The ClickUp KPI Template provides a pre-built framework for tracking your most important metrics.
Leverage this template’s detailed reports to:
Say goodbye to manual report pulling! ClickUp Automations helps product teams monitor their KPIs through smart, hands-free reporting.
Set up automated weekly KPI reports to keep everyone informed about project progress.
Add Custom Fields like ‘Progress,’ ‘Department,’ ‘Target Value,’ and ‘Actual Value’ to track your metrics. Then use Custom Views—Summary view, Departmental OKR view, Progress view, and Timeline view—to see your KPIs from different angles.
ClickUp integrations bring your favorite analytics tools into your workspace.
Pull data from Mixpanel and Google Analytics to create custom charts showing actual user behavior and product performance.
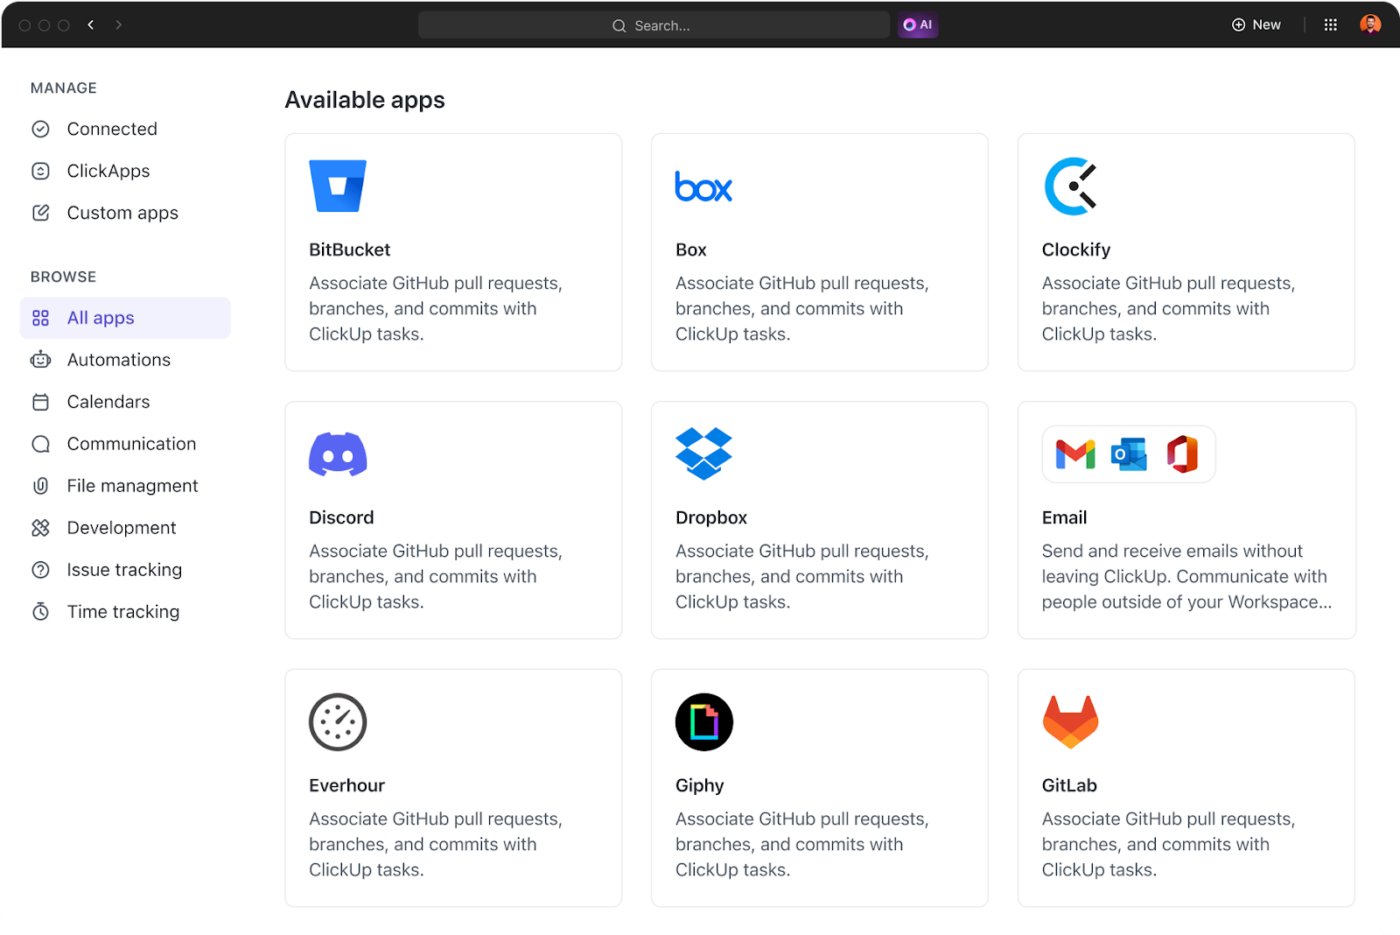
Link pull requests, commits, and branches to specific tasks, keeping everyone aligned. All
GitHub activity shows up in your ClickUp Tasks, so you know exactly what’s happening with each feature or fix.
Product managers know the drill—endless meetings, countless tasks to track, and a mountain of data to process. That’s where ClickUp Brain steps in to handle the routine stuff while you focus on strategy.
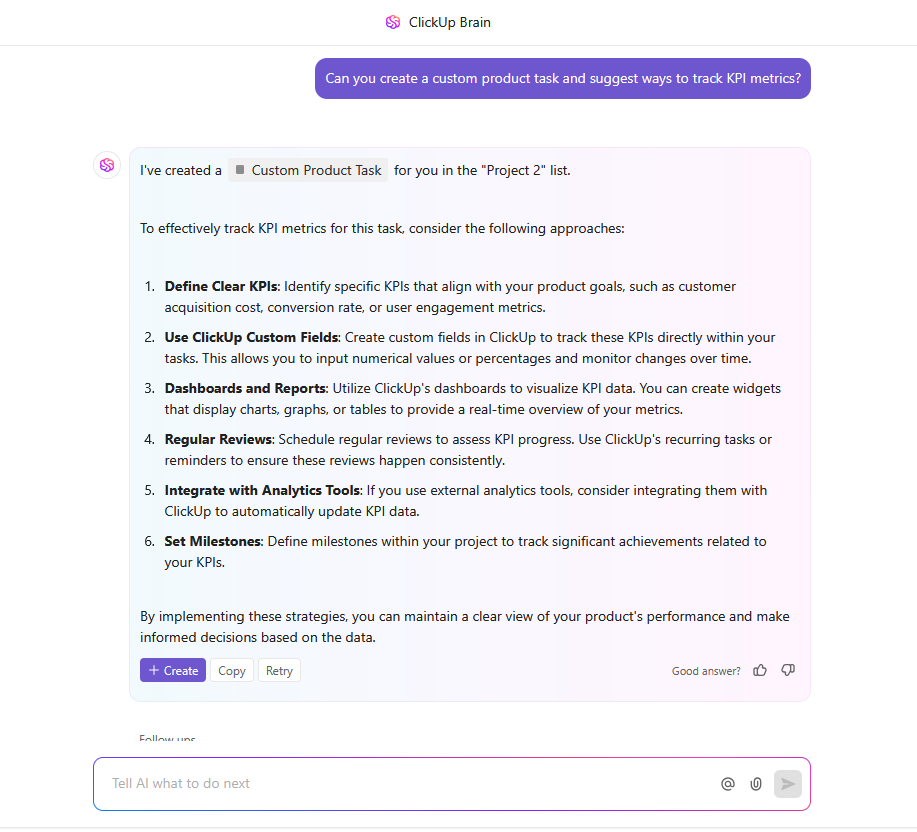
After product planning sessions, Brain turns discussion points into clear next steps. For example, when your team brainstorms new feature ideas, Brain can:
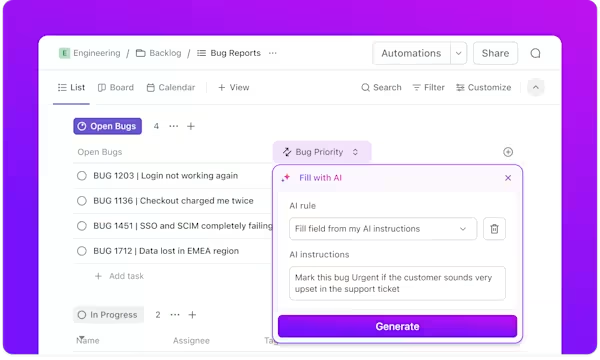
Brain’s auto-fill capabilities go beyond basic form-filling. When updating product specs or user stories, it can pull relevant data from similar past projects, suggest appropriate tags and categories, and auto-populate custom fields based on task context.
Here are the key hurdles product teams face when measuring KPIs, along with practical solutions to overcome them:
Poor data quality can skew your metrics and lead to wrong decisions. Product teams often struggle with:
To fix this, clear data validation processes should be set up, and automated data collection should be used where possible. Regular data audits help catch and resolve issues early.
Many teams get caught up tracking vanity numbers that look good but don’t show real product success, such as:
Focus on metrics tied to business goals. For example, measure the number of users who complete key actions that show they’re getting value from your product.
Without proper benchmarks, teams end up with unrealistic KPI goals:
Set your targets based on past data and involve stakeholders when setting goals. This helps create achievable targets that are aligned with business objectives.
Numbers tell stories—and your product’s story depends on how well you read them. By tracking these essential KPIs, you’re not just collecting data points.
You’re gaining a clear view of what your users need, what they love, and what needs fixing.
But remember: these metrics aren’t just checkboxes on your to-do list. They’re signals that guide smart choices.
The best product teams don’t just measure—they act. With ClickUp’s comprehensive features, you can spot trends early, test solutions quickly, and improve based on real user needs. That’s how great products are built: one data-backed decision at a time.
Ready to turn your product data into winning strategies? Sign up on ClickUp today!

Manasi Nair
Max 18min read

Praburam Srinivasan
Max 21min read
Praburam Srinivasan
Max 17min read

© 2026 ClickUp