In the early 2000s, Wells Fargo set a KPI that every retail employee learned by heart: eight accounts per customer. The number had a catchy internal slogan (‘Eight is great’) and a clear business logic: more accounts meant deeper customer relationships, higher lifetime value, and more cross-sell revenue. It was, at least on paper, a perfectly designed KPI.
Then, employees started opening accounts that customers had never asked for. Millions of them. By the time regulators were done, Wells Fargo had paid more than $3 billion in fines, fired 5,300 employees, and lost a CEO.
The KPI worked exactly as designed. And that was the problem.
When employees know exactly what’s expected of them at work, organizations see a 10% increase in productivity. That is why KPIs matter. But knowing that KPIs matter is not the same as knowing exactly which ones to track. Below, you’ll find 100+ KPI examples organized by department. Use them as a starter pack to manage what you track and why.
KPIs or Key Performance Indicators are goal-linked measures that tell you whether your team is actually moving the needle, or just busy. KPIs can be applied to every industry, company, department, or individual.
On the revenue side, sales and marketing leaders lean on MRR, pipeline velocity, win rate, CAC, ROAS, and marketing-sourced pipeline to see what’s converting and what’s leaking
Finance teams watch gross and net margin, EBITDA, burn rate, runway, and budget variance to keep the business healthy and fundable
Customer experience lives or dies by CSAT, NPS, first response time, churn, and retention, the metrics that quietly predict revenue six months out
For Operations teams, you’ll see how on-time delivery, cycle time, defect rate, and milestone completion expose the bottlenecks slowing delivery
HR, engineering, and IT get their own playbook too: turnover, eNPS, time to hire, deployment frequency, MTTR, uptime, and bug escape rate. These represent the signals that tell you whether your people and systems can scale
The key to setting and managing effective KPIs is how you pick them: first, tie every KPI to a business goal, run it through the SMART framework, balance leading and lagging indicators, give it an owner, and then review it regularly.
Track fewer things and track them well, so your KPIs stop being a dashboard and start becoming a decision-making tool.
Summarize this article with AI ClickUp Brain not only saves you precious time by instantly summarizing articles, it also leverages AI to connect your tasks, docs, people, and more, streamlining your workflow like never before.
Summarize this article for me please
What Is a KPI (and How Does It Differ from a Metric)?
A KPI (Key Performance Indicator) is a measurable value that shows how effectively a person, team, or organization is achieving a specific goal.
Here’s a simple formula to think about it:
KPI = What you measure + Why it matters + Target value
An example of a KPI for a marketing team is: “Increase website conversion rate (what) to grow sales (why) to 5% by Q3 (target).”
KPIs are further split into two types:
Leading indicators are predictive and forward-looking (pipeline velocity, training completion rate)
Lagging indicators are outcome-based and backward-looking (quarterly revenue, annual churn rate)
Note: KPIs and metrics mean two different things. A metric is any quantifiable measure (page views, emails sent, support tickets opened), but a KPI is a metric linked to a strategic or operational goal.
What is the difference between a KPI and a metric?
All KPIs are metrics, but not all metrics are KPIs. Here’s how to tell the two apart:
Feature
Metric
KPI
Focus
General health and activity
Critical success factors
Intent
Tracks a specific process
Drives strategic decision-making
Impact
Low to medium (tactical)
High (transformational)
Example
Monthly website traffic
New customer acquisition rate
What is the difference between KPIs and OKRs?
KPIs and OKRs are both used to measure progress, but they do different jobs.
KPIs track how well a business, team, or process is performing. They are usually tied to ongoing health. Think revenue growth, customer churn, employee retention, website traffic, or average resolution time
OKRs, or objectives and key results, are used to set direction. They connect a bigger goal to a few measurable outcomes. For example, an objective could be “Improve customer onboarding,” while the key results might include “Reduce time to first value from 14 days to 7 days” and “Increase activation rate from 48% to 60%”
The idea behind this kind of goal-setting goes back to management thinkers like Peter Drucker, who popularized management by objectives in the 1950s. Later, Andy Grove brought a more measurable version of this thinking to Intel, which eventually shaped the OKR system used by many modern companies.
Summarize this article with AI ClickUp Brain not only saves you precious time by instantly summarizing articles, it also leverages AI to connect your tasks, docs, people, and more, streamlining your workflow like never before.
Summarize this article for me please
100+ KPI Examples Organized by Department
The examples below are grouped by department. Skip to your department if you’re looking for something specific, or read end-to-end for cross-functional visibility:
Sales KPI examples
Sales pipeline metrics and KPIs connect rep activity to revenue outcomes. Tracking the right ones reveals if pipeline health, deal speed, and quota progress are on track before the quarter ends.
1. Monthly Recurring Revenue (MRR)
Monthly Recurring Revenue is the total amount of predictable revenue your business generates from all active subscriptions each month.
Monthly Recurring Revenue = Sum of all monthly subscription fees
Indicator: Lagging
Benchmark: In B2B SaaS, a monthly MRR growth rate of 20% is considered extremely healthy.
2. Quota Attainment Rate
Quota Attainment Rate is the percentage of a sales target (quota) achieved by a salesperson or team within a specific timeframe.
Win Rate is the percentage of total opportunities in your pipeline that successfully convert into closed-won deals.
Win rate= (Closed-Won Deals / Total Opportunities) * 100
Indicator: Lagging
6. Average Deal Size
Average Deal Size is the mean amount of revenue generated from each individual closed-won contract.
Average deal size= Total Revenue / Number of Deals
Indicator: Lagging
7. Lead-to-Opportunity Conversion Rate
Lead-to-Opportunity Conversion Rate tracks how effectively your sales team identifies and qualifies raw leads into real sales opportunities.
Lead-to-Opportunity conversion rate= (Qualified Opportunities / Total Leads) * 100
Indicator: Leading
8. Customer Acquisition Cost (CAC)
Customer Acquisition Cost is the total amount of sales and marketing investment required to win a single new customer.
Customer Acquisition Cost= Total Sales & Marketing Spend / New Customers Acquired
Indicator: Lagging
Benchmark: B2B SaaS companies typically benchmark a CAC of $200–$700+ because of longer sales cycles.
When a measure becomes a target, it stops being a good measure.
The Wells Fargo case above is Goodhart’s Law in action. It was coined by the British economist Charles Goodhart in 1975, originally in the context of monetary policy. Today, it is one of the most cited warnings in business measurement. When people are judged by a single number, they stop trying to do a good job and start trying to “game” the system.
The problem: A support team told to ‘close tickets fast’ will start hanging up on customers earlier than ideal to clear their queue
The result: The metric looks great, but the service is poor
That’s why it’s important to never track a KPI in isolation:
Revenue per Rep measures the average productivity and performance of each individual member of your sales team.
Revenue per rep= Total Revenue / Number of Active Reps
Indicator: Lagging
10. Number of Qualified Opportunities
This KPI tracks the total volume of deals that have met your specific qualification criteria, such as BANT or SQL.
Number of Qualified Opportunities= Total count of leads meeting BANT or SQL criteria
Indicator: Leading
11. Upsell/Cross-sell Revenue
This metric tracks the revenue generated by selling additional products or higher-tier services to your existing customer base.
Upsell/Cross-sell revenue = Sum of new revenue from existing customers
Indicator: Lagging
12. Forecast Accuracy
Forecast Accuracy measures how closely your predicted sales revenue aligns with the actual revenue earned during a period.
Forecast accuracy = 1 – (Absolute Difference between Actual and Forecast / Actual)
Indicator: Lagging
13. Churn-related Revenue Loss
This metric quantifies the total amount of monthly recurring revenue lost due to customer cancellations or downgrades.
Churn-related revenue loss = Total MRR lost from canceled contracts
Indicator: Lagging
Benchmark: Churn-related revenue loss varies widely, from 12-14% in IT services and software to 40% and higher in consumer packaged goods.
What happens when Sales KPIs reward the wrong behavior?
Sales KPIs should help teams sell better. But when they reward the wrong behavior, people start chasing the number instead of the customer outcome.
That is what happened at Sears Auto Centers in the early 1990s. Sears used incentive programs tied to auto repair sales. Employees were rewarded for selling more services and merchandise, which looked like a smart productivity move on paper.
But as the Los Angeles Times reported, regulators alleged that customers were being sold unnecessary repairs across Sears Auto Centers in California.
What went wrong: The metric encouraged sales volume but failed to protect customer trust. When a KPI only asks, “How much did we sell?” teams can miss the better question: “Was this the right thing to sell?”
The fallout: Sears later settled charges across the U.S. The Washington Post reported that the settlement could affect 933,000 transactions nationwide and cost the company $15 million after tax adjustments
Metrics like calls made, demos booked, repairs sold, and deals closed can be useful. But they should be balanced with quality checks like customer satisfaction, refund rates, complaint trends, retention, repeat purchases, and post-sale outcomes.
Without marketing KPIs, your marketing team will report on vanity metrics—impressions, likes—instead of pipeline contribution. Here’s what you need to know:
14. Marketing ROI
Marketing ROI measures the overall profitability of your marketing spend by comparing the revenue generated to the cost of those campaigns.
Cost per Lead tracks how much your business spends to acquire a single new lead, helping you evaluate the efficiency of specific channels.
Cost per lead= Total Marketing Spend / Total Leads Generated
Indicator: Lagging
16. Marketing-qualified leads (MQLs)
MQLs are leads that have met specific engagement criteria to be deemed “marketing-ready” for a hand-off to sales.
Marketing-qualified leads = Count of leads meeting “marketing-ready” criteria
Indicator: Leading
17. Lead-to-close ratio
This ratio measures the percentage of leads that eventually convert into paying customers, reflecting the quality of your lead generation.
Lead-to-close ratio = (New Customers / Total Leads) * 100
Indicator: Lagging
Benchmark: In B2B SaaS, large enterprise deals usually have a lead-to-close ratio of under 20%. But win rates, especially in the SMB segment, can go as high as 30% among high-performing companies.
18. Organic Traffic Growth
Organic Traffic Growth tracks the month-over-month change in unpaid search traffic coming to your website through search engines.
CTR measures the percentage of people who click on a link or advertisement after seeing it on their screen.
Click-through rate = (Total Clicks / Total Impressions) * 100
Indicator: Leading
Benchmark: CTR averages around 5% for search and 0.46% for display ads in the B2B industry. Promotional emails skew lower (1-3%); content-rich emails trend higher.
20. Return on Ad Spend (ROAS)
ROAS quantifies the gross revenue generated for every dollar spent on advertising to measure the effectiveness of paid campaigns.
Return on Ad Spend = Total Revenue from Ads / Total Ad Spend
Indicator: Lagging
21. Email conversion rate
Email conversion rate tracks the percentage of recipients who took a specific desired action, such as a purchase or a sign-up.
Email conversion rate = (Actions Taken / Total Emails Delivered) * 100
Benchmark: Healthy B2B SaaS NRR was 106-115% in 2025; below 100% means existing-customer revenue is shrinking. Best-in-class hits 120%+.
28. Marketing-to-Sales Velocity
This KPI tracks the speed at which MQLs move through the funnel to become qualified sales opportunities.
Marketing-to-Sales Velocity= Sum of days from MQL to Opportunity / Total Opportunities
Indicator: Leading
Can a successful campaign still hurt your brand?
In 2017, Pepsi released an ad featuring Kendall Jenner joining a protest and handing a can of Pepsi to a police officer. The campaign drew immediate backlash for turning a serious protest movement into a brand moment. Pepsi pulled the ad soon after and apologized, saying it had “missed the mark.”
Remember, attention is not always a win. A campaign can generate reach, views, comments, and press, but still damage trust if the message feels tone-deaf.
That is why marketing KPIs need context.
Track reach with sentiment
Track engagement with audience quality
Track campaign performance with trust, conversion, and long-term brand impact
Finance KPI examples
Financial KPIs give leadership a real-time read on profitability, liquidity, and fiscal discipline. They’re the KPIs most likely to appear in board decks and investor updates.
29. Gross profit margin
Gross profit margin represents the percentage of revenue that exceeds the cost of goods sold, showing how efficiently a company produces and sells its products.
Gross profit margin= (Total Revenue – COGS) / Total Revenue
Indicator: Lagging
Benchmark: SaaS median gross margin was 74-77% in 2025; top quartile hits 80%+. Below 70% suggests cost-of-revenue inefficiency.
30. Net profit margin
Net profit margin measures how much of each dollar in revenue translates into actual profit after all operating expenses, interest, and taxes are paid.
Net profit margin= Net Income / Total Revenue
Indicator: Lagging
31. Operating cash flow
Operating cash flow quantifies the amount of cash generated by a company’s normal business operations, indicating whether it can sustain and grow its activities.
Operating cash flow= Net Income + Non-Cash Expenses – Increase in Working Capital
Indicator: Lagging
32. EBITDA
EBITDA (Earnings Before Interest, Taxes, Depreciation, and Amortization) is a measure of a company’s overall financial performance and is used as a proxy for operational profitability.
EBITDA = Net Income + Interest + Taxes + Depreciation + Amortization
Indicator: Lagging
33. Revenue growth rate
Revenue growth rate tracks the period-over-period percentage increase (or decrease) in a company’s total sales.
Revenue growth rate= (Current Period Rev – Previous Period Rev) / Previous Period Rev
Budget variance measures the difference between what a company planned to spend and what it actually spent during a specific period.
Budget variance= Actual Results – Budgeted Amount
Indicator: Lagging
ClickUp research shows 42% of work disruptions come from juggling platforms, emails, and meetings. That is one reason KPI dashboards often fail: the data exists, but the context is scattered.
Watch how you can turn these complex KPIs into a professional, client-facing dashboard in minutes:
35. Accounts receivable turnover
This KPI measures how efficiently a company collects payments from its customers by tracking how quickly outstanding invoices are settled.
Accounts receivable turnover = Net Credit Sales / Average Accounts Receivable
Indicator: Lagging
36. Accounts payable turnover
Accounts payable turnover tracks how quickly a company pays its suppliers and creditors, which is a key indicator of short-term liquidity.
Accounts payable turnover= Total Supplier Purchases / Average Accounts Payable
Indicator: Lagging
37. Current ratio
The current ratio measures a company’s ability to pay its short-term obligations using its total current assets.
Current ratio = Total Current Assets / Total Current Liabilities
Indicator: Lagging
38. Quick ratio
Also known as the “acid-test,” this ratio measures a company’s ability to meet short-term obligations using only its most liquid assets.
Quick ratio= (Cash + Marketable Securities + Receivables) / Total Current Liabilities
Indicator: Lagging
39. Burn rate
Burn rate tracks the monthly rate at which a company (typically a startup) spends its cash reserves before generating positive cash flow.
Burn rate= (Starting Cash – Ending Cash) / Number of Months
Indicator: Leading
40. Runway (months)
Runway predicts how many months a business can continue to operate at its current burn rate before running out of cash.
Runway = Total Cash Balance / Monthly Burn Rate
Indicator: Leading
41. Return on equity (ROE)
ROE measures financial performance by dividing net income by shareholders’ equity, showing how effectively management is using investors’ capital.
Return on equity= Net Income / Average Shareholder Equity
Indicator: Lagging
42. Debt-to-equity ratio
This ratio evaluates a company’s financial leverage by comparing its total liabilities to its total shareholder equity.
Debt-to-equity ratio= Total Liabilities / Total Shareholder Equity
Indicator: Lagging
Customer service KPI examples
Customer experience KPIs measure how well a service team resolves issues and retains trust. They sit at the intersection of operational efficiency and customer experience.
43. Customer Satisfaction Score (CSAT)
CSAT measures how satisfied a customer is with a specific interaction or service through a post-interaction rating.
Customer Satisfaction Score= (Sum of positive scores / Total number of responses) * 100
Indicator: Lagging
Benchmark: Global average CSAT is 78%. Good teams target 85%+; world-class hits 92%+.
44. Net Promoter Score (NPS)
NPS tracks customer loyalty and the likelihood that a user will recommend your product or service to others.
Net Promoter Score= % of Promoters – % of Detractors
This KPI tracks the speed of your support team by measuring the time elapsed between a ticket submission and the first reply.
First Response Time= Sum of First Response Times / Total number of tickets
Indicator: Leading
46. Average resolution time
Average resolution time measures the total time it takes for a support agent to fully resolve a customer’s issue from start to finish.
Average resolution time= Total time to resolve tickets / Number of tickets resolved
Indicator: Lagging
47. First contact resolution rate
This metric calculates the percentage of customer issues that are resolved during the very first interaction without needing a follow-up.
First contact resolution rate= (Tickets resolved in one touch / Total tickets resolved) * 100
Indicator: Leading
Benchmark: On average, 70% of support issues are resolved on first contact across industries. The best customer service teams hit 80%+
48. Ticket volume
Ticket volume tracks the total number of support requests your team receives over a specific period to help with capacity planning.
Ticket volume= Total count of support tickets over a specific period
Indicator: Leading
49. Ticket backlog
Ticket backlog represents the total number of unresolved or open support requests currently waiting for attention at any given time.
Ticket backlog= Total open tickets – Total resolved tickets
Indicator: Leading
50. Customer effort score (CES)
CES measures the ease of a customer’s experience by asking how much effort they had to put in to get their issue resolved.
Customer effort score= Sum of customer effort ratings / Total number of responses
Indicator: Lagging
51. Escalation rate
The escalation rate tracks the percentage of tickets that require intervention from higher-tier support or management.
Escalation rate= (Number of escalated tickets / Total number of tickets) * 100
Indicator: Leading
52. SLA compliance rate
This KPI measures the percentage of customer tickets resolved within the predefined timeframes set in your Service Level Agreement.
SLA compliance rate= (Tickets resolved within SLA / Total tickets resolved) * 100
Indicator: Lagging
53. Customer retention rate
Customer retention rate quantifies the percentage of existing customers who remain with your business over a specific timeframe.
Customer retention rate= [(Customers at end of period – New customers) / Customers at start] * 100
Indicator: Lagging
54. Churn rate
Churn rate measures the percentage of customers who stop using your service or cancel their subscriptions over a specific period.
Churn rate= (Number of customers lost / Total customers at start) * 100
Indicator: Lagging
55. Cost per ticket
Cost per ticket calculates the average operating cost required to handle and resolve a single customer support request.
Cost per ticket= Total service department costs / Total number of tickets resolved
Indicator: Lagging
Benchmark: Human-handled support tickets average $18-35 in SaaS, with costs rising to nearly ~$60 for B2B. Companies leveraging AI-driven self-service and automation report ticket deflection rates of 25–45%, which is why the AI deflection rate is now the most-watched support efficiency metric.
Operations KPI examples
Operational metrics and KPIs track the efficiency and reliability of the processes that deliver products or services. They’re the earliest warning system for bottlenecks, waste, and capacity constraints.
56. On-time delivery rate
On-time delivery rate measures the reliability of your supply chain by tracking the percentage of orders that arrive by the promised date.
Benchmark:Industry-average OEE is 60%. World-class manufacturing operations achieve 85%+. Below 50% indicates significant downtime, quality, or speed issues.
69. First Pass Yield (FPY)
FPY measures production quality by tracking the percentage of products completed correctly the first time without needing rework.
First Pass Yield= (Units entering process – Units requiring rework) / Units entering process
Indicator: Leading
70. Mean Time to Repair (MTTR)
MTTR represents the average time required to troubleshoot and fix a piece of equipment or a system after a failure occurs.
Mean Time to Repair= Total Maintenance Time / Number of Repairs
Indicator: Lagging
71. Mean Time Between Failures (MTBF)
MTBF measures the predicted elapsed time between inherent failures of a system during normal operation, indicating reliability.
Mean Time Between Failures= Total Operating Time / Number of Failures
Indicator: Leading
Operations KPIs work best in pairs. Every efficiency metric needs a quality, reliability, or customer-impact metric beside it.
KPI
When it goes bad
When it’s done well
On-time delivery rate
Teams rush orders out the door, even when quality checks are incomplete
Delivery speed improves without increasing returns, complaints, or defects
Capacity utilization
Machines and teams run too close to the limit, leaving no room for delays or maintenance
Leaders balance output with staffing, maintenance windows, and demand changes
Throughput
Teams push more units through the process while defect rates quietly rise
Output increases while quality, rework, and customer issues stay under control
Cost per unit
Teams cut corners on materials, labor, or supplier quality to lower costs
Costs fall because waste, rework, and process delays are reduced
Schedule adherence
Teams focus on hitting the plan even when the plan is unrealistic
Missed schedules become signals to improve forecasting, staffing, and production planning
Supplier lead time
Teams choose the fastest vendor without checking consistency or quality
Supplier speed is reviewed alongside reliability, defect rates, and total landed cost
Project management KPI examples
Project management KPIs measure whether work is being delivered on time, within scope, and at the expected quality level. They help PMs spot risks before they turn into missed deadlines.
72. Schedule variance (SV)
Schedule variance measures the difference between your planned progress and your actual progress to determine if a project is ahead or behind schedule.
Schedule variance= Earned Value – Planned Value
Indicator: Leading
73. Cost variance (CV)
Cost variance quantifies the difference between the budgeted cost of work performed and the actual cost incurred to complete that work.
Cost variance = Earned Value – Actual Cost
Indicator: Lagging
74. Planned vs. actual hours
This metric tracks how closely your initial time estimates for tasks match the actual hours logged by the team.
Planned vs. actual hours= (Actual Hours / Planned Hours) * 100
Indicator: Lagging
75. Milestone completion rate
Milestone completion rate calculates the percentage of critical project milestones that were successfully delivered by their due dates.
This KPI measures the percentage of your team’s total available capacity that is being used for productive or billable work.
Resource utilization rate= (Billable or Productive Hours / Total Available Hours) * 100
Indicator: Leading
77. Scope creep percentage
Scope creep percentage tracks the volume of unplanned work or new requirements added to a project after the initial kickoff.
Scope creep percentage= (Number of Tasks Added Post-Kickoff / Original Task Count) * 100
Indicator: Leading
Benchmark:PMI research finds that scope creep affects over half of all projects. Healthy creep is under 10% of the original scope; above 20% indicates weak change-control.
78. Sprint velocity
Sprint velocity measures the average amount of work a development team completes during a sprint, typically measured in story points or tasks.
Sprint velocity= Total story points completed in a sprint
Indicator: Leading
79. Burndown rate
The burndown rate tracks the speed at which the remaining work in a project or sprint decreases over time.
Burndown rate= Remaining Work / Total Sprint Time
Indicator: Leading
80. Number of change requests
This metric monitors the total volume of formal requests to change the project’s scope, requirements, or objectives.
Number of change requests= Total count of formal change requests submitted
Indicator: Leading
81. Rework rate
Rework rate measures the percentage of project deliverables that require revision or correction after their initial completion.
Benchmark: In high-performing organizations, 80% of projects are delivered on time. These organizations are also more likely to use proven project, program, and portfolio management practices.
Bonus: Use ClickUp’s Risk Assessment Analyzer AI Agent to catch project risk before it shows up in your KPIs. It reviews schedule, workload, and dependencies together, so you can spot where a project is starting to drift and act earlier.
HR and people KPI examples
HR KPIs quantify the health of an organization’s workforce—from how quickly it hires to how long people stay. They’re increasingly tracked at the executive level as talent becomes a competitive differentiator.
85. Employee turnover rate
Employee turnover rate measures the percentage of employees who leave the organization within a specific period, indicating overall workforce stability.
Employee turnover rate= (Separations / Average Number of Employees) * 100
Indicator: Lagging
Benchmark: According to the US Bureau of Labor Statistics, the US average monthly separation rate is ~3.3%, roughly 33% annualized.
86. Voluntary vs. involuntary turnover
This metric breaks down employee departures by those who chose to leave versus those whose employment was terminated by the company.
Voluntary vs. involuntary turnover= (Specific Type of Departure / Total Departures) * 100
Indicator: Lagging
87. Time to hire
Time to hire tracks the efficiency of your recruiting process by measuring the number of days from a job posting to an accepted offer.
Time to hire= Total Days from Posting to Acceptance / Number of Hires
Time to fill measures the total time required to find and onboard a new employee, starting from the initial requisition approval.
Time to fill= Total Days from Approval to Start Date / Number of Hires
Indicator: Lagging
89. Cost per hire
Cost per hire quantifies the total financial investment required to recruit a new employee, including advertising, agency fees, and internal resources.
Cost per hire= Total Recruiting Costs / Number of New Hires
Indicator: Lagging
Benchmark: SHRM data puts the average cost per hire at ~$4,700 for non-executive roles. Executive cost-per-hire has risen 113% since 2017.
90. Offer acceptance rate
This KPI measures the effectiveness of your talent acquisition strategy by tracking the percentage of extended offers that candidates accept.
eNPS measures employee loyalty and sentiment by tracking how likely your staff is to recommend your company as a great place to work.
Employee engagement score= % of Promoters – % of Detractors
Indicator: Leading
Benchmark: Global employee engagement fell to 20% in 2025, the lowest since 2020. Low engagement costs the world economy approximately $10 trillion annually (~9% of global GDP).
92. Absenteeism rate
The absenteeism rate tracks the percentage of scheduled workdays that employees miss due to unexcused or unplanned absences.
This metric monitors the percentage of employees who successfully finish required professional development or compliance training.
Training completion rate= (Employees Completed / Total Employees Assigned) * 100
Indicator: Leading
94. Internal mobility rate
Internal mobility rate tracks how well a company develops its own talent by measuring the percentage of open roles filled by current employees.
Internal mobility rate= (Internal Hires / Total Hires) * 100
Indicator: Leading
95. Diversity hiring ratio
This ratio measures the representation of underrepresented groups among new hires to track progress toward diversity and inclusion goals.
Diversity hiring ratio= (Underrepresented New Hires / Total New Hires) * 100
Indicator: Leading
96. Revenue per employee
Revenue per employee measures the average financial productivity of the workforce by dividing total revenue by total headcount.
Revenue per employee= Total Revenue / Total Number of Employees
Indicator: Lagging
97. Employee satisfaction index
This composite score uses data from employee surveys to quantify the overall level of satisfaction and morale within the organization.
Employee satisfaction index= (Sum of Survey Responses / Total Possible Score) * 100
Indicator: Leading
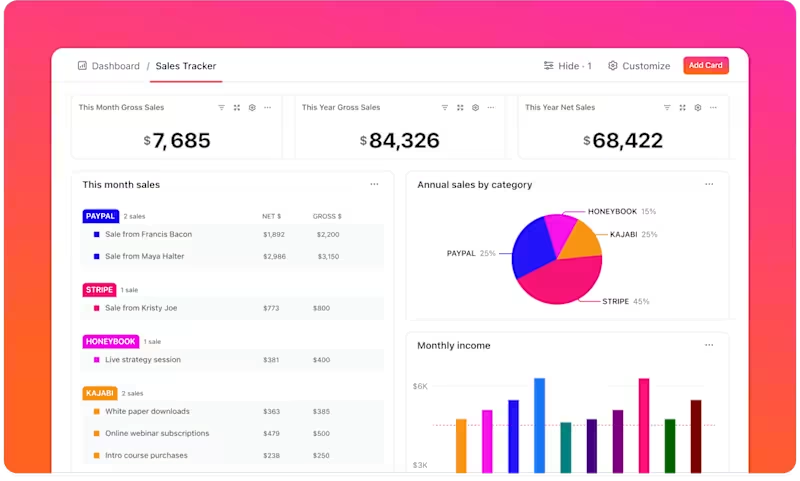
Reality Check: Treat burnout as a retention signal, not just a wellbeing issue. If absenteeism, workload complaints, manager churn, and review sentiment start moving together, don’t wait for attrition to spike. By the time people leave, the KPI is already late.
Glassdoor reported that the share of reviews mentioning burnout rose 32% year over year as of Q1 last year. It reached its highest level since Glassdoor began tracking the data in 2016.
Deployment frequency measures how often your team successfully releases code to production, serving as a primary indicator of agility and DevOps maturity.
Deployment frequency= Total number of deployments / Time period
Indicator: Leading
Benchmark:DORA research classifies engineering teams into Elite, High, Medium, and Low performers across four metrics: deployment frequency, lead time for changes, change failure rate, and failed deployment recovery time. Elite teams deploy on demand, recover from failures in under an hour, and have change failure rates under 15%.
99. Lead time for changes
This KPI tracks the average amount of time it takes for code to go from being committed to being successfully deployed in production.
Lead time for changes= Average (Timestamp of deployment – Timestamp of commit)
Indicator: Leading
100. Change failure rate
The change failure rate measures the percentage of deployments that result in a failure or require an immediate fix or rollback.
Change failure rate= (Number of failed deployments / Total deployments) * 100
Indicator: Lagging
101. Mean time to recovery (MTTR)
MTTR quantifies the average time it takes for the team to restore service after a system failure or incident occurs.
Mean time to recovery= Total downtime for all incidents / Number of incidents
Indicator: Lagging
102. System uptime
System uptime tracks the percentage of time that your systems and services are operational and accessible to users.
System uptime= (Total uptime / Total potential time) * 100
Indicator: Lagging
103. Incident response time
This metric measures the time elapsed between the detection of a technical incident and the first formal response from the engineering team.
Incident response time= Total time to respond / Total number of incidents
Indicator: Leading
104. Defect density
Defect density measures the quality of a software release by tracking the number of confirmed bugs relative to the size of the software, such as per thousand lines of code.
Defect density= Total number of defects / Size of the release
Indicator: Leading
105. Bug escape rate
The bug escape rate measures the percentage of software defects that are not caught during testing and reach the production environment.
Bug escape rate= (Bugs found in production / Total bugs found) * 100
Indicator: Lagging
106. Code review turnaround time
This KPI tracks the average time it takes for a pull request to be reviewed by another team member, highlighting potential bottlenecks in the development pipeline.
Code review turnaround time= Total time spent in review / Number of pull requests
Indicator: Leading
107. Infrastructure cost per user
This financial metric tracks the efficiency of your IT spend by dividing total infrastructure costs by the number of active users.
Infrastructure cost per user= Total infrastructure costs / Total active users
Indicator: Lagging
108. API error rate
API error rate measures the percentage of API requests that fail due to client-side errors, server-side errors, timeouts, or other response failures.
API error rate = (Number of failed API requests / Total number of API requests) * 100
Indicator: Lagging
109. Backlog grooming rate
This metric monitors the health of your product queue by measuring the percentage of backlog items that have been reviewed and prioritized.
Backlog grooming rate= (Items groomed / Total items in backlog) * 100
Indicator: Leading
110. Release rollback rate
The release rollback rate tracks the percentage of software releases that had to be reversed due to critical issues found after deployment.
Release rollback rate = (Number of rollbacks / Total releases) * 100
Indicator: Lagging
This video walks through key software development KPIs and how development teams use them to track performance and delivery:
Summarize this article with AI ClickUp Brain not only saves you precious time by instantly summarizing articles, it also leverages AI to connect your tasks, docs, people, and more, streamlining your workflow like never before.
Summarize this article for me please
How to Write a KPI
A well-written KPI passes one simple test: if the number changes, somebody does something different. If nothing changes, it’s a metric, not a KPI.
Here’s the structure that turns a vague intention into a usable KPI:
Cut monthly churn from 4.2% to under 3% by year-end
Hire faster
Reduce time to fill engineering roles from 52 days to 35 days by Q4
Ship more code
Increase deployment frequency from weekly to daily by end of next sprint
Notice what changes between the columns: each sharp KPI has a baseline (what you’re starting from), a target (where you’re going), and a deadline (when you’re getting there). Without all three, you don’t have a KPI. You have a hope.
Product management thought leader, Shreyas Doshi, offers words of advice when teams (high-growth companies in particular), try to do too much with their KPIs.
Non-metric goals like ship X, do Y are completely fine, even preferred for early stage products. Any company that forces *all* goals for *every product* to the “move metric A from X to Y” format is actually revealing a deficiency in its judgment and critical thinking.
Shreyas Doshi
Summarize this article with AI ClickUp Brain not only saves you precious time by instantly summarizing articles, it also leverages AI to connect your tasks, docs, people, and more, streamlining your workflow like never before.
Summarize this article for me please
How to Choose the Right KPIs for Your Team
Having a list of KPI examples is the easy part. The hard part is narrowing down to the handful that actually change behavior and decisions on your team. Run every candidate KPI through these four filters before committing to it.
Align each KPI with a specific business goal
Every KPI should trace back to a stated objective. If you can’t complete the sentence “This KPI tells us whether we’re on track to [specific goal],” it’s a metric, not a KPI. That’s because goals and objectives require measurable targets.
Begin with your company’s top three quarterly priorities and choose KPIs that directly measure progress. Avoid adopting KPIs just because competitors or industry benchmarks use them. Your context is more important.
For example, link business goals to relevant KPIs:
Reduce customer churn by Q3: Monthly churn rate, NPS trend
Increase pipeline by 20%: Number of qualified opportunities, marketing-sourced pipeline
Ship the product redesign on schedule: Milestone completion rate, scope creep percentage
Apply the SMART framework to every KPI
Every KPI should be Specific, Measurable, Attainable, Relevant, and Time-bound.
“Improve customer satisfaction” is vague
“Increase CSAT score from 78 to 85 by the end of Q2” is a SMART goal and KPI with a clear baseline, target value, and deadline
“Attainable” is the filter several teams skip. Setting aspirational targets sounds motivating, but it leads to KPIs nobody takes seriously after the first missed review. Set targets based on historical performance and realistic growth rates.
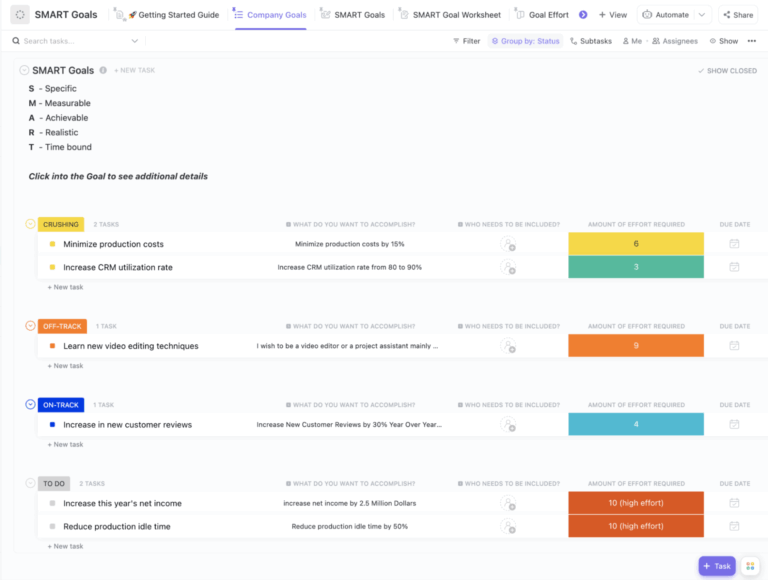
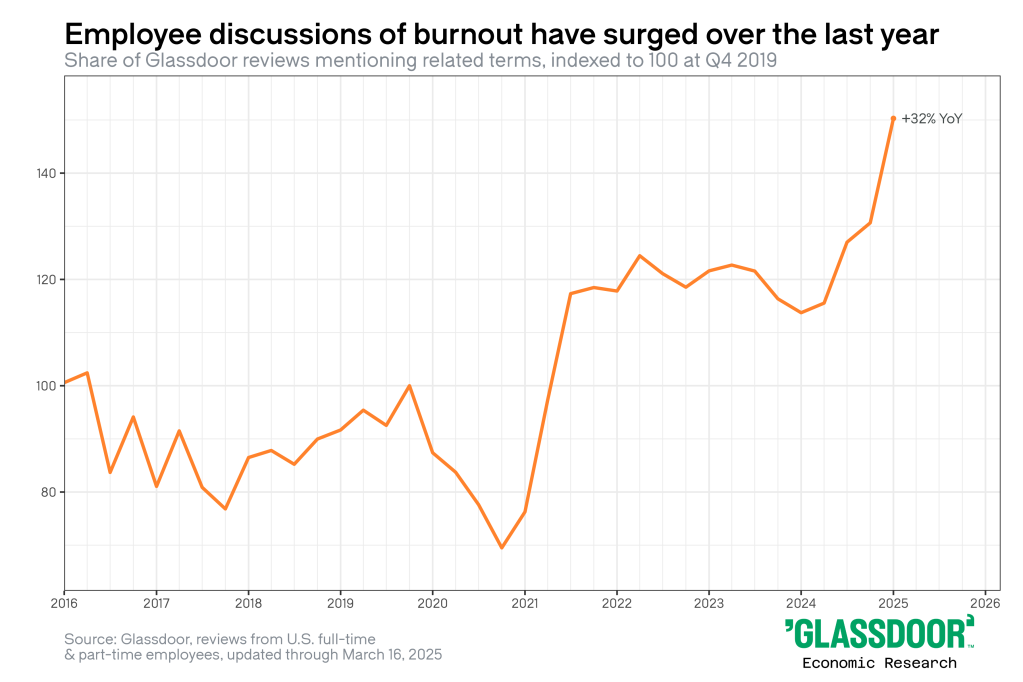
The SMART Goals Template by ClickUp turns abstract objectives into measurable, time-bound tasks with ownership and effort estimates. You can use this to keep your business goals visible and actionable.
Break down large goals, track progress, and measure success with the SMART Goals Template by ClickUp
Why use this template:
Keep due dates and milestones front and center, so your team stays aligned on deadlines
Use custom statuses such as “Crushing,” “Off Track,” and “On Hold” to see which KPIs need immediate intervention
Capture specific context with custom fields for effort levels and planning attributes, making your targets more accountable
Lagging indicators confirm what has already happened. Leading indicators predict what’s about to happen. The mistake most teams make is tracking only lagging KPIs, which means they’re always reacting instead of preventing.
For every lagging KPI, pair it with at least one leading KPI that influences it.
Lagging: Quarterly revenue → Leading: Pipeline value and win rate
Monthly or quarterly: Strategic goals (revenue growth, retention, market share)
A good benchmark is when teams track 3–5 KPIs per goal. Anything more and focus starts to break down. Cut what you wouldn’t act on, and keep only what drives a clear next step.
Did You Know? 78% of ClickUp’s survey respondents struggle with staying motivated on long-term goals. It’s not a lack of drive—it’s how our brains are wired! We need to see the wins to stay motivated.
Summarize this article with AI ClickUp Brain not only saves you precious time by instantly summarizing articles, it also leverages AI to connect your tasks, docs, people, and more, streamlining your workflow like never before.
Summarize this article for me please
How to Track KPIs in ClickUp
Once you choose your KPIs, you may need a system to track them. Most teams default to manual spreadsheets. This often leads to a “reconciliation problem” where the tracker doesn’t match the actual work.
Here is how we centralize data in ClickUp to keep it accurate.
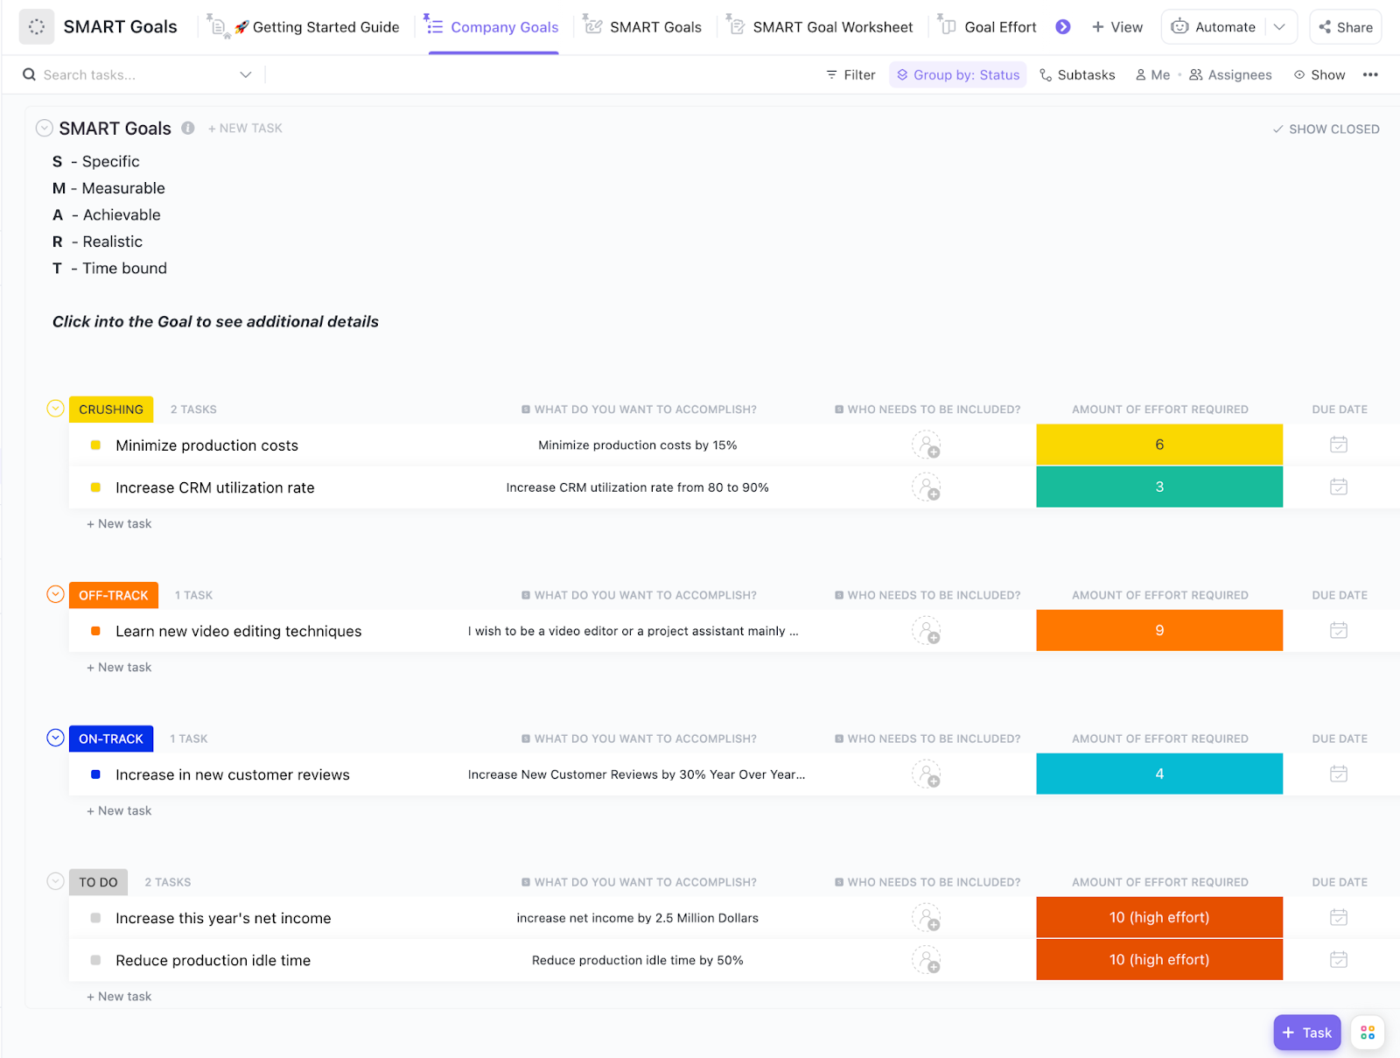
Visualize data with Dashboards
Our teams use ClickUp Dashboards to pull data directly from active tasks. We use Calculation Widgets to aggregate “Total Spend” or “Total Time Logged.” These widgets refresh automatically, saving us from assembling manual slide decks every Friday.
Accelerate Analytics Collaboration and Impact
Define targets where work happens
We use Custom Fields to store the “Target” and “Actual” values directly on the tasks. In an HR folder, the “Time to Hire” target lives on the requisition task. This ensures the data is live and is updated by the people doing the work.
Automate the “Early Warning System”
Data only helps if you see it in time. We use ClickUp Automations to connect KPIs to action. For example: “If ‘Defect Rate’ exceeds 5%, create a high-priority task for the QA lead.” You don’t have to remember to check the dashboard. The system flags the problem for you.
Surface trends with ClickUp Brain
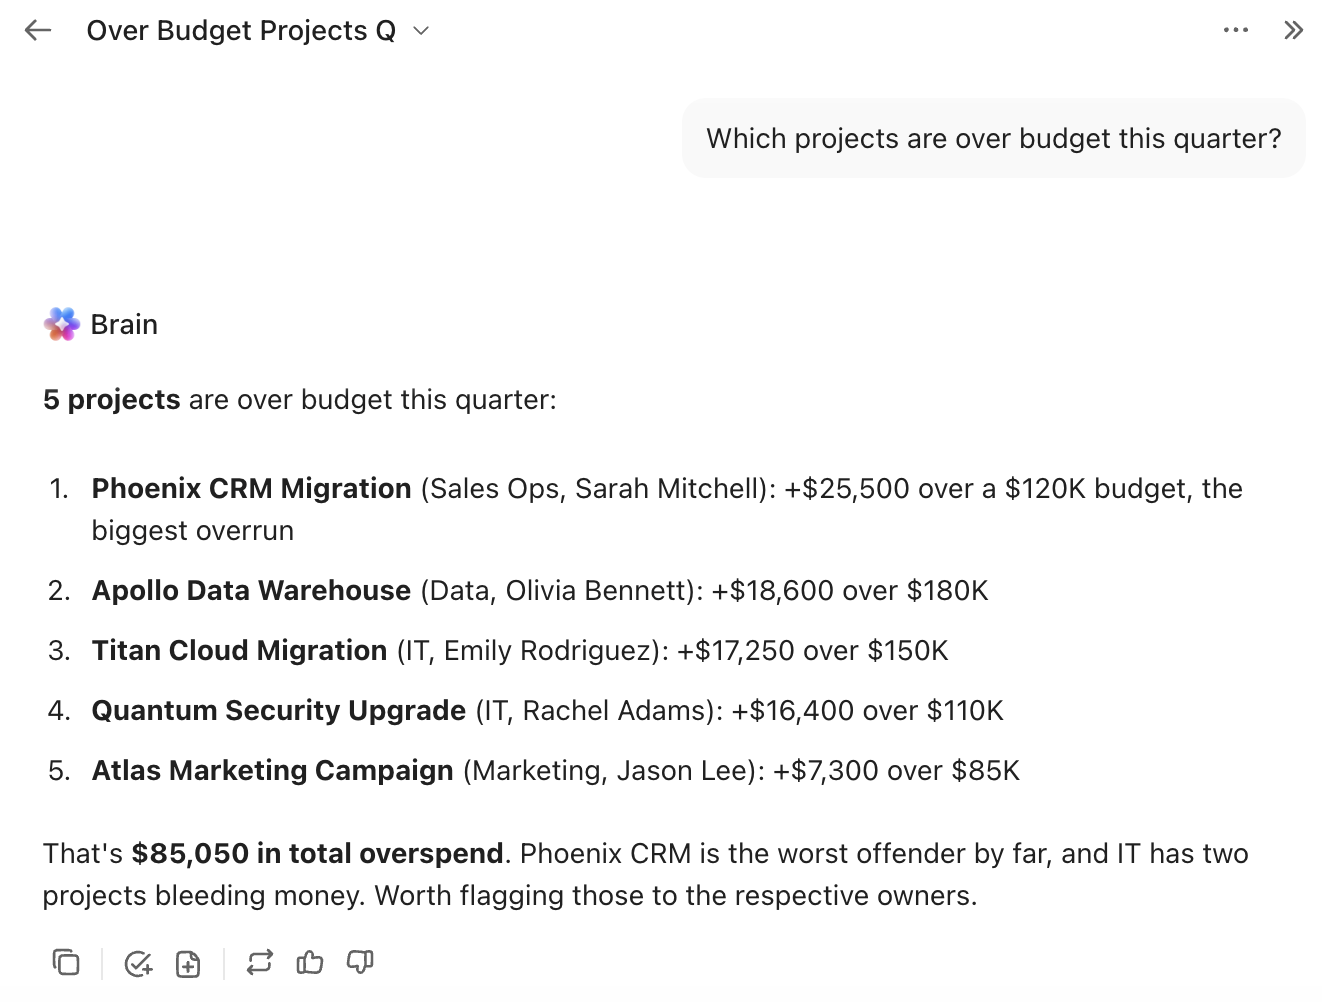
When leadership needs answers fast, they use ClickUp Brain. You can ask, “Which projects are over budget this quarter?” The AI pulls answers directly from your workspace and connected apps. It acts as a shortcut to your own data during status meetings.
Answer project performance questions instantly with ClickUp Brain
QuickNote: ClickUp is great for connecting team activity to goals. However, it isn’t a replacement for a heavy-duty data warehouse like Snowflake. It works best when your data and your “doing” happen in the same place.
Summarize this article with AI ClickUp Brain not only saves you precious time by instantly summarizing articles, it also leverages AI to connect your tasks, docs, people, and more, streamlining your workflow like never before.
Summarize this article for me please
Start Executing Your KPIs
KPIs only work when they make performance easy to see and act on. The right metrics show your team exactly what matters. And they also help leaders track progress across departments without having to hunt down scattered updates.
Choose the metrics that match your specific goals and review them often.
And if you want your KPIs to evolve with your business, use ClickUp, a Converged AI Workspace. It connects your KPIs directly to your goals, tasks, and objectives.
Summarize this article with AI ClickUp Brain not only saves you precious time by instantly summarizing articles, it also leverages AI to connect your tasks, docs, people, and more, streamlining your workflow like never before.
Summarize this article for me please
Frequently Asked Questions About KPI Examples
What are the 5 main types of KPIs?
The five most common KPI categories are: financial (revenue, margin, cash flow), customer (CSAT, NPS, retention), operational (cycle time, defect rate, throughput), employee (turnover, eNPS, time to hire), and growth/sales (pipeline velocity, deployment frequency, MQLs).
What are the 4 primary KPI classifications?
KPIs are commonly classified in four ways: leading (predictive), lagging (outcome-based), quantitative (numerical), and qualitative (sentiment-based). The most important pairing is leading vs lagging. Tracking only lagging KPIs means you’re always reacting; pairing each lagging KPI with a leading one lets you intervene before targets are missed.
What is a good KPI?
A good KPI is specific, measurable, tied to a business goal, has a clear owner, and influences a decision. The simplest test: if the number changes, does anyone do anything different? If not, it’s a metric, not a KPI. Aim for 3-5 KPIs per goal, not 30.
How many KPIs should a team track?
Set 3 to 5 KPIs per major goal, and no more than 7-10 total per team. Past that, focus collapses and review meetings turn into status theater. If your dashboard has 25 KPIs, your team has no priorities.
What’s the difference between leading and lagging KPIs?
Lagging KPIs measure outcomes after they’ve happened (revenue, churn rate, customer lifetime value). Leading KPIs predict those outcomes (pipeline velocity, NPS, training completion).
Everything you need to stay organized and get work done.