Question—how can you get to your destination if you haven’t picked one? How do you know how close you are unless you check the map?
Progress and, more importantly, sharing progress is pretty darn essential for agile teams to hit their deadlines. In fact, SMB research and meta-analysis by the American Psychological Association say companies (and people) that set goals and regularly track progress on those goals are more likely to achieve them.
These findings make a lot of sense.
Sharing your progress publicly moves the needle on productivity even more, which is a pretty compelling case for visual project management tools like agile burndown charts.
So, what are agile burndown charts and how exactly will they help you track (and share) progress toward your goals? Read on for a primer to get up to speed and know your ideal work remaining line, story point estimates, and work to do for your scrum team.
What are agile burndown charts?
Agile burndown charts track how much work is left on a sprint or project and how much time the team needs to complete that work. They are typically used by agile project managers, product managers, and other team leads to keep work on schedule, identify issues as soon as they appear, and plan strategically for each sprint or project.
There are two primary types of burndown charts: sprint burndowns (which track work within a specific sprint) and product burndowns (which track work for a full product project).
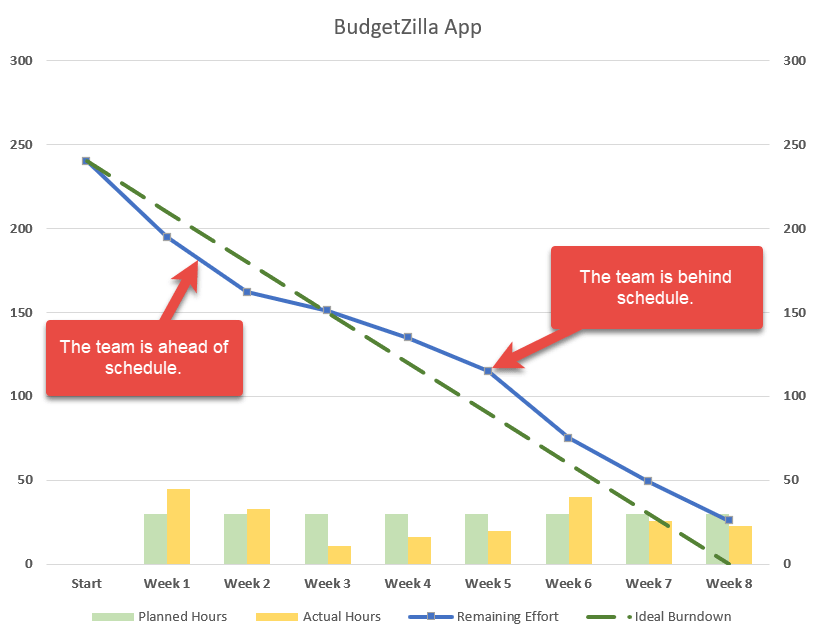
For both types of burndown charts, the y-axis (vertical) represents the amount of work to be done and the x (horizontal) axis represents the time allotted to do it. The top left corner is your starting point, and the successful project end is the bottom right.
Typically, a straight line from start to finish represents your ideal work remaining (basically, what will happen if you tackle the project consistently from start to finish with no setbacks or speed-ups). A second line—almost always less linear due to unexpectedly fast or slow tasks, interruptions, and innovations—represents the actual work remaining.
Your project manager will use these lines to track expectations against reality and adjust as needed both within this sprint, over the larger project, and on future projects. It’s always best to have an actual work remaining line in a burndown chart to compare and contrast against your project end point.
TIP
So how do teams measure their actual progress?
The answer is story points—a point system assigned to each feature to represent the time and effort required to complete it. Higher numbers of story points mean more work for the team. Lower point levels will be easier (and faster) to achieve.
The benefits of burndown charts
Burndown charts should be updated daily, allowing project managers to track progress in real-time and identify issues before they become…well…issues. Product owners should be able to understand the projected timeline at a glance and determine whether they need to adjust the schedule accordingly.
Is your actual work line trending far above the projection?
You know you’ve got a problem. And it’s time to press pause and find out what that problem is and how to address it. Perhaps your estimates were off and the team needs more time. Or perhaps there’s a fixable issue sucking up team bandwidth. Either way, the earlier you catch the discrepancy, the earlier you can get the train back on the tracks.
STATS
In a recent survey, customers told us that enhanced productivity is the No. 1 benefit they’ve realized after switching to ClickUp. Tools like good burndown charts (and other agile solutions) are part of the reason. Get started with a Burndown Chart Template.
Burndown charts also keep high-level leadership teams in the loop
The c-suite doesn’t need a detail-level look at every project, but they might need to know how projected timelines are shaking out and whether large-scale goals need to be recalibrated. A burndown chart is a simple, high-level way to show the status of each project, sprint, or product.
It’s easier to keep going on a project if we can see how far we’ve already come. This is why it makes a ton of sense to use your burndown to motivate your teams, especially if and when you make a big leap toward your end goal.
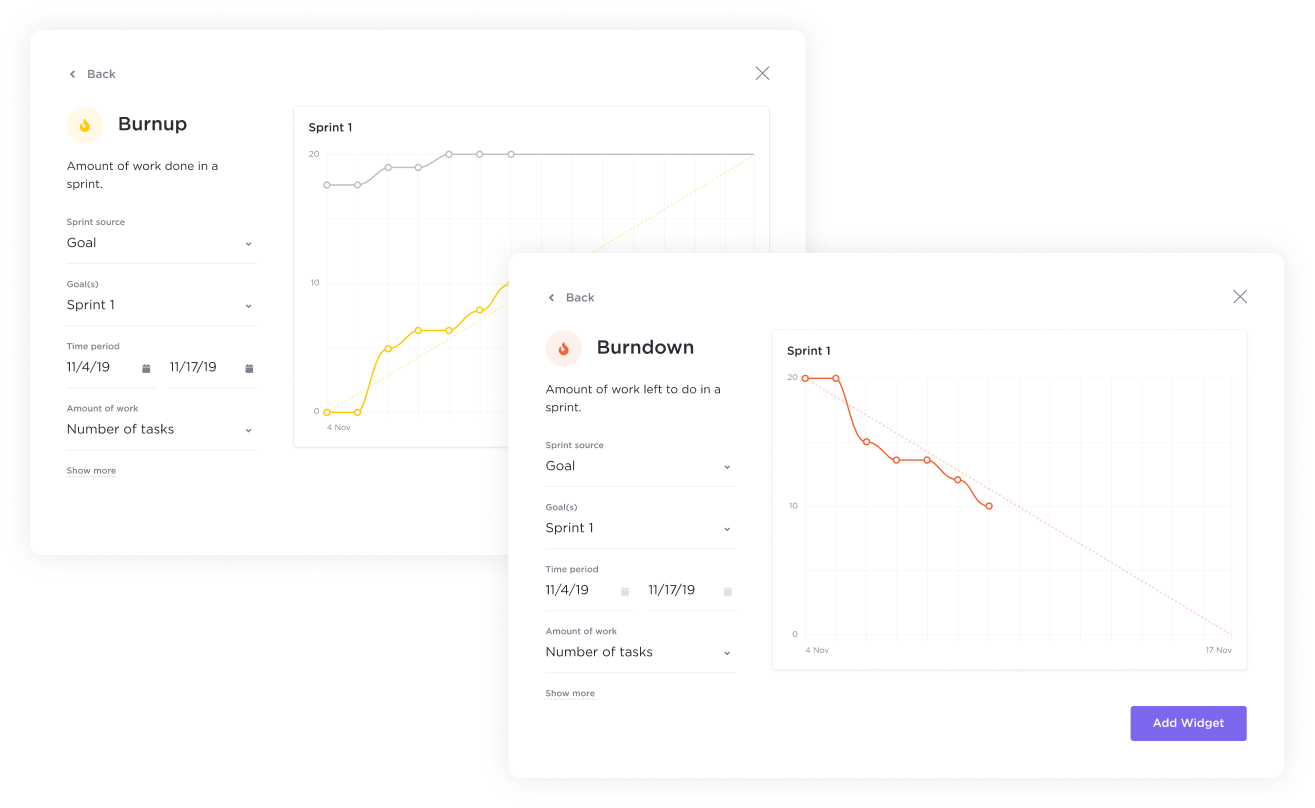
Burndown vs. burnup: What’s the difference?
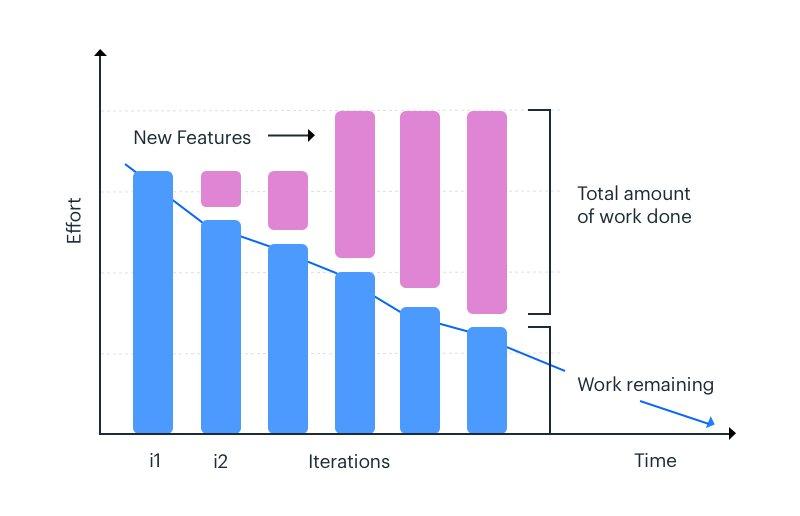
If a burndown chart tracks the work you have left on each project, burnup is just the opposite: it tells you how much work you’ve already done on a project or toward a goal.
Both can be useful ways to visualize progress, but they typically have different functions. Burndown charts help project managers identify estimation issues early and understand how much work and effort remains. Burnup charts help motivate teams by showing progress toward an end goal.
In other words, burnup shows the team that they are just a few feet from the finish line! Burndown helps project managers understand whether they have mapped the terrain and planned the timing correctly to get the team across that finish line.
Both charts can be used in similar ways, depending on what data you choose to include. So ultimately, even though the norm may be to use burndown for strategic planning and burnup for team motivation, teams can choose to work with either or both charts–whatever their preference.
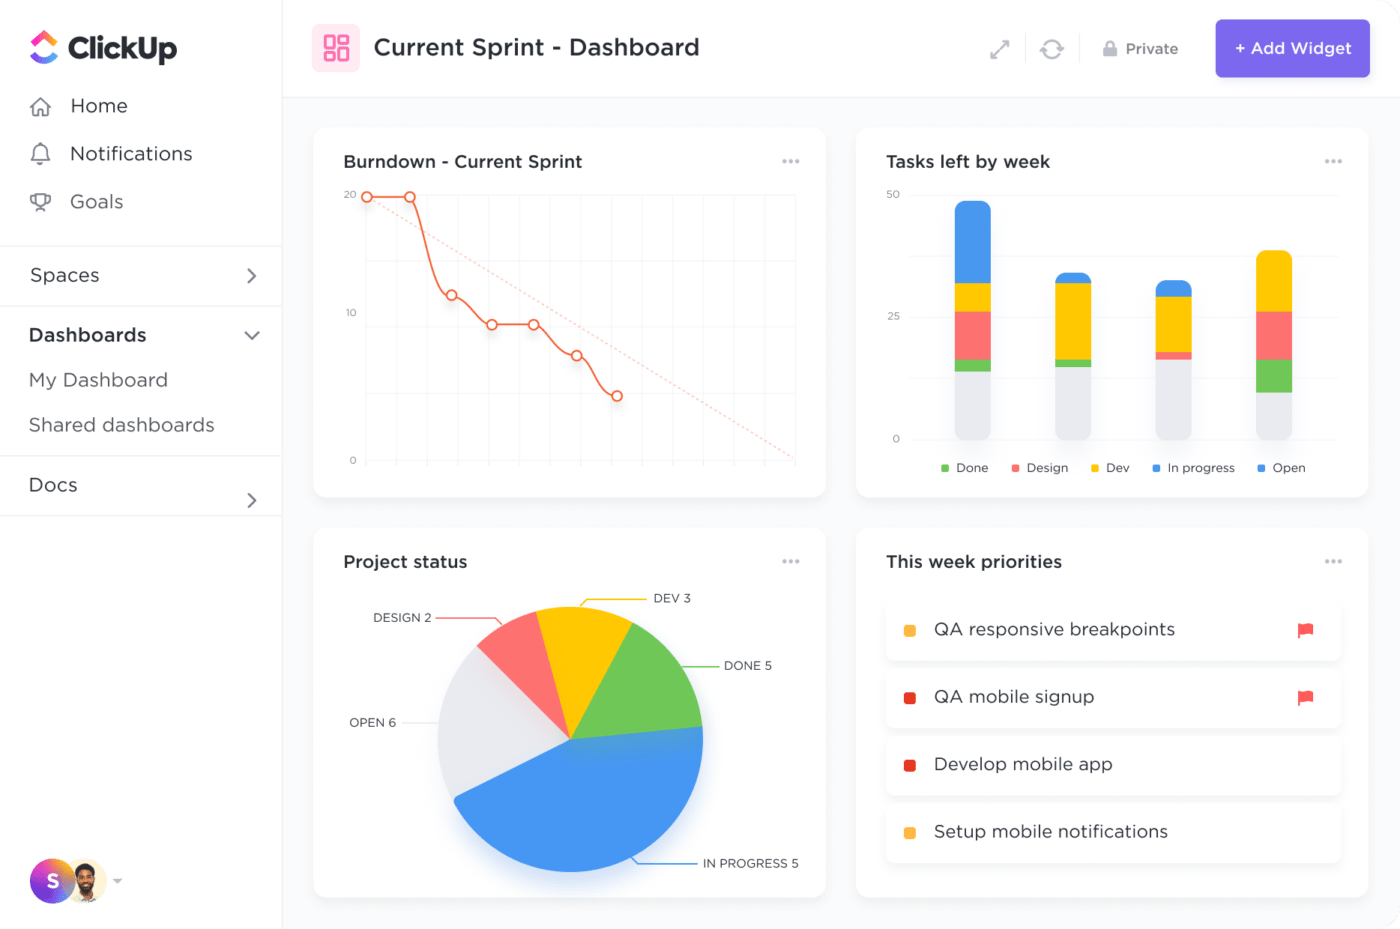
 ClickUp Burnup and Burndown Chart in Dashboard View
Components of an agile burndown chart
Your sprint burndown charts will always have a starting point—representing the beginning of your project (far left on the horizontal axis) and the full workload expected (top of the vertical axis)—and an endpoint (or goal)—representing the end of your project (far right on the horizontal axis) and workload completion (bottom of the vertical axis).
In between those two poles, one (typically straight) line between your starting point and goal represents the estimated work remaining (or ideal work remaining). Another line (typically far less straight) represents the actual work remaining (the actual work line). In ClickUp, the burndown chart shows your estimated work line is a red dotted line and the actual work is represented in blue.
You may also choose to include the number of story points (total, expected, and completed) on your chart and some teams create a secondary chart that shows a third line representing the actual workload each day—a practice that can help with future planning and show you when other priorities are crowding out this particular project.
Burndown best practices: What can you do to best implement?
So, how do you make sure your burndown chart is an effective tool for your team? The answer comes down to our best practices:
1. Take the time to estimate properly
A burndown chart is only as good as its estimates. If you promise something in two weeks that really will take your team four, the sprint burndown chart won’t save you. Make sure you’re setting reasonable goals, learning from past velocity, and not burning your teams out.
2. Don’t forget the backlog
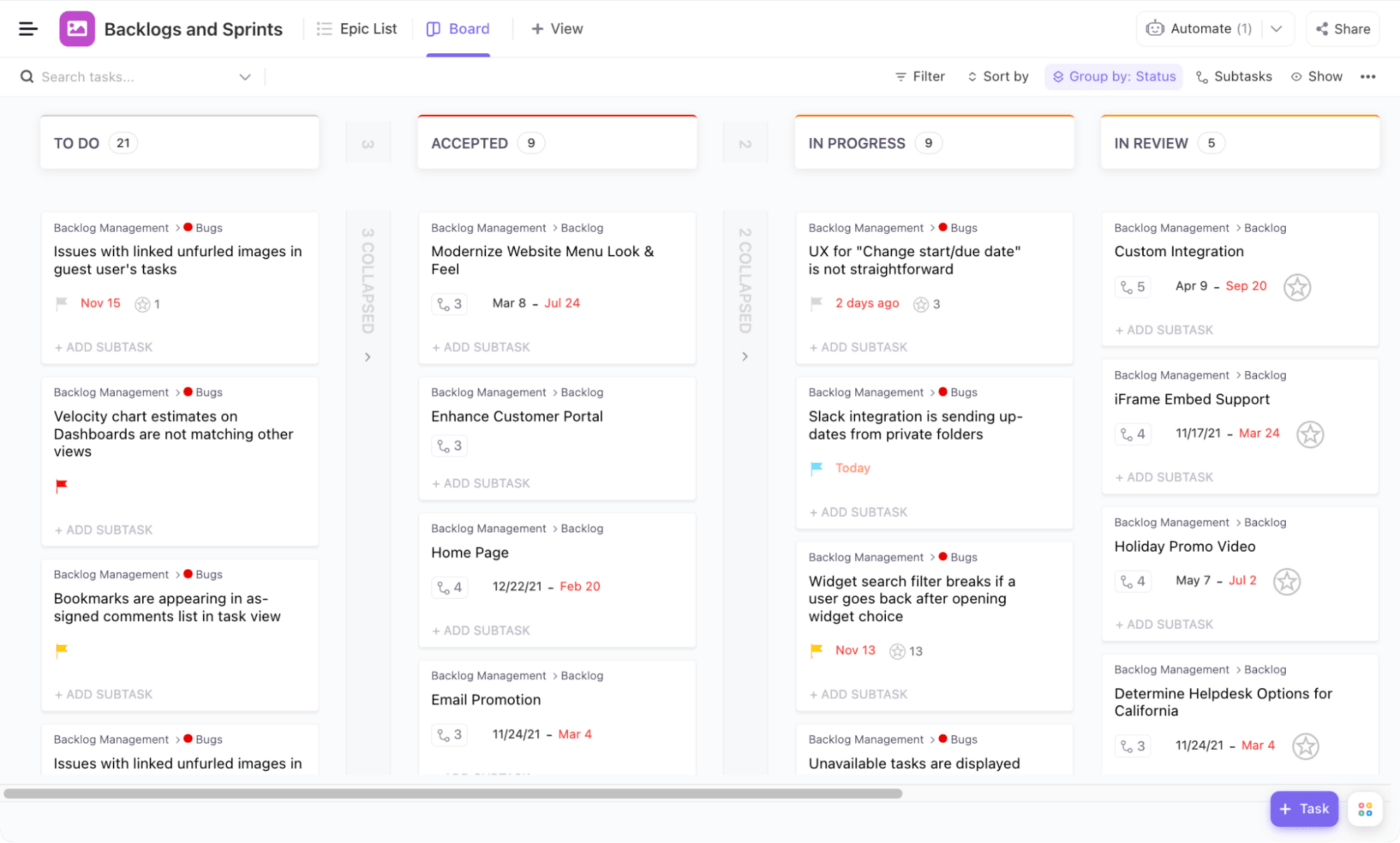 A complete view of your backlogs and sprints in ClickUp’s Board View
Speaking of estimating, it’s not just velocity that you need to get right; it’s also story points. If you miss key backlog items or add them at a later point in the project, it’s going to throw off your trajectory and skew the chart. The clearer you are on the team’s full workload, including backlog and other projects, the better you can estimate your burndown rate and actual work line. Luckily, a solid burndown chart shows exactly this. 😉
3. Check the chart often
Product and project managers should have their fingers on the pulse of the project regularly. This means checking your burndown chart and flagging any alarming trends (or big wins!) early on. You can’t duplicate success if you don’t know what’s made you successful, and you can’t avoid pitfalls if you never dig into what created the problem.
How to create agile burndown charts
Now that you know a burndown chart is on your horizon, here’s how to make yours:
Choose your unit of measurement
Most agile teams use story points to measure effort, but ultimately it’s up to you how your team can best measure effort and progress. Whether its story points, hours or some other metric, decide how you will measure things up front and use this metric to estimate the effort and time required for your project and to enter progress daily.
Estimate effort for each task
Using your unit of measurement, have teams estimate the effort required per task and the effort they can achieve each day. Use historical data on team velocity to support or correct these estimates in your burndown chart.
Enter info into your tool or template
Enter measurement units, tasks, estimates, and other relevant data into your tool of choice and use the burndown chart for project management review, team meetings, and other situations where you need to visualize progress or solve problems.
If you’re using ClickUp, you can create a burndown widget with these simple instructions.
Learn more about agile methodologies and practices in the rest of our articles.