
Want to learn about burn up charts and understand how to use them?
A burn up chart is one of the simplest tools to quickly track your project’s progress and evaluate what you’ve accomplished.
In this article, we’ll cover everything you need to know about burn up charts to help you use them effectively.
Let’s get started.
What is a burn up chart?
A burnup chart is a visual representation of your project’s progress that highlights:
- The work completed
- and the total project work.
It’s an easy way for Agile project managers to track what’s been completed against their total scope of work. This makes it easy to estimate if things are going according to plan or not.
How do you read a burn up chart?
Here’s an example of a good burn up chart:
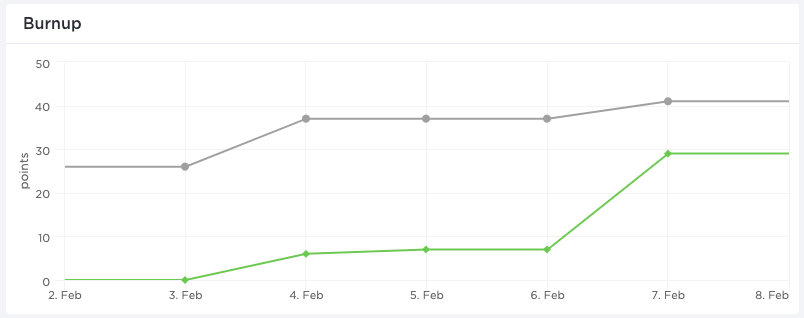
Let’s break it down. A burn up chart shows:
- The quantity of work (your story points) represented on the vertical axis (y axis)
- Your total total project time (sprints) represented on the horizontal axis (x axis)
In addition to the two axes, there are two lines present in the burn up chart:
- The green line is the completed work line and it represents the work your team has completed so far
- The grey line is the total work line and represents the total work you have to do (your project’s scope)
Here’s a closer look at both those lines:
A. Completed Work Line
This line highlights the work your team has completed so far. Use it to identify how far off you are from completing a project. Remember, a project is complete when your work completed line meets your total work line.
You can also use it to chart how much work your team completed during each sprint (iteration). This is an easy way to identify when your team was most productive.
Your completed work line is also a good way to motivate your team by showing them how much they’ve already accomplished. It’s a simple way to show them how much effort they need to put in to complete an iteration!
B. Total Work Line
This line on the burn up chart represents your project’s entire scope of work (your total project backlog).
As clients may add backlog items midway through your progress, this line could increase due to scope creep. For example, in the burn up chart we highlighted earlier, the total work line moved up during the fifth iteration. This was likely due to the client adding some backlog items at that stage.
However, in rarer cases, your total work line may even go down if a client reduces the backlog items in your product or sprint backlog.
(Don’t count on this happening though!)
How do burn up and burn down charts differ?
While burnup and burndown charts are both key to Agile project management process, they’re not the same thing.
- A burnup chart highlights the work you’ve completed against your total project scope while a burn down chart highlights the amount of work remaining in a project.
- A burnup chart contains a work completed line and a project scope line. A burn down chart contains an ideal work remaining line and an actual work remaining line.
While they differ, burn up and burn down charts are both key to Agile project management process.
What are the ideal and actual work remaining lines in a burn down chart?
The ideal work remaining line highlights how much work you’d have left if a project progressed as planned.
Your actual work remaining line highlights the actual amount of work you have left. Comparing these two lines gives you an estimate of how far ahead or behind schedule you are.
What Burn Up Charts are Used For:
- Burn up charts are a good way to track how much you’ve accomplished and keep a check on your project’s scope creep
- Burndown charts are used to identify how much work is left against the total time you set aside for a project
The Key Benefits Of Using Burn Up Charts Over Burn Down Charts
Burndown charts come with two major issues:
1. A burn down chart relies heavily on accurate project planning
As your ideal work remaining line is based on what you’ve planned, getting it right is essential.
If you’ve underestimated the time a release would take, your release burn down chart will constantly put your project team behind schedule. Alternatively, if you’ve overestimated the time your release plan will take, you’ll constantly be ahead of schedule!
Burn up chart advantage
As there are no planned estimates in burn up charts, you won’t be facing this issue. All you need to do is accurately track your progress as you move on with a project.
2. Burndown charts don’t keep track of your product backlog
This is another major issue with most release burndown charts.
Your release burndown chart only reflects added story points (tasks that are completed). It can’t monitor a scope change in case items were added to your product backlog during this time.
This can make it difficult to determine if your release burndown progress is:
- Solely due to adding story points (work done) to your chart
- Due to actual progress in resolving product backlog items
As your release burndown chart might not correlate with actual backlog completion, you could have an inaccurate estimate of sprint progress.
This way, you could be completing work, but as your project’s scope keeps increasing, you’re not any closer to reaching your goal!
Burn up chart advantage
As a burnup charts include a line for scope change, they can give you accurate progress estimates even when scope creep happens. This guards against your burnup highlighting inaccurate backlog data!
However, as the uses for burnup and burndown charts differ – you’ll still have to use both to adopt the Agile methodology!
How Burnup charts help Agile project management
Burnup charts are an essential part of agile projects.
Here’s how:
A. Keeps Track Of What You’ve Accomplished With Each Sprint
Burnup charts make it incredibly easy to track how your sprints are progressing. As your progress is marked across sprints, you can see where you made the most progress and where things slowed down.
This can also be very useful for Scrum teams.
How?
A scrum master can go over their burnups to see what went wrong and work on solutions with the scrum team during their daily meetings!
B. Monitors Your Project Scope
Unlike other charts, burnup charts also monitor your project scope. This gives you context when you’re monitoring your project progress.
For example, if a project is taking longer than expected, take a look at the scope line to see if there was a scope change. This would explain why you’re behind schedule – even if nothing appeared to be going wrong.
Understanding your scope of work can be incredibly helpful when justifying delays to customers and other stakeholders. If a client is concerned about how long a project is taking, a product owner can highlight the deviation from the planned project path – which would explain the scope creep.
What is the Best Burnup Chart Tool for Agile Project Management?
ClickUp is the best burn up chart tool for Agile project management – create powerful burnup charts to help you keep up with your project’s progress.
Luckily, Agile methodology is exactly what the ClickUp project management tool was built for! Here’s a quick glance at some of ClickUp’s key project management features:
1. Burn up charts
As we’ve mentioned, ClickUp can help you create a burn up chart to track your project.
Unlike some other burnup charts, ClickUp’s charts are super easy to read and understand! This makes it perfect for clients and customers.
ClickUp’s burn up chart is a Sprint widget in ClickUp’s Dashboard.
In ClickUp’s burn up chart, the total amount of work to do (scope lines) is grey and the vertical axis represents Sprint points (or story points).
The green line represents the work completed over time (shown on the horizontal axis).
Once you reach all work completed, the green line will intersect the grey line, signaling the projects completion.
Add additional tasks to your project or Sprint, and you will see an increase in the grey line representing total amount of work to be done.
How do you create a burn up chart in ClickUp?
- First, create or view a Dashboard
- Click on + Add a widget
- Select Sprint Widgets or search for the Burn up chart.
- Give your Burn up chart a name (this is optional, and you can rename it later!)
- Select the data and options for your Burn up chart
- Click Add Widget 🎉
However, burnup charts aren’t all that ClickUp gives you.
In ClickUp’s Dashboard, you can view other data for your projects all in one place.
Widgets are the building blocks of each Dashboard and will help you get insights on:
- Sprints
- Docs
- Tables
- Conversations
- And more!
You can even customize:
- The data source of each widget: such as data from sprint lists or custom fields
- The time period: such as a rolling 30 day period or a fixed range
- The workload type: such as sprint capacity based on a story points
Conclusion
Burn up charts are one of the most helpful ways to keep track of your Agile project’s progress. And since you can’t manage Agile software development without the right project management tool, why not download ClickUp today?
It has everything you need to manage your burnups, burndowns and sprints to keep your project progressing smoothly.


Everything you need to stay organized and get work done.

Recent Articles
Claude Skills for Project Management: A Practical Guide 
Claude Skills for Project Management: A Practical Guide
How to Write a Scope of Work (+ Examples & Templates)
How to Write a Scope of Work (+ Examples & Templates)
What Are Project Goals? Definition, Examples & How To Write Them 
What Are Project Goals? Definition, Examples & How To Write Them
