
Sorry, there were no results found for “”
Sorry, there were no results found for “”
Sorry, there were no results found for “”
Whether your team is launching a new product, updating existing features, or undergoing an agile transformation, you must track performance.
That’s where agile metrics and KPIs come into play.
They are your development team’s North Star. Agile metrics and KPIs provide real-time insights into your team’s performance and indicate potential roadblocks before they derail progress.
Keep reading to learn about the 15 most critical Agile metrics and KPIs you should monitor and how to track them using ClickUp.
Agile metrics are measurable data points that help you evaluate your team’s progress, performance, and effectiveness against set benchmarks.
For agile teams, these metrics can be qualitative and quantitative. While they can vary based on the organization and the agile development team’s goals, they answer two questions:
For an agile project, the metrics for a Scrum team are—sprint burndown and velocity, whereas for Kanban teams, the agile metrics will be—tracking throughput and work-in-progress.
Agile KPIs are agile metrics that focus on measuring the most critical aspects of your agile project’s success in the form of sprints or iterations. While agile metrics provide a broader set of data points, KPIs highlight key indicators tied to your project goals.
Here’s a brief breakdown of key points of agile KPIs:
As an agile project manager, you establish and track relevant project metrics alongside your roadmap. You must also monitor performance across all teams, identify potential roadblocks early on, and keep your project on track for success.
Metrics reveal what’s working (and what’s not): Track the right agile metrics, such as cycle time (the average time spent to complete a task), work in progress (WIP), and the number of active tasks to identify areas of slowdowns or where there’s too much on someone’s plate.
Data-driven decisions: Leverage this data to adjust workflows, redistribute tasks among your agile software team, or implement agile tools for project management to eliminate bottlenecks and streamline your team’s overall development process.
Avoid scope creep: Focusing on agile software development metrics and KPIs prevents your project from exceeding planned boundaries. Use them to monitor the progress of the agile project and address deviations before they become an issue.
Clear visibility of progress: Track your team’s performance and progress in adjusting their pace, using project metrics such as burn-down charts that visually represent the remaining work in a sprint.
Focus and prioritization: Use insights from KPI metrics like velocity—how much your team completes in each sprint—to plan effectively and prioritize tasks based on client needs and project deadlines.
Optimize team dynamics and resource allocation: Monitor and track agile performance metrics to understand your team’s performance, optimize resource availability, and ensure alignment so nothing falls through the cracks.
Quality control: Track metrics like defect escape rate to identify and address potential issues before they reach the client. This focus on quality control leads to a better product and, ultimately, happier clients.
On-time delivery: When you track metrics at different stages of the development process, you know if the project is on track to meet the deadlines.
| Kanban metrics | Scrum metrics | Lean metrics | |
| What are they | Kanban metrics are a part of the broader agile KPIs and focus on workflow and task completion. | Scrum metrics are specific metrics that track to improve their effectiveness and efficiency. | Lean metrics focus on the flow of value from an organization to its customers. |
| Metrics | Throughput Cycle time Work-in-progress | Team’s velocity Sprint burndown | Net promoter score Value delivered |
| Importance | Spots bottlenecks early on, improves forecasting and maximizes efficiency across projects | It provides visibility into the team’s effectiveness and its contribution to the business in terms of ROI | They measure performance in a system working towards continuous flow |
Assign ownership for tracking KPIs. While some, like team happiness, might be tracked by the team lead, others might require direct involvement from the development team to ensure accuracy.
Remember that your chosen KPIs should align with your workflow (e.g., Kanban, Scrum, or Lean) and ultimately support the framework selected for your project.
Bonus: 50 Agile Scrum terms you must know
Velocity is an agile metric measuring the work your team has completed during a sprint. It is usually measured by adding the estimated effort of all user story points completed in a sprint.
The prediction accuracy grows with every iteration since they’re based on past velocity.
The formula to calculate velocity is:
Velocity = Σ (Story Points of completed user stories in a sprint)
Point to remember 🧠: Velocity is relevant to a single team, and comparing the velocity of various teams can be misleading due to their varying sizes, skills, and project complexities.
A sprint burndown chart visually represents the remaining work throughout a sprint. It tracks the effort (estimated in story points) to complete all user stories committed to that sprint.
The basic components of a sprint burndown chart are:

In Agile methodologies like Kanban, cycle time goes deeper than the time it takes to complete a task. It specifically measures the average time it takes to complete a task from its entry into the core workflow stage until it’s ready for delivery.
A common way to measure cycle time is,
Cycle time = Lead time of completed work items/No. of completed work items
Net promoter score, or NPS, is a critical agile metric measuring customer sentiment and loyalty towards a product, company, or service.
NPS is based on a single survey question: ‘ On a scale of 1 to 10, how likely are you to recommend [company/product/service] to a colleague?’
NPS is a survey question, not a formula. Scores are categorized:
Point to remember 🧠: Generally, a score above 70 is considered excellent, scores between 50 and 69 are still positive, and scores below 20 are considered negative.
Value delivered goes beyond completion rates and dives into the actual business benefit created for the customer. This metric measures your project’s tangible impact on the organization’s goals.
This customer-centric metric focuses on concrete results such as increased customer satisfaction, high revenue, reduced costs, and improved efficiency.
There’s no specific formula to measure the value delivered, but it is measured through customer impact on goals (satisfaction, revenue, efficiency, etc.).
By focusing on the value delivered, an agile team can ensure consistent performance that aids a positive impact on their organization and project as a whole.
Work in progress (WIP) is a common practice in Kanban that directly impacts workflow efficiency and team performance.
WIP limits define the maximum number of tasks allowed in each stage of your Kanban board. This encourages teams to focus on completing existing tasks before starting new ones, thus reducing inefficiencies and delays.
WIP Limits define the maximum number of tasks allowed in each Kanban board stage.
In Kanban and Lean-Agile methodology, throughput reflects the overall efficiency of your workflow. It measures the rate at which your team completes tasks and delivers value to the customer.
Throughput doesn’t just track the number of tasks started; it specifically measures the number of tasks completed within a timeframe, such as per day, week, or sprint. This provides a clear picture of your team’s actual delivery capacity.
A common way to calculate throughput is,
Throughput = Number of completed tasks in a time period/Time period length
Defect Escape Rate (DER) reveals the effectiveness of your development teams’ testing efforts for the working software. It measures the percentage of defects not caught during your testing process and eventually discovered by your clients post-release.
The formula to calculate the Defect Escape Rate is:
DER = (1 – Number of post-release defects / Total number of defects) x 100%
A consistent effort to reduce DER over time highlights a strong quality assurance process.
Point to remember 🧠: A lower DER indicates a more rigorous testing process that catches defects before they impact the customer. By tracking DER over time, you can easily identify trends and evaluate the effectiveness of your testing strategies.
Code coverage is a valuable measure for Agile project management teams to assess the thoroughness of their testing efforts and identify areas where additional tests may be required.
It quantifies the proportion of code blocks executed during automated test runs. Higher code coverage generally suggests a comprehensive test suite, potentially reducing the risk of undetected defects.
The formula to calculate Code Coverage is:
Code Coverage = (Lines of code executed in tests / Total lines of code) x 100%
Work Item Age (WIA) tracks the time a work item has spent in the software development cycle, from when it’s added to the backlog until it’s completed.
WIA reveals how long tasks typically stay in project management systems. Tasks with a consistently high WIA might indicate bottlenecks in your workflow, such as resource limitations and dependencies on external factors.
The formula to calculate Work Item Age is:
WIA = Current Date – Date Work Item Added to Backlog
In Agile methodologies, where adaptability and rapid delivery are critical, blocked time illuminates the time team members spend preventing progress on their tasks.
Tracking blocked time helps the team pinpoint recurring issues that hinder flow efficiency.
There’s no specific formula for calculating blocked time; instead, track the time spent by team members unable to progress due to roadblocks to understand blocked time.
Tracking blocked time can help agile teams create an efficient flow within their work environment, minimize delays, and maximize their time spent delivering value to their customers.
Point to remember 🧠: Some common causes of blocked time could be waiting on approvals, unclear task requirements, bugs, or system outages.
Unlike sprint burndown charts that track progress within a short period, release burndown provides a high-level view of work pending for an entire release cycle, which can span several sprints.
It depicts the total remaining effort for the release on the vertical axis and the time remaining on the horizontal axis.
Release burndown charts help agile teams maintain transparency, identify risks proactively, and make data-driven decisions to ensure successful software development and release.
Control charts focus on the cycle time of individual work items (user story points, bugs, or errors).
They act as an early warning system for potential issues that could impact project delivery and also identify inconsistencies in cycle times, allowing teams to investigate the root causes. This helps them strive for a more predictable workflow.
Point to remember 🧠: Use control charts with other agile metrics, such as work-in-progress limits and throughput, to gain a more comprehensive view of your workflows.
Code churn is an Agile metric that reflects the overall changes within your code base. It measures the volume of code that was added, modified, or removed throughout the development life cycle.
Although some churn is natural, excessively high churn can indicate potential issues within the code stability.
Code churn is typically expressed in percentages and is calculated by dividing the total lines of code added or deleted during a specific period by the total lines of code in the base at the beginning.
The formula to calculate Code Churn is:
Code Churn = [(Lines of code added + Lines of code deleted) / Total lines of code at the beginning] x 100%
Team happiness surveys gauge the morale, satisfaction, and overall well-being within your agile software development teams. Gathering regular feedback allows you to identify areas of improvement in your agile processes and foster a positive work environment.
Bonus: Here are the 15 product management KPIs and metrics for product managers to achieve their goals.
Tracking Agile metrics and KPIs using spreadsheets is time-consuming and inefficient, has collaboration limitations, and is error-prone due to the lack of automation, which leads to data transfer errors.
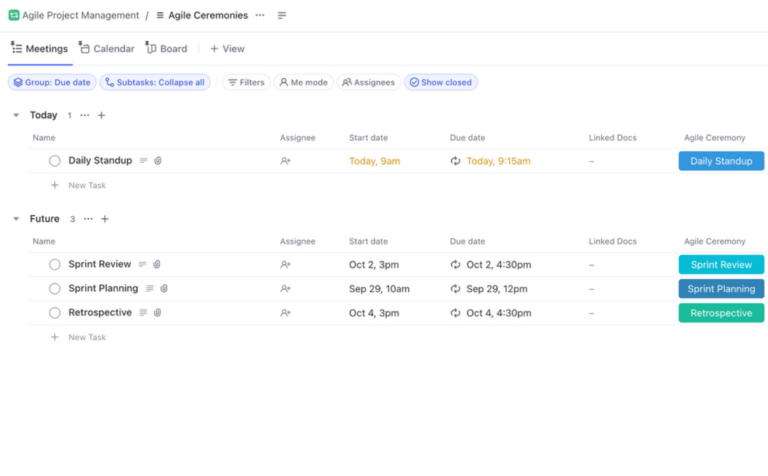
Instead, ClickUp’s Project Management Software for Agile Teams offers tools and features to automate Agile KPI and metric tracking.
Let’s see how agile teams can prioritize actionable metrics, set goals, and continuously iterate for improvement—all within a single platform.
ClickUp Goals are high-level containers broken down into smaller Targets. Think of these targets as business objectives you must achieve to meet your overall goals.
As you meet these targets, your Goals are updated in real-time.
The best part is that you can customize the Agile metrics you choose for measuring the targets.
For example:

Here’s how you can set your Agile metrics and KPIs in ClickUp Goals
Here’s how you can create and track goals on ClickUp:
Step 1: Create a goal
Step 2: Set Targets to achieve this goal
Step 3: Define the key metrics you’ll use to measure your Target progress
Step 4: Start tracking progress until you achieve the desired results
Pro tip💡: Use goal-setting templates and goal-tracking apps to ensure your goals are time-bound, specific, measurable, relevant, and achievable.

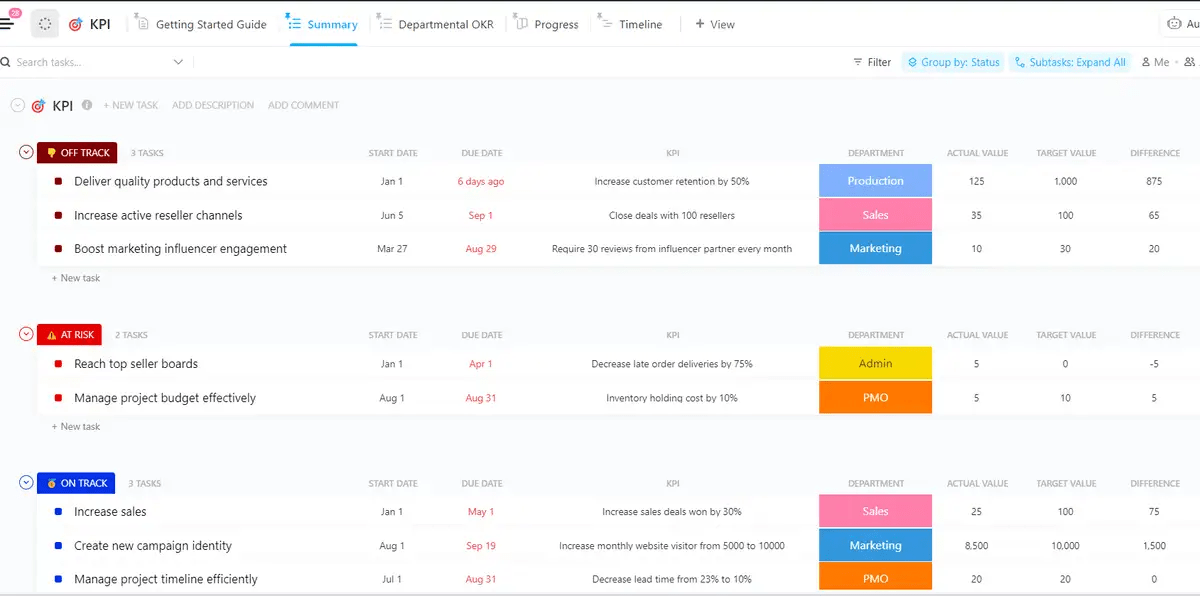
Use ClickUp Dashboards to visually represent your Agile metrics, eliminating the need for spreadsheets or external tools like Jira.
Gain instant insights into key areas like:
ClickUp’s KPI Template allows you to track a wide range of metrics. However, prioritize those that directly impact your team’s objectives, such as:
Leverage ClickUp’s Project Metrics Template to measure, monitor, and visualize the progress of your Agile metrics within ClickUp.
Schedule regular reviews to analyze your Agile metrics within ClickUp. Identify trends, introduce new metrics, refine your tracking processes as your team’s needs evolve, assess progress toward goals, and pinpoint areas for improvement.
Ideally, you’d want to monitor all relevant Agile metrics and KPIs to measure your team’s performance.
ClickUp’s agile project management platform helps you do that. Use ClickUp Goals to set goals for the most critical agile metrics, track progress with pre-built templates, measure progress with ClickUp Dashboards, and report the right metrics and KPIs to your stakeholders to build their confidence in your teams.
Centralize your metric tracking for unparalleled transparency without juggling multiple tools and spreadsheets.
Sign up on ClickUp for free to track your Agile metrics and KPIs.
In agile, a KPI (key performance indicator) is defined as specific metrics that measure your team’s performance at the end of every iteration or sprint. The benefits of measuring agile KPI metrics are continuous progress tracking, making decisions regarding the team’s workload, and gaining valuable insights into how the team works. They include velocity, sprint burndown charts, and cumulative workflow diagrams.
Metrics in the Agile methodology provide insights into productivity through the different stages of software development, assess the quality of the product, and track team performance. They can be tailored at individual and team levels. At the team level, they assess the project’s overall health, whereas at an individual level, they can be used to identify individual performance against their progress.
Agile teams use Scrum metrics and KPIs to measure the effectiveness of their team’s processes, track their progress towards specific goals, identify areas of improvement, optimize their agile workflows, and give stakeholders visibility into the project.

Manasi Nair
Max 18min read

Praburam Srinivasan
Max 21min read
Praburam Srinivasan
Max 17min read

© 2026 ClickUp