
Sorry, there were no results found for “”
Sorry, there were no results found for “”
Sorry, there were no results found for “”
The legendary Peter Drucker gave the world of business a credo: “You can’t improve what you don’t measure.” This stands true today as it did almost a century back.
In project management, too, tracking and acting on project metrics are essential for successful execution.
These metrics don’t just help you track your projects’ health; they also help control project costs. A study by the Project Management Institute reveals that almost 10 cents per dollar are wasted due to underperforming projects.
Businesses and budding project managers know how to create and manage projects with the latest tools. But, if you want to stop making the same mistakes, get more done, have fewer project failures, and use your resources better, get yourself a project management software and start tracking key metrics.
In this blog, we’ll walk you through why project management metrics are important, which ones to monitor, and what the most effective tracking methods are.
Project metrics in project management are quantitative measures used by business owners and project managers to track performance and assess the efficiency and success factors of their projects.
They help teams understand how key indicators, such as task completion rates, align goals like on-time delivery and budget consumption, to make informed decisions such as reallocating resources or adjusting timelines.
Your business improves project outcomes by analyzing project management metrics, such as increased quality, higher client satisfaction, and efficiency.
For example, consider a construction firm using cost variance (CV) metrics to monitor project expenses against the budgeted amounts. Doing so allows the construction project manager to spot financial overruns early, adjust spending, and avoid budget blowouts.
By keeping a tight rein on costs, the organization delivers successful projects within budget and boosts its reputation for financial discipline and efficiency, leading to greater client trust and satisfaction.
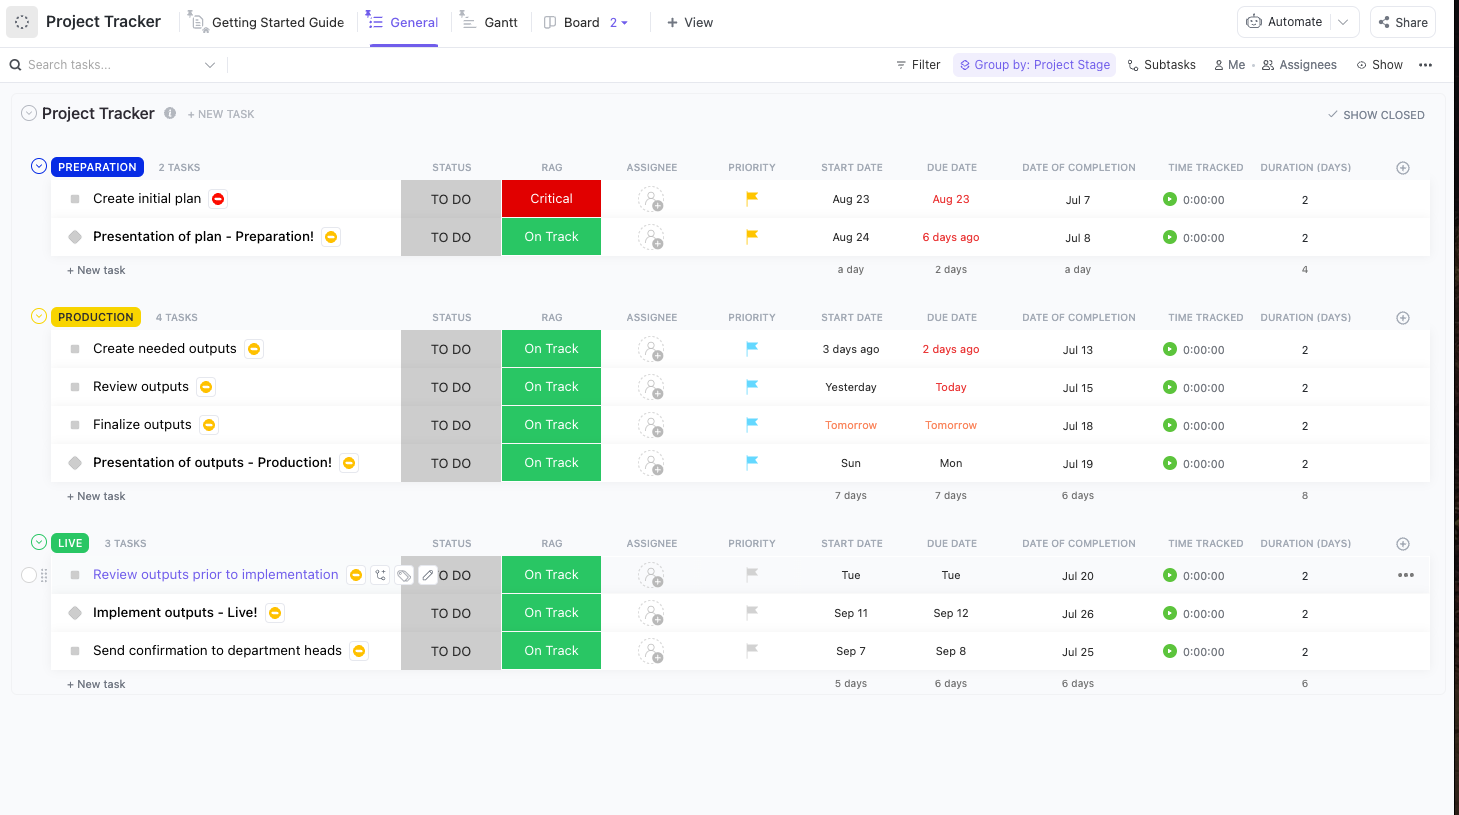
Stay on top of every project with the ClickUp Project Tracker Template. This flexible template makes it easy to organize tasks, assign responsibilities, and visualize progress—all in one place, so your team never misses a deadline.
Use it to:
According to a study by Scrum Inc., if management takes five hours or more to make a decision, the project’s failure rate increases by 22% (source). This clearly shows how important quick decision-making is.
The only way to speed up decision-making is by using project management metrics to measure and manage project outcomes. But, is this the only reason to track them? Nope! When you properly track project management performance metrics, you:
Project management key performance indicators (KPIs) are specific, strategic indicators reflecting a project’s alignment with key business objectives, such as increasing market share or enhancing customer satisfaction.
KPIs are high-level, focusing on the overall performance and long-term goals of a project, like achieving a specific return on investment (ROI) within five years.
KPIs are different from project metrics. While metrics focus on every detail, KPIs provide a broader picture, connecting project outcomes to business strategies.
Let’s differentiate project metrics from project KPIs in detail.
| Factor | Project metrics | Project KPIs |
|---|---|---|
| What are they? | Detailed measures of specific project activities or processes, such as tracking daily progress or monitoring quality control | Strategic indicators, like the net promoter score (NPS), that align with broader business objectives, such as customer loyalty or brand reputation |
| What do they focus on? | Tactical and operational aspects of the project, like ensuring on-time task completion and efficient use of resources | Strategic alignment, which means ensuring the project supports broader business goals, and long-term goals, like sustaining market leadership or innovation |
| How are they used? | Used for managing and improving day-to-day operations, such as identifying bottlenecks in the workflow | Used to guide overall project direction and assess alignment with business goals, like determining if the project is contributing to long-term financial stability |
| Examples | Task completion rates, budget variance, and resource utilization | ROI, customer satisfaction, and project alignment with business strategy |
| What’s the impact? | Provide insights, like which tasks are taking longer than expected for immediate actions and process adjustments, such as reallocating resources | Guide decision-making on a strategic level and shape long-term project outcomes, like influencing the company’s strategic shift towards a new market segment |
💡Pro Tip: Leverage Custom Views in ClickUp to visualize project metrics in a way that best suits your project. You get 15+ views to choose from!

To successfully navigate your projects, it’s crucial to track the right metrics. Understand the top 10 project metrics in the context of your business to better comprehend them pragmatically.
The gross profit margin determines your organization’s profitability. To calculate gross profit margin, deduct the costs directly linked with producing goods or delivering services from the total sales.
This demonstrates how efficiently your company is using its resources in the production process. A high gross profit margin indicates that your organization is performing well financially.
For example, a bakery selling cakes can determine its gross profit margin by comparing its production cost ($20) with its selling cost ($50).
| Formula: Gross Profit Margin = (Revenue – Cost of Goods Sold) / Revenue x 100 |
💡Pro Tip: Always analyze gross profit margin in context with industry benchmarks. If your margins are significantly higher or lower than your competitors, then you should reassess your pricing strategy, production efficiency, and supplier contracts to ensure profitability.
Customer satisfaction measures how products or services supplied by a company meet or surpass customer expectations. It shows of how well a business is performing in the eyes of its customers.
For example, if you want to assess customer satisfaction with a restaurant, you’ll look at feedback on food quality, service speed, and overall dining experience. If customers consistently report high satisfaction, it indicates that the restaurant is satisfying customer expectations.
| Formula: Customer Satisfaction (CSAT) Score = (Number of Satisfied Customers / Total Number of Survey Responses) x 100 |
🌻 Note: Customer satisfaction is usually measured through surveys, and a common way to get customer survey results to quantify it is through the CSAT. Enhance customer satisfaction by implementing a ‘continuous feedback loop’. This means regularly and systematically gathering customer feedback, analyzing it for insights, and then making changes based on what you’ve learned.
But don’t just stop there. Take it a step further by informing your customers about the changes you’ve made based on their feedback. This not only shows that you value their input but also turns customer satisfaction into a dynamic, ongoing conversation. Build loyalty and turn satisfied customers into brand ambassadors.
💡Pro Tip: Learn how to use AI in project management. See how. 👇🏼
Use ROI to calculate the profitability and efficiency of an investment. When you want to calculate the gain or loss generated on an investment relative to the amount of money invested, this is the metric to go after.
ROI is expressed as a percentage and is typically used for personal financial decisions, to compare a company’s profitability, or to compare the efficiency of different investments.
For example, if you invested $1,000 in a marketing campaign and gained $1,500 in sales, your ROI would be 50%.
| Formula: ROI = (Net Profit / Cost of Investment) x 100 |
💡Pro Tip: When calculating ROI, consider the time frame of the return. A high ROI over a short period can be more valuable than a slightly higher ROI over a much longer period. This perspective can help you make the right strategic decisions about where and when to invest, ensuring that your resources find their most efficient and effective use.
Want to understand how much money has been spent on a given project to date?
Calculate the actual cost (AC) of your project.
It represents the total cost incurred for the work performed on a project during a specific period.
It encompasses all costs, including labor, materials, and any other expenses directly related to the project.
For example, if your construction project includes costs for materials, labor, equipment rental, and permits, the AC would be the sum of all these expenses.
| Formula: AC = Total Direct Costs + Total Indirect Costs |
💡Pro Tip: Regularly compare your AC with your earned value (EV). This comparison helps identify discrepancies between what has been spent and what has been achieved. AI tools like ClickUp Brain makes it easier to make these calculations and pull up data faster.
If your AC is much higher than your EV, your project may run over budget. Monitor this comparison to make real-time adjustments and ensure better financial control and project efficiency.

EV is used for assessing a project’s progress and performance measurement by comparing the planned work with the work accomplished in financial terms.
It helps in understanding how much of the budget should have been spent, given the amount of work done so far.
For instance, if a project’s EV is lower than planned, it indicates that the project is behind schedule or over budget. Conversely, a higher EV suggests favorable progress.
| Formula: EV = Budget at Completion (BAC) x Percentage of Completed Work |
💡Pro Tip: Combine EV with other metrics like SV and CV for a comprehensive view of project health.
This allows you to track the progress of your project, including budget and schedule adherence.
You’ll be able to anticipate potential problems early and be well-placed to make necessary adjustments to keep your project on track and within budget.
SV measures the difference between the work planned to be completed by a certain time and the actual cost of work that has been completed. It helps project managers assess whether a project is ahead of or behind its scheduled timeline.
For instance, if a software development project is supposed to have five features completed by a certain date, but only three are done, SV helps quantify this delay.
| Formula: SV = EV – PV |
💡Pro Tip: Analyze SV alongside the schedule performance index (SPI). This illustrates if your project is significantly behind schedule and is not progressing as per the plan.
If your SPI is less than 1, it means you’re not making progress as fast as planned. Checking SV and SPI gives you a more nuanced understanding of your project’s timing, allowing you to make more informed decisions about resource allocation and deadlines.
CV measures the difference between the budgeted cost of work performed and the actual cost incurred for that budgeted cost of work done.
You can use it to determine whether a project is under or over budget at any point in its lifecycle.
For example, if your project was budgeted to cost $10,000 at a certain milestone, but you’ve already spent $12,000, CV helps quantify this overspend.
| Formula: CV = EV – AC |
💡Pro Tip: Track your CV in real-time or at regular intervals, not just at project milestones or completion.
This proactive approach helps you to detect budget issues early, allowing you to make adjustments before costs get out of control.
Stay ahead of the curve and ensure your project remains financially viable throughout its execution.
PV represents the estimated value of the work planned to be done at a specific point in time.
It’s a measure of what the project should have accomplished financially, according to the original budget and project schedule.
For instance, if a project’s budget is $100,000 and you plan to complete 25% of the work by a certain date, the PV at that date would be $25,000.
| Formula: PV = BAC x Planned Percentage of Completion |
💡Pro Tip: Combine PV with AC and EV for a comprehensive analysis of project health.
This trinity of metrics allows you to assess not just what should have been accomplished (PV), but also what has been accomplished (EV) and at what cost (AC).
By monitoring these three metrics, you gain a clear understanding of your project’s progress and financial status, enabling more accurate analysis.
If there’s one metric every project manager should track religiously, it’s the schedule performance index (SPI). It indicates the efficiency of time management in a project and is calculated by comparing the work performed against the work scheduled.
Essentially, SPI determines whether your project is ahead, on track, or behind schedule. For example, if an SPI value is greater than 1, your project is ahead of schedule; if it’s less than 1, you’re behind.
| Formula: SPI = EV / PV |
💡Pro Tip: Use SPI as a standalone metric and in conjunction with other performance indices, like CPI.
By analyzing SPI and CPI together, you get a more holistic view of the project’s health, both in terms of project budget and schedule.
This dual analysis can help you identify whether issues arise from time management, budgeting, or both, allowing you to take targeted and corrective actions.
Wondering if you’re getting good value for the money you’ve invested in a project? The cost performance index (CPI) can help. It measures the cost efficiency and financial effectiveness of a project. It’s calculated by comparing the value of the work performed (EV) with the actual cost incurred.
. For example, a CPI greater than 1 indicates that you’re under budget, while a CPI less than 1 shows you’re over budget.
| Formula: CPI = EV / AC |
💡Pro Tip: Use CPI as a predictive tool. Analyze CPI trends from the early stages of the project to forecast potential budget overruns or underutilization of resources.
This foresight allows for proactive adjustments, such as reallocating funds or revising procurement strategies.
So, don’t just use CPI to assess the current financial health of your project; use it to predict and shape its future financial trajectory, ensuring more efficient and economical project management.
➡️ Read More: Success Criteria Examples to Enhance Project Outcomes + How to Define and Measure Them
To achieve successful outcomes for your project, it’s vital to select the right and most effective project metrics. Focusing on key indicators will provide valuable insights into your project’s progress metrics, improve performance, and allow you to make informed decisions. Let’s explore the best practices and select effective project metrics.
Before diving into the metrics, you must first define your project management goals. What are you aiming to achieve? Increased efficiency? Cost reduction? Understand your endgame to smartly choose metrics that align with your objectives.
Remember, your metrics should be a roadmap to your goals, not just random data points. For example, if your goal is to improve customer response time, choose to focus on relevant metrics like average handling time or customer satisfaction scores.
Every project has different stakeholders, each with unique needs and perspectives. Identify who they are for your project—team members, customers, investors, and understand what’s important to them.
This understanding will guide you to select metrics that are relevant and meaningful to all the parties involved. Let’s assume that investors are key stakeholders. In such cases, focus on metrics like ROI and gross profit margin.
Assess your project requirements to determine the key deliverables and constraints.
This analysis will help you to identify the critical aspects to monitor and measure, so you can choose metrics that are directly tied to project success.
For instance, in a cost-sensitive project, key metrics might include CV and CPI.
Choose project metrics that are easily and accurately measurable. Avoid using abstract or vague metrics.
Here, relevancy is key. It’s important to ensure that the metrics you select directly contribute to the project’s objectives and provide actionable insights.
For instance, if you want to track financial performance, then choose measurable metrics like gross profit margin or ROI.
📮ClickUp Insight: 92% of workers use inconsistent methods to track action items, which results in missed decisions and delayed execution.
Whether you’re sending follow-up notes or using spreadsheets, the process is often scattered and inefficient. ClickUp’s Task Management Solution ensures seamless conversion of conversations into tasks—so your team can act fast and stay aligned.
Project performance assessment is not a one-off activity. As a result, you must regularly review the effectiveness of your chosen project management performance metrics.
Are your chosen metrics providing the insights you need? If not, don’t hesitate to adjust or replace them. This flexibility ensures that your metrics stay aligned with the evolving nature of your project.
If SV does not provide clear insights into project timing, consider integrating the SPI for a more detailed analysis.
Now that you’ve chosen the right project management metrics to gauge your project’s success, it’s time to gear up with the right tools. Here’s how to go about it.
Effective project planning and metrics rely on clear goals. The ClickUp Goals feature allows you to create and track goals that are directly connected to your project activities.
By breaking down each goal into measurable targets, your project managers can easily monitor progress and ensure alignment with the project objectives.
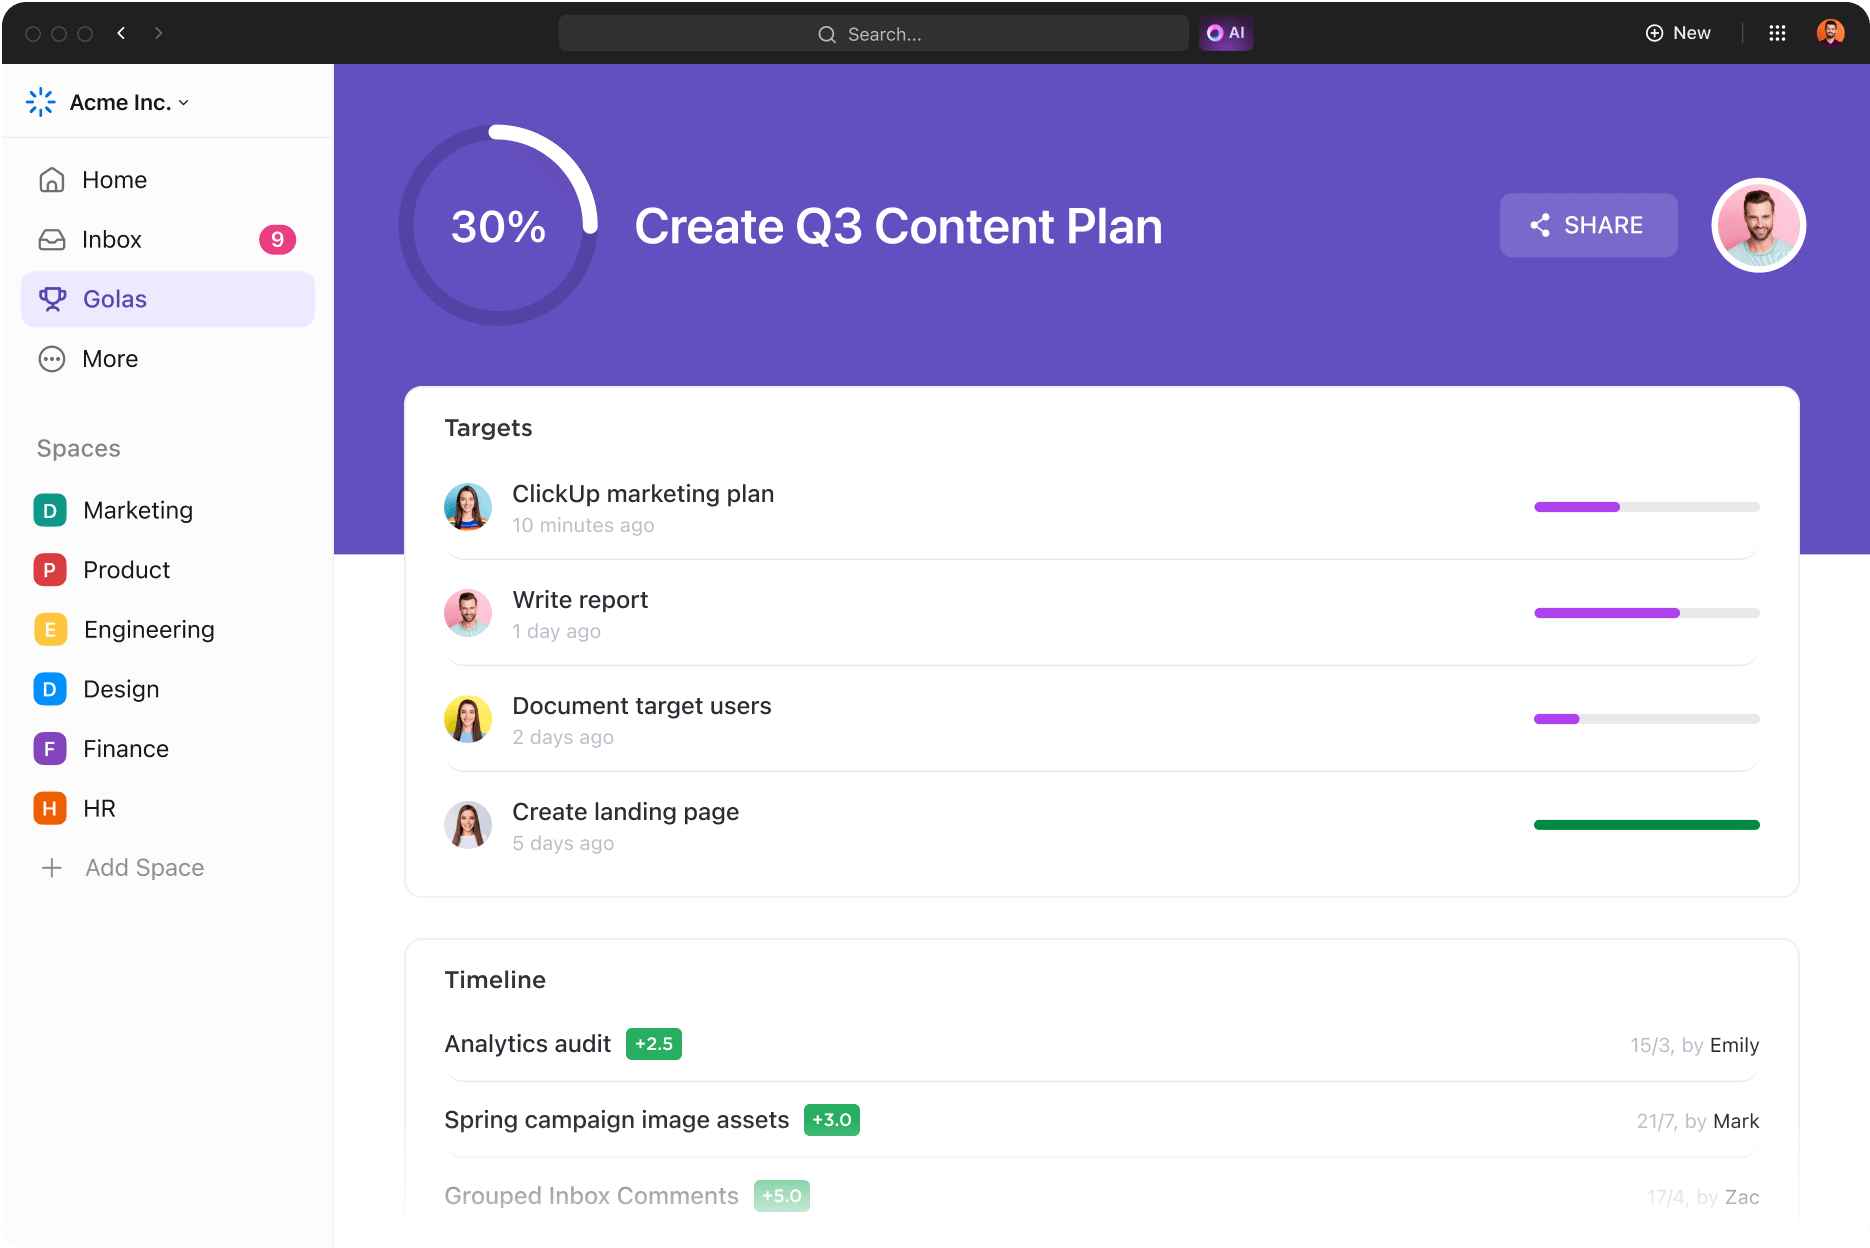
Remember, though, that implementing project metrics isn’t just about setting goals but making goals visible, tangible, and integrated with your day-to-day work.
➡️ Read More: Free Multiple Project Tracking Templates
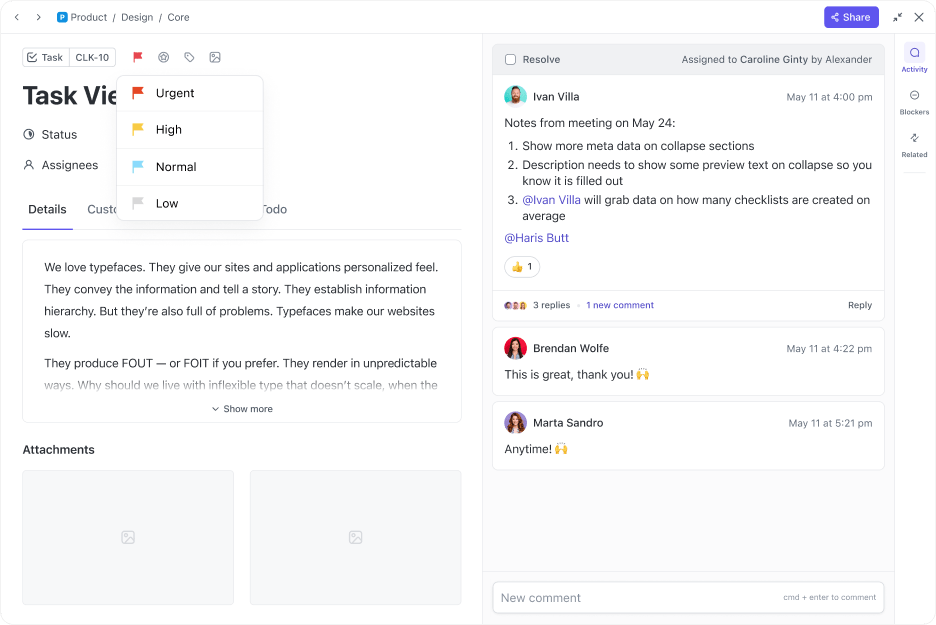
ClickUp Tasks will help you streamline your workflow and increase productivity. You can plan, set, and track tasks and break them down into sub tasks and checklists to create a structured approach to your project.
Each task can be aligned with specific project metrics, making tracking straightforward and systematic.
This helps project managers to effectively manage the small details and understand how they contribute to the overall project.
Visual tools can be incredibly powerful for tracking project progress, and ClickUp Gantt charts are no exception. They offer a dynamic way to visualize your project timeline, dependencies, and performance.
Such charts help project managers with a clear and easy-to-understand view of how different tasks and project milestones line up against your schedule.
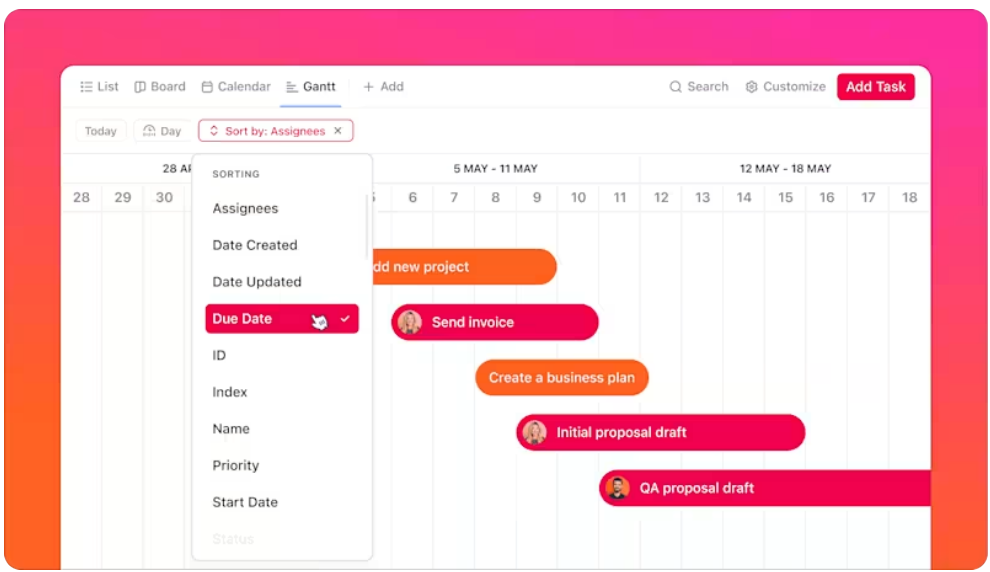
With drag-and-drop adjustments and real-time updates, these Gantt charts are perfect for keeping a close eye on your project’s trajectory, helping ensure everything is moving according to plan.
Data is only as good as the insights it provides. ClickUp Dashboards feature is of great help to project managers here. It transforms your project metrics into actionable insights. Use it to get access to detailed reports that delve into time estimates, who’s behind schedule, what’s being worked on, and who’s ahead.

By offering insights into both the macro and micro aspects of your project, ClickUp’s reporting tools help you stay on top of your game, ensuring that every aspect of your project is progressing as planned.
➡️ Read More: How to Conduct A Successful Project Post-Mortem [Steps, Benefits, & Mistakes to Avoid]
Establishing effective project performance metrics is essential for tracking progress, ensuring accountability, and achieving strategic outcomes.
To accurately measure and improve project execution, you can use the following best practices:
✅ Align metrics with project goals
Begin by identifying relevant performance indicators that reflect your project’s objectives. Whether improving stakeholder satisfaction, tracking completed tasks, or monitoring actual cost performance, your metrics should be tightly aligned with project-specific goals to remain project-focused.
✅ Incorporate both cost and schedule metrics
A balanced view of performance should include both actual schedule performance and actual cost performance compared to the planned schedule and budget. Use tools like the Schedule Performance Index (SPI) to gauge timeliness and identify potential delays before they impact major project deliverables.
✅ Track key performance indicators (KPIs) regularly
Use project management tools to streamline tracking project metrics such as actual progress, productivity metrics, and resource allocation. Consistent data collection allows for timely insights into project health, enabling teams to respond quickly to issue.

✅ Focus on stakeholder and customer satisfaction
Incorporate feedback mechanisms to monitor stakeholder satisfaction and assess the Customer Satisfaction Index. These human-centric KPIs help ensure the end product aligns with expectations and builds trust with project stakeholders.
✅ Support proactive risk management
Good metrics help identify threats early. Integrate risk management indicators and leverage them for proactive risk management. Tracking potential risks alongside your core metrics ensures you can act before problems escalate.
✅ Use metrics to optimize project performance
Your metrics should provide insights into optimizing resource allocation, refining schedules, and improving overall efficiency. The goal is to continuously optimize project performance by learning from both successes and shortfalls.
✅ Measure work performed, not just planned
It’s crucial to evaluate the work performed in contrast to the project schedule. This helps in understanding gaps between intention and execution, enabling realistic planning for future project tasks.
Remember, project management and project metrics aren’t a solo show; they require a collaborative effort. Share the insights and tips you’ve gathered from this article with your team to ensure everyone understands the significance of these project success metrics and their impact on project success.
Take it up a notch by gathering your key team members for a strategic session on integrating ClickUp’s features into your daily workflow. This is an opportunity to brainstorm, identify potential challenges, and collectively determine the most effective ways to utilize these tools for tracking project metrics.
Ready to optimize your project management process with ClickUp?
Sign up to ClickUp for free today!
Also, consider using the ClickUp mobile app and unlock the possibilities for every team member to perform better.
1. Why are project metrics important in management?
Project metrics are important in management as they provide quantifiable means to track and assess the progress and performance of a project.
They offer critical insights into various aspects like cost efficiency, schedule adherence, and overall project health.
By using these metrics, project managers can make informed decisions, identify areas needing improvement, measure performance, and ensure resources are utilized effectively.
2. How can I track the success of a project using metrics?
To track the success of a project using metrics involves selecting the right KPIs that align with your project goals.
Start by defining clear objectives, then choose metrics that directly measure these objectives. Regularly monitor these metrics to assess progress, and identify any deviations from the plan.
For example, if timely delivery is a goal, track metrics like SV or SPI.
3. What are the different types of project metrics?
The different types of project metrics fall into several categories, each focusing on specific aspects of project management:
Each type of project metric offers unique insights, and selecting the right combination is key to effectively tracking and managing a project’s success.

Praburam Srinivasan
Max 22min read
Praburam Srinivasan
Max 24min read

Manasi Nair
Max 18min read

© 2026 ClickUp