

Kanban is among the most popular of the various lean software development methodologies, such as Agile, Scrum, extreme programming, DevOps, etc. Kanban—meaning ‘signboard’ in Japanese—is a visual methodology for managing work from start to finish across various stages, displayed on an interactive board.
Agile Kanban Metrics to Track & Measure Efficiency in Projects

When you look at a Kanban board, how do you know if you’re doing well?
- Are you completing enough tasks?
- Are you completing them fast enough?
- Is the team productive?
- Are there any steps in the process causing delays?
To answer these questions and more, software development teams use Kanban metrics.
Kanban metrics are key performance indicators (KPIs) used by agile software development teams to measure performance. They are numbers that guide developers, testers, DevOps professionals, and project managers towards improving their outcomes.
In this blog post, we discuss the commonly used Kanban metrics and how you can incorporate them into your projects to measure the team’s performance.
Top Kanban Metrics to Track in Agile Projects
Depending on your project’s goals, tasks, duration, and team structure, you can use any metrics to evaluate your work. Across all these dimensions, the following five are deemed core Kanban metrics.
Throughput
Throughout is the amount of work you’ve completed in a given time period, such as day, week, or sprint. Typically, ‘work’ is measured as the tasks completed, moving from the first to the last stage on the Kanban board.
A software development team’s throughput could be measured as the number of user stories developed in each sprint. This metric is used to:
- Measure individual productivity
- Measure team productivity
- Plan future projects accurately
Lead time
In the Kanban system of agile project management, lead time measures the duration from when a task was added to the board until it was marked complete. It is the duration of the workflow.
For example, if it takes six weeks from the time you add a user story to the backlog until it is developed and deployed, your lead time is six weeks. This metric is used to:
- Schedule tasks
- Allocate resources
- Optimize workflow
Cycle time
Cycle time is a part of lead time and focuses only on the time the team works actively on a task. On the Kanban board, this could begin when someone marks a task as started/working to when it’s marked complete.
In the above example, if the user story is developed in one day, after staying in backlog for over five weeks, the cycle time is one day. This metric is used to:
- Measure efficiency
- Optimize process to accelerate active work
Work-in-progress (WIP)
Work-in-progress refers to the number of tasks in the active stages on the Kanban board. These tasks are neither backlog nor completed, i.e., they are believed to be actively worked on.
This could be tasks in stages such as in-progress, development, testing, code review, etc. Project managers use this metric to:
- Track team workload
- Manage backlog better and eliminate overwhelm
- Identify bottlenecks
This brings us to the next and last of Kanban metrics: Process bottlenecks.
Process bottlenecks
As the name suggests, bottlenecks are parts of the process with less capacity than the rest, creating congestion in the workflow.
For instance, if you have ten developers pushing 20 features every week, with only one senior developer who can perform code review for two of them, you’ve created a bottleneck.
Agile/Kanban teams use bottlenecks as a metric to:
- Measure process efficiency
- Iron out gaps and congestion
If you’ve been learning about agile, DevOps, Scrum, Kanban, etc., you know that these metrics are used across methodologies. Let’s examine their similarities and differences.
Scrum vs Kanban: Similarities and Differences
Scrum is a project management methodology that breaks work into small parts towards a goal to be achieved in a specific time, known as a sprint. The Kanban method is visual, laying tasks over a series of steps that form a workflow.
Scrum and Kanban focus on breaking big projects into small, manageable tasks to eliminate bottlenecks, facilitate continuous improvement, and optimize workflows. However, there are subtle differences too.
| Scrum | Kanban |
|---|---|
| Schedules work in sprints (1-4 weeks) | Uses artifacts, such as backlogs, product increments, etc. |
| Uses artifacts, such as backlogs, product increments, etc. | Uses artefacts, such as Kanban board and tasks |
| Offers benefits of higher productivity, throughput and quality | Offers benefits of better visibility and continuous improvement |
| Processes are tighter with pre-defined roles in the Scrum team, such as Scrum master, product owner, and development team | Processes are adaptable with a project manager guiding the team |
| Best for teams with clear priorities that don’t need change within each sprint | Best for teams with constantly evolving priorities |
Both Scrum and Kanban methodologies use similar key metrics for evaluating performance. In fact, the Kanban metrics we discussed above can also play a meaningful role in Scrum project management. Here’s how.
Throughput: This Kanban metric illuminates the development velocity of Scrum teams. At retrospectives and sprint planning meetings, Scrum teams can use the data from this metric to improve forecasting and scheduling.
Work-in-progress: In Kanban’s continuous flow of tasks, WIP refers to active tasks. This is a great parallel to the tasks committed to a sprint in Scrum. With WIP, Scrum teams can calculate development velocity, productivity, and efficiency.
Cycle time and lead time: In Scrum, typically, cycle time is the sprint (of 1-4 weeks). However, lead time can start the day the business team requests a feature and continue until the day it’s finished. By measuring lead time, Scrum teams can monitor the speed at which they respond to market changes and business needs.
Bottlenecks: A Kanban board clearly shows how many tasks are stuck in the stage just before the bottleneck. Scrum teams can use this data to optimize their processes in real-time during the sprint itself.
If you’re interested in considering Kanban metrics for your projects, here’s how to measure them.
How to Measure Kanban Metrics
The philosophy behind all lean management methodologies is simplicity. In that sense, Kanban metrics are also simple to use. Here is the step-by-step process for measuring agile metrics.
1. Identify the metrics you want to measure
The core Kanban metrics are throughput, lead time, cycle time, WIP, and process bottlenecks. However, these are not the only ones. Teams often use metrics such as workload distribution, progress towards goals, etc.
Before you set up your KPI metrics, identify those that matter to you. While you choose, consider good and bad metrics. Good metrics are:
Understandable: Complex metrics are difficult to understand, making them less likely to be embraced. Good metrics are easy to understand and simple to measure.
Meaningful: To matter, an excellent metric needs to be meaningful to the team. For instance, features developed are meaningful to the developer, bugs identified to quality analysts, and deployment frequency to DevOps teams.
Actionable: A good metric offers insight, enabling action. For instance, if your lead time and cycle time metrics differ vastly, you can identify the root cause and make improvements.
Relevant: A good metric is relevant to business goals. For instance, procurement KPIs contribute to the cost of goods sold, and throughput measures how soon a business can respond to market changes.
Contextual: If you measure productivity as the number of features developed and set a specific target, you might lose out on quality in pursuit of speed. To be effective, your metric needs to be contextual.
2. Collect data needed for Kanban metrics
To accurately measure performance on any metric, you need data. For example, to calculate throughput, you need to track the number of tasks being worked on/completed over a given period, organized by the team members responsible.
You need to know the start and end dates of every task to calculate lead time or cycle time.
3. Benchmark and goal-setting
Metrics for the sake of metrics are meaningless. So, identify benchmarks. You can do this by understanding the standards in your industry or businesses of similar size.
Over time, you can use your performance as the benchmark and strive for continuous improvement.
4. Visualize your project metrics
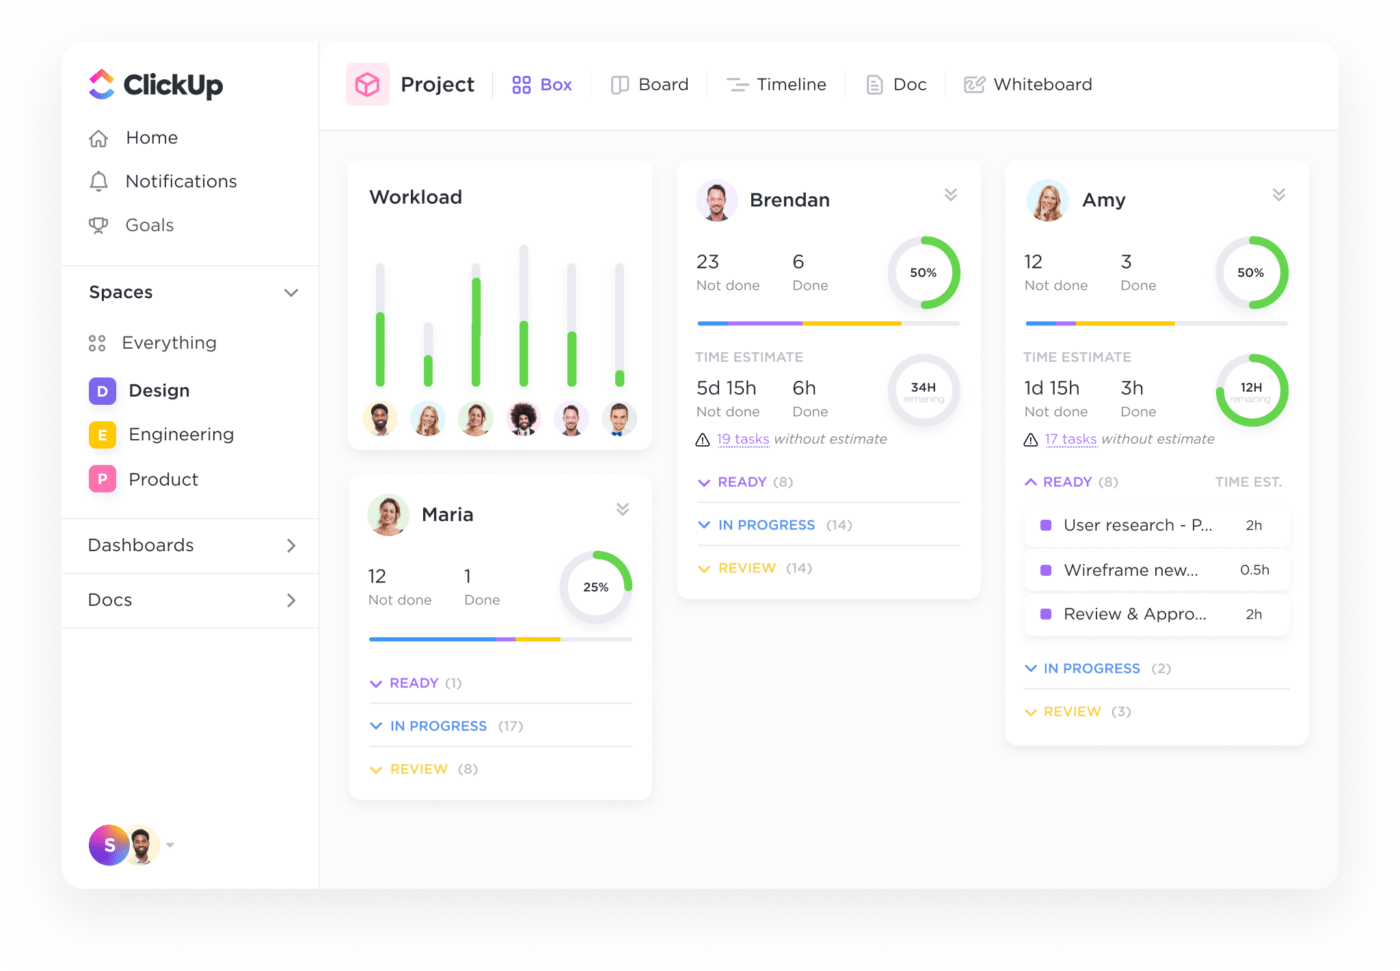
Fundamentally, Kanban is a visual methodology. It helps to set up project metrics visually on a Kanban board.
- Laying all tasks on a Kanban board helps instantly see how many tasks are in progress, done, or yet to begin
- Timeline charts help identify bottlenecks
- Workload graphs show the productivity of each team member

5. Explore deeper performance measurement
Core metrics offer the foundation for performance measurement. However, for great efficiency and productivity, explore deeper.
For instance, you could track iterative and incremental development metrics by connecting features and calculating consolidated cycle times. In an online shopping platform, you might break down the checkout functionality into features, such as add to cart, wishlist, instant checkout, buy now, pay later, etc.
Once all these features are developed, track metrics for the functionality to measure performance on your iterative development practice.
Now that you know how to measure, here’s the value it can deliver.
The Role of Kanban Metrics in the Software Development Process
Kanban metrics can be a great way to measure, improve, and elevate your performance in any lean software development practice. Here’s how.
Speed and velocity
Kanban metrics such as throughput, lead time, and cycle time measure the speed at which you complete tasks. By extension, it also shows how much work you can get done at any given time.
Flow efficiency
Work-in-progress and throughput show how efficiently you can complete your committed work. By identifying bottlenecks, you can improve efficiency continuously.
Clarity
Through their simplicity and relevance, Kanban metrics enable everyone on the team to understand their roles and goals clearly. When team members know how they are performing, they will be motivated to do better.
Ownership
Agile, Scrum, and DevOps methodologies expect self-organizing teams to ‘pull’ tasks from the backlog and collaborate effectively to get work done. Kanban metrics enable self-evaluation and foster ownership.
Focus
You can measure dozens of factors through every project: the Number of team members onboarded, hours worked, programming languages used, unproductive days, promotions, etc. Yet, these vanity metrics offer little or no value to performance.
Good Kanban metrics help the team stay focused. For example, cycle time contributes to adaptability, which leads to business agility, which, in turn, increases revenue. This line of sight, from their code to business outcomes, helps every team member stay focused.
Convinced? Let’s see how you can use them in your software development process.
Unleashing the Power of Kanban Metrics
Kanban metrics can give you visibility, identify gaps, inspire ideas, and optimize processes all in one go. Here’s how you can increase productivity and efficiency using Kanban metrics.
Measure what matters: Focus on the Kanban metrics suitable for your team. If you’re an early-stage startup, throughput and cycle time might be important to you. If you’re a large enterprise team, WIP might naturally be bigger.
Be strategic: Connect your metrics to business goals. Throughput is a great metric if your business aims to build a feature-rich product. Your process bottlenecks are critical if you’re a solopreneur building a differentiated product.
Make them visible: Create dashboards that everyone on the team can access. While you might not see performance improvements daily, tracking leading indicators can be helpful. For instance, tracking time for each task can help predict cycle time.
Discuss them regularly: Use sprint planning, retrospectives, and other Agile/Scrum events to discuss performance on Kanban metrics. Debate root causes and innovate potential solutions.
Continuously improve: Continuous improvement in agile applies to not only what you’re developing but also how you’re tracking performance. Continuously evaluate your metrics. Once your cycle time is optimized, move to lead time. When your team size grows, adapt your Kanban metrics accordingly.
While you’re at it, you might face challenges. Here are the challenges you’ll likely face and how to overcome them.
Kanban Metrics: Challenges and Solutions
Today’s software development projects are complex, with dozens of moving parts at any given time. They are a matrix of people, processes, and technology that needs to be managed effectively.
There are plenty of challenges in that process. Robust project management software can help overcome many of them.
1. Lack of data
To measure performance, you need data. Most agile development teams collect data using gut instinct or post-facto evaluation. For instance, developers might say, “I took two days to develop this feature,” which is a rough estimation.
Gather accurate data using agile estimation techniques to solve this problem. ClickUp has tools to collect all the data you need.
- Time-tracking for capturing every minute spent on work
- Start-date and end-date for every task and sub-task to calculate cycle/lead times
- Dependencies to identify bottlenecks
- Assigning users to tasks to measure individual productivity

2. Lack of insights
Even when you have data, sometimes insights can be hard to glean. Project managers often spend hours putting together data in spreadsheets and making calculations.
ClickUp Dashboards are designed to overcome exactly these challenges. Track tasks, productivity, efficiency, and utilization with real-time customizable dashboards. Some of the most commonly used reports, included in various Kanban board templates, are:
- Cumulative flow diagram
- Burnup and burndown chart
- Project/task status
- Goal accomplishment and progress towards targets

3. Lack of actionable information
Let’s say your average cycle time is three weeks. If you want to reduce it, what can you do? ClickUp’s reports are designed to help you make decisions.
For instance, you can see the Workload view to understand who is working on what, what skills are available, etc., to allocate resources effectively. If you need a Python developer to reduce your cycle times by a week, you can use the Workload view to find one who is available.
4. Overload of project management admin
Managing an agile software development project involves many admin tasks, such as assigning tasks, changing statuses, sending notifications, applying checklists, and so on. Performing all these tasks creates unnecessary delays and bottlenecks, affecting project management KPIs.
ClickUp Automations has 100+ workflows that you can put on autopilot instantly.

Leverage Kanban Metrics for Project Management Success With ClickUp
Agile engineering is built on the foundation of continuous feedback and iterative development. Product teams build, launch, monitor, and improve their outcomes in short cycles.
Tracking Kanban metrics is fundamental to this. To make the most of Kanban metrics, software engineering teams need robust, flexible, feature-rich project management software like ClickUp.
ClickUp lets you collect data, track trends, visualize insights, and build optimization strategies where you track your tasks. It gives project managers a 360-degree view, while every team member can see granular reports of their performance.
See how ClickUp can transform your project management. Try ClickUp for free today.
FAQs About Kanban Metrics
1. What are the metrics used in Kanban?
Kanban teams use several metrics throughout the project management lifecycle. The core Kanban metrics are Throughput, lead time, cycle time, work-in-progress, and process bottlenecks.
2. What are the 5 elements of Kanban?
According to David Anderson, author and Kanban coach, the 5 elements of a Kanban board are:
- Visual signals: Cards, stickie notes, etc., that have one task/idea/user story each
- Columns: One column for each stage in the workflow
- WIP limits: Maximum number of cards in a column at a given time
- Commitment point: The stage that signifies work having begun (where the cycle time starts)
- Delivery point: The stage that signifies work is completed (where cycle time ends)


Everything you need to stay organized and get work done.


