

We’re all familiar with using key performance indicators (KPIs) to monitor our progress against goals over time. Your manager might monitor your KPIs, or you might be in charge of setting them for your team.
What good is all this data though if you don’t do anything with it?
That’s where KPI reports come in. In this guide, we’ll go into detail about what KPI reporting is, why it’s important, which metrics you should track, and more. Let’s dive in and explore all there is to know about building and managing KPI reports. 🙌
- What Is a KPI Report?
- Why Is KPI Monitoring & Reporting Important?
- Metrics vs. KPIs: What Makes Them Different
- Metrics You Will Probably Want to Include in KPI Reports
- The 3 Common Types of KPI Reports to Know
- How to Create a Dependable and Insightful KPI Report
- 9 KPI Report Examples and Templates to Simplify the Process
- 1. ClickUp Balanced Scorecard Whiteboard Template
- 2. ClickUp Company OKRs and Goals Template
- 3. ClickUp Learning and Development Project Template
- 4. ClickUp Monthly Business Status Report Template
- 5. ClickUp OKR Framework Template
- 6. ClickUp Quarterly Business Review Template
- 7. ClickUp Sales KPI Dashboard Template
- 8. ClickUp Warehouse KPI Dashboard Template
- 9. ClickUp Weekly Status Report Template
- Make KPI Reporting Easier With ClickUp
What Is a KPI Report?
A KPI report is a physical or digital file that compiles performance data over all the KPIs you’re currently tracking. It’s essentially the place where all your KPI data is consolidated—usually in a KPI dashboard—so it’s easier for you to make sense of your data and evaluate your key performance indicators.
KPI reports are typically highly visual, so you and your team members can interpret the data quickly to identify trends or challenges across business objectives.
Many teams use a KPI dashboard as the visual interface for monitoring KPIs, with the reports themselves behind it offering additional data and information.
Why Is KPI Monitoring & Reporting Important?
KPI reporting gives you a way to understand your performance against all your most valuable KPIs in one place. That alone makes it valuable, but investing in the way you monitor key performance indicators brings you additional benefits.
The best KPI reports enable you to:
- Visually track your most important metrics (again, usually from visual KPI dashboards)
- Track historical data and set benchmarks and targets for the future
- Customize and identify KPI reporting metrics, trends, and patterns
- Identify bottlenecks, issues, and project constraints
- Demonstrate your value or progress to stakeholders
- Access detailed insights and performance data to make business decisions

KPI reports aren’t just a better option for data visualization—they guide you toward your goals, monitor your progress, and demonstrate your success so far. 🏆
Metrics vs. KPIs: What Makes Them Different
While KPIs and business metrics seem similar, there’s one key difference. Here’s how you distinguish between KPIs and business metrics:
- If a metric tracks your performance over a key business goal, it’s a key performance indicator
- If a metric tracks your performance over any (core/non-core) business goal, it’s a business metric
Think of KPIs as a subset of business metrics that only focus on what matters most to your business.
For example, a key performance indicator within the sales team might be total sales. It’s data points the whole team can measure and monitor over time. Additionally, these data points influence other areas of your operations—think marketing KPIs.
A related business metric would be turnover rate, which is a factor that’s influenced by the number or volume of sales, but has a much wider reach. ✅
Metrics You Will Probably Want to Include in KPI Reports
Although KPIs and metrics are different, both have their place within a KPI dashboard. As you report your progress against individual KPIs, it’s useful to visualize these against your overall business metrics—the figures that define your success against your goals.
Some companies consider metrics to be only the overarching highlights, while others use metrics and KPIs much more interchangeably. The KPI metrics that matter to you depend on your industry and role, but common metrics to feature in KPI reports include:
- Total sales
- Customer retention
- Customer satisfaction
- Market share
- Employee happiness
- Customer acquisition cost
- Customer lifetime value
- Return on investment
- Churn rate
- Net profit margin
- Revenue growth
- Conversion rate
- Cash flow
Consider which business metrics and KPI examples align closely with your role and responsibilities, and feature them in your KPI reporting process. Doing so gives you a stronger view of how your individual KPIs are linked to success on a bigger scale.
The 3 Common Types of KPI Reports to Know
Most business KPI reports are incredibly comprehensive and are capable of handling all kinds of performance data.
However, there are still three distinct types of reports that you use for different purposes:
1. Operational reports
Operational reports focus on your actual performance over the day-to-day operations of your business. The data points in operational reports are monitored on a regular basis to evaluate your actual performance over daily, repetitive activities, and business objectives. 💰
Examples of operational reports include:
- Sales (monthly, quarterly, or annual)
- Cash flow
- Debtors or creditors
Tracking these metrics and KPIs regularly gives you an insight into performance and creates the opportunity to adjust based on potential roadblocks, challenges, or opportunities. Teams that monitor their sales or cash flow regularly get the chance to take action faster, leading to fewer issues and more growth.
2. Analytical reports
These reports are focused on giving you detailed analytical insights into your key metric performance. They usually highlight performance indicator trends that show whether you’re moving in the right direction. 🌻
Examples of analytical reports include:
- Year-on-year or quarterly sales growth
- Customer retention rates
- Customer satisfaction scores
For long-term tracking, a Year-over-Year Growth Calculator can make it easier to measure progress and spot trends at a glance.”
Analytical reports serve as a useful benchmark for where you are now, where you’ve been, and what your future might look like. Use these reports to reflect on what has worked well, and identify areas that require change or improvement before they become a future problem.
3. Strategic reports
Strategic reports focus on giving you detailed insights into the current status of your business strategy, business health, and where things are heading. Decision makers use these reports for actionable insights into their further growth. 📈
Examples of strategic reports include:
- Percentage of sales from a specific product, marketing campaign, or region
- Market share over time
- Upcoming projects
These strategic reports give your decision-makers and stakeholders valuable data so they can make the most informed decisions. Identifying a spike in trends from one marketing campaign means you can prioritize spend and adjust other campaigns to make the biggest impact.
Monitoring your incoming project list offers confidence that your workflow is steady or motivation to strike up new deals.
How to Create a Dependable and Insightful KPI Report

You understand your overall business metrics and your overall KPIs. Hopefully, you can see the value of a KPI dashboard or report to truly unlock insightful data points.
Now, let’s show you how to build your own KPI report to better plan, build, and share your metrics with the help of KPI software.
1. Define your goals
Decide what you’re trying to achieve with your KPI reports. Confirm your objective for the report, how it will be used, the main audience, and how you’ll share it.
These criteria not only allow you to understand your own strategic goals better, but they also inform the way you approach the design and functionality of the report itself. 🎯
2. Decide which specific KPIs to track
There are hundreds of KPI reporting examples that you could monitor, but you don’t need to cover all of them. Decide which KPIs are the most valuable according to your objectives, and prepare the data so that it’s ready to display.
Interrogate your internal records to see whether you already track this KPI, or whether you need to set up a new system. Reflect on whether the data source is accurate, who’s responsible for keeping it updated, and any steps you need to take before you can use it in your report.
KPIs don’t always have to relate to monetary values or production numbers. Some KPIs you may want to consider revolve around time management.

That’s why ClickUp’s rolling time feature within Dashboards is a great choice for tracking tasks across various Spaces and within a specific timeframe.
3. Choose how to visualize your KPIs
Raw KPIs are often in the form of numbers or statements and aren’t easy to understand at first glance. To make your KPI reports useful, you need to use data visualization to communicate your business performance in a more meaningful way.
Decide the best way to present your data, then design charts, graphs, and diagrams with a data visualization tool. Keep your presentation simple.
The goal is to communicate insights and trends quickly. Stakeholders and managers can always dive deeper into your KPI reporting examples if they want to extract more detail. 📊
4. Use software to build a KPI report
Manually creating your own KPI reports is time-consuming and can introduce the opportunity for errors. There’s a much better way to build and monitor your KPI reports—and that’s with ClickUp Goals.
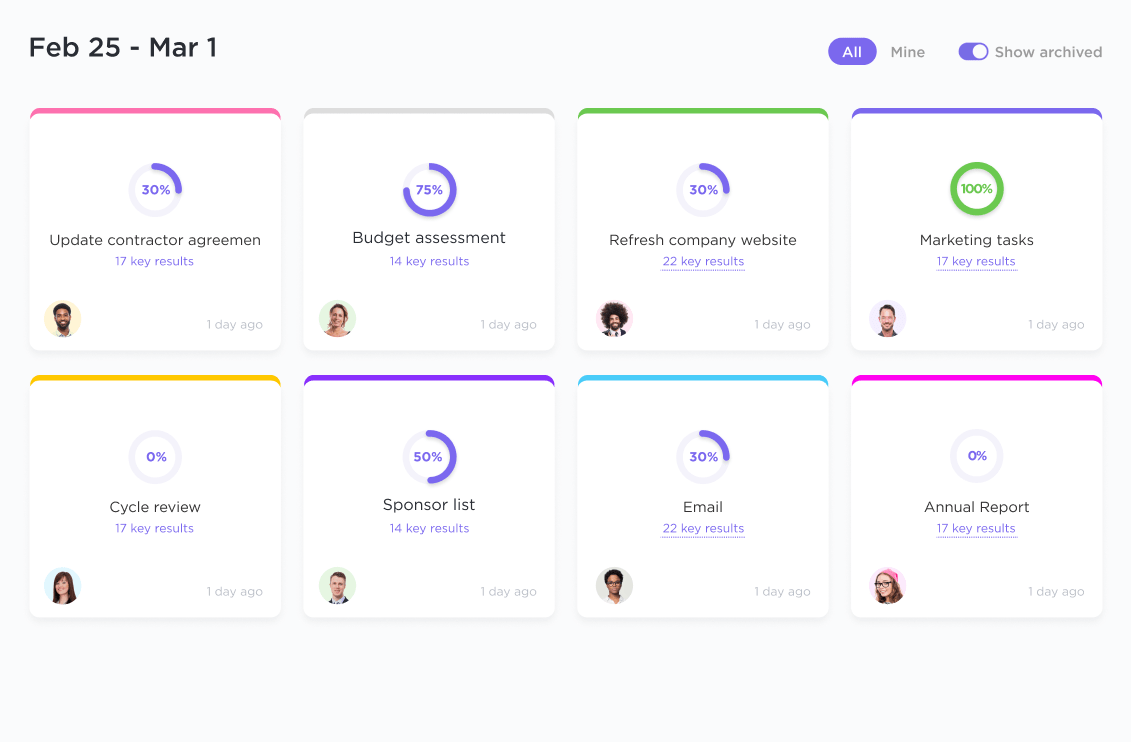
ClickUp Goals introduces a new way for your team to track objectives and key results (OKRs) and goals. Our highly visual platform empowers your team members to stay on track, thanks to clear targets, user-friendly timelines, and automatic progress tracking.
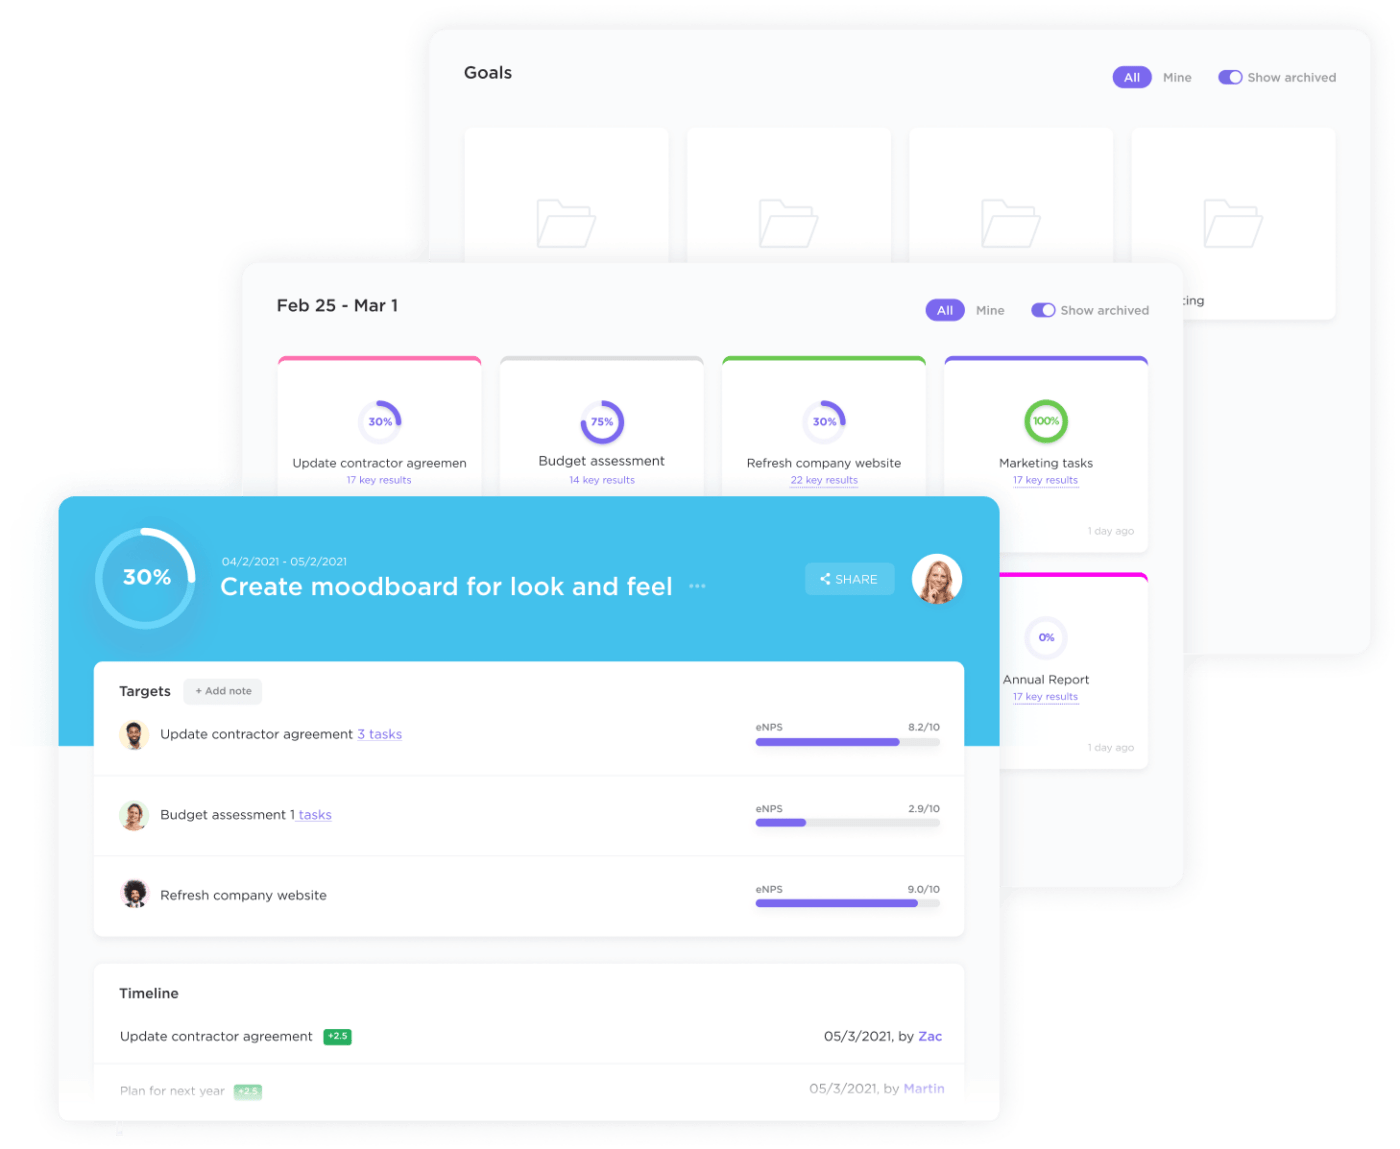
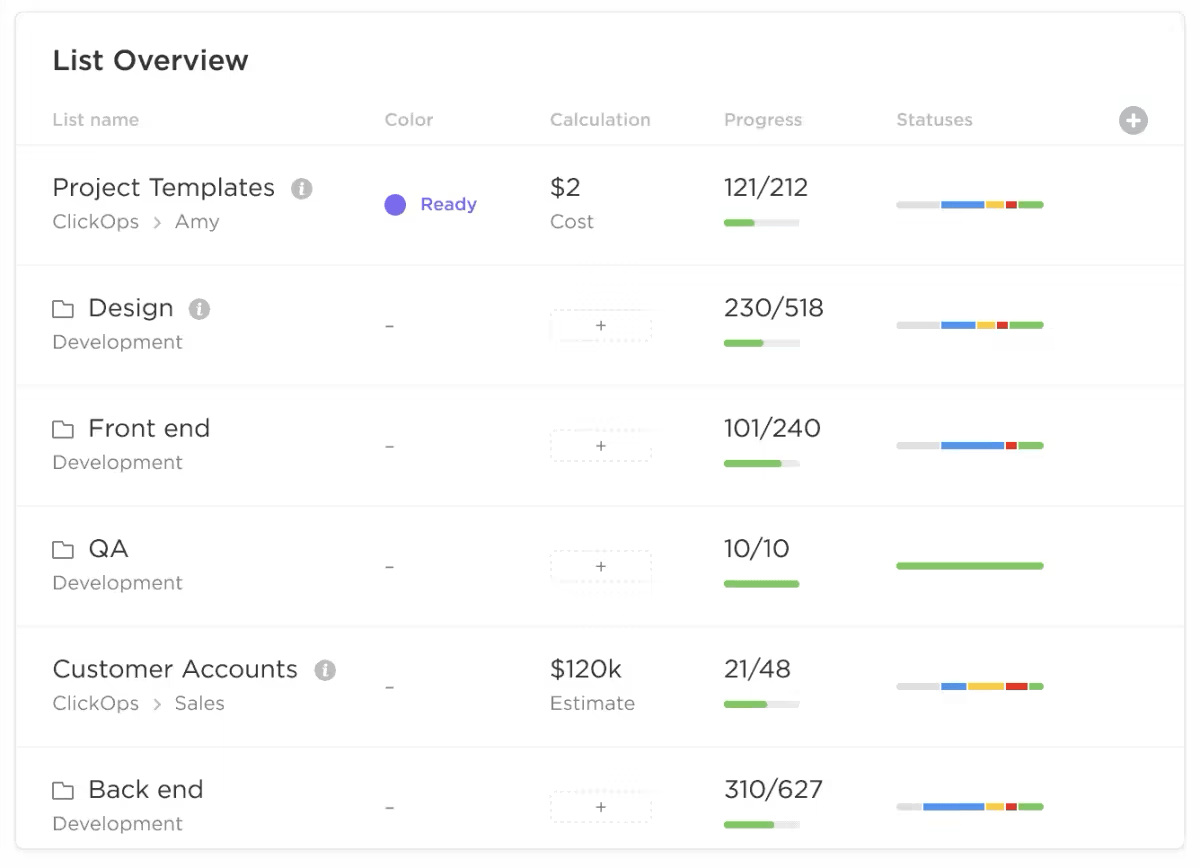
Add your own goals, targets, or KPIs and customize them completely. Track progress with numerical, monetary, true/false, or task targets. Visualize this data in a highly visual KPI reporting dashboard that allows you to see your progress against multiple KPIs at once.
Making your own KPI report is easy with ClickUp Goals, but if you’re looking for an even easier route we have you covered. The KPI Template by ClickUp comes set up and ready with everything you need to monitor your metrics and KPIs—all you need to do is add them to the template.
5. Share your KPI report
With your KPI report built and ready to go, you can start sharing it with stakeholders, decision-making leaders, team members, and anyone else who has an interest in your progress.
If you’re using ClickUp for your KPI reporting, it’s easy to share your reports with anyone at any time. Collaboration and communication will always enhance your process so you have the most successful KPI reporting strategy.
Use the privacy and sharing preferences to customize who has access to which Goals, and tag team members so they can monitor their individual influence against specific goals and targets. 💬
9 KPI Report Examples and Templates to Simplify the Process
You can build a KPI report around any metric or KPI in any team, whether that’s sales, operations, HR, or marketing. Take inspiration from these KPI report examples to discover a new way to monitor and present your data using our favorite KPI reporting software and goal-tracking app, ClickUp.
1. ClickUp Balanced Scorecard Whiteboard Template
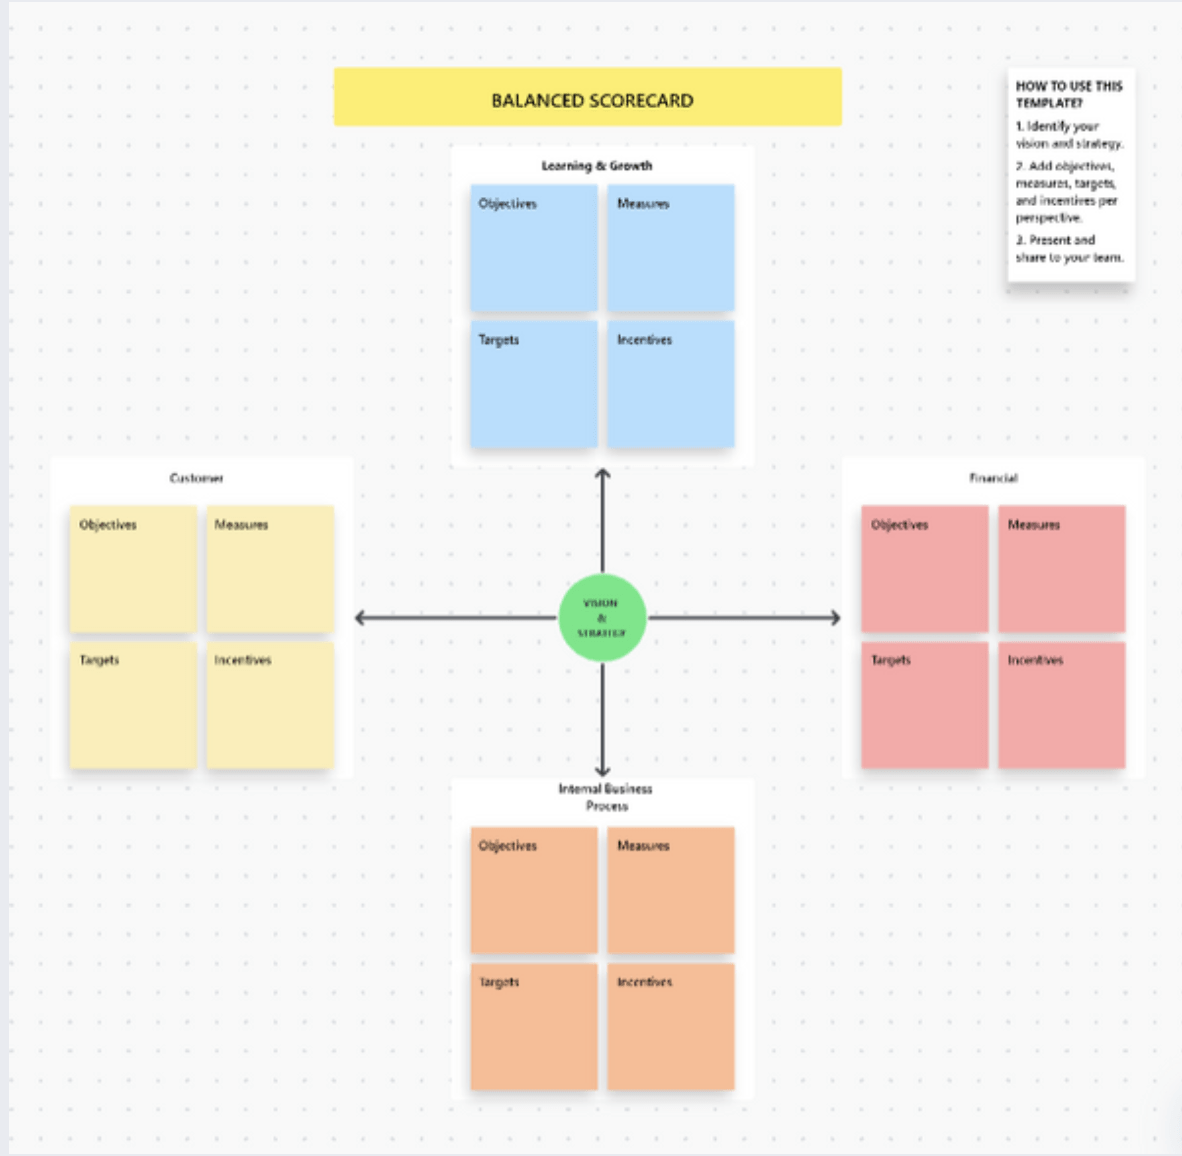
The Balanced Scorecard Template by ClickUp is one of the most visual ways to track data and see progress across a number of KPIs including operational KPIs, marketing KPIs, and financial KPIs.
Invite team members to analyze data, understand your customer needs, set goals, and track different KPI progress with this collaborative balanced scorecard template.
2. ClickUp Company OKRs and Goals Template
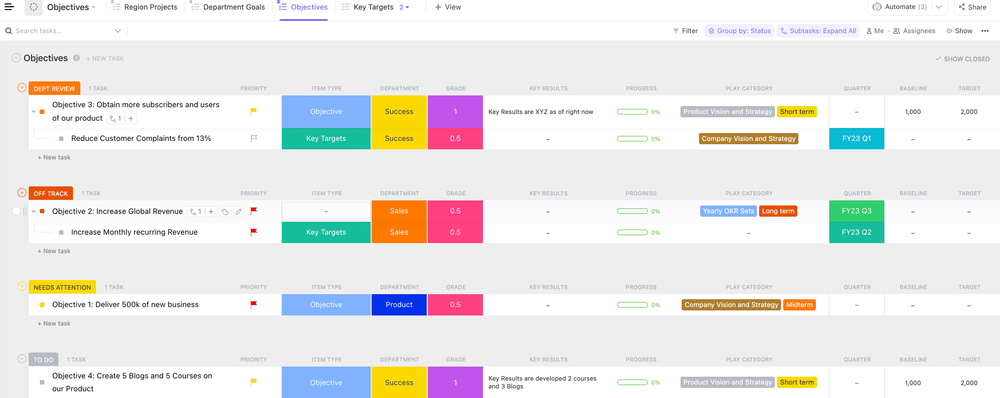
Every company has OKRs, targets, and goals that they want to track. The Company OKRs and Goals Template by ClickUp presents you with an easy way to do just that inside the best OKR software available today.
This goal-setting template allows you to prioritize specific goals and align team members behind the same objectives.
3. ClickUp Learning and Development Project Template
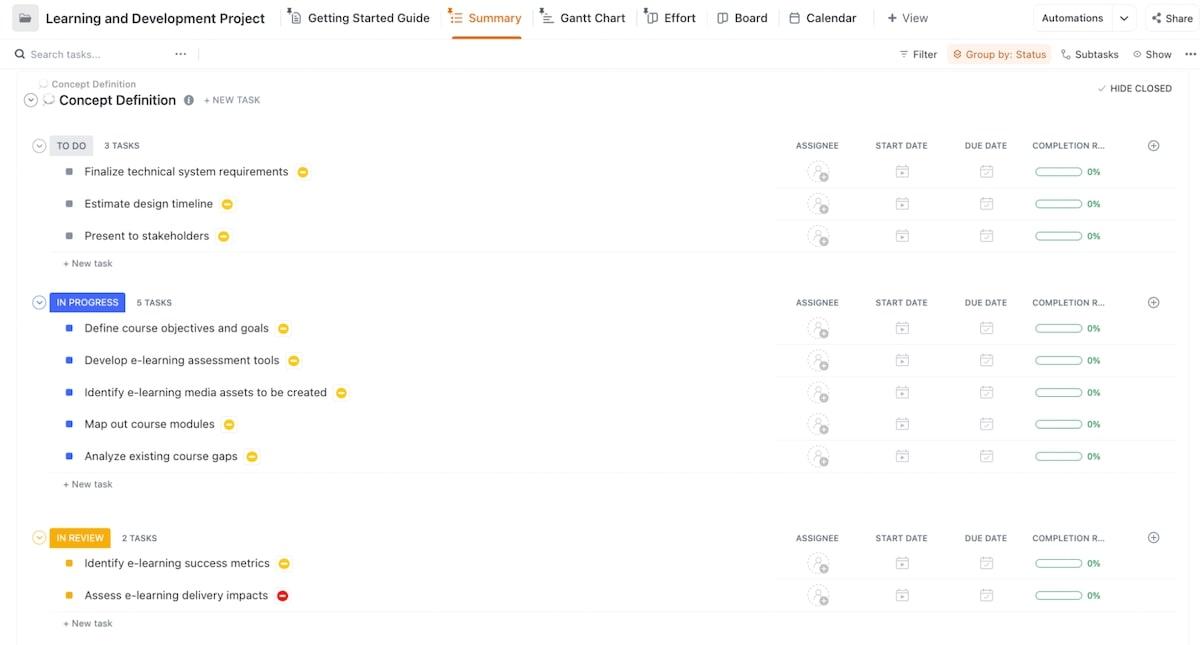
For many organizations, tracking their employees’ learning and development has become a valuable KPI. Use the Learning and Development Project Template by ClickUp to set a goal for your next learning project, then track KPI progress throughout so you can report on its impact more effectively.
4. ClickUp Monthly Business Status Report Template
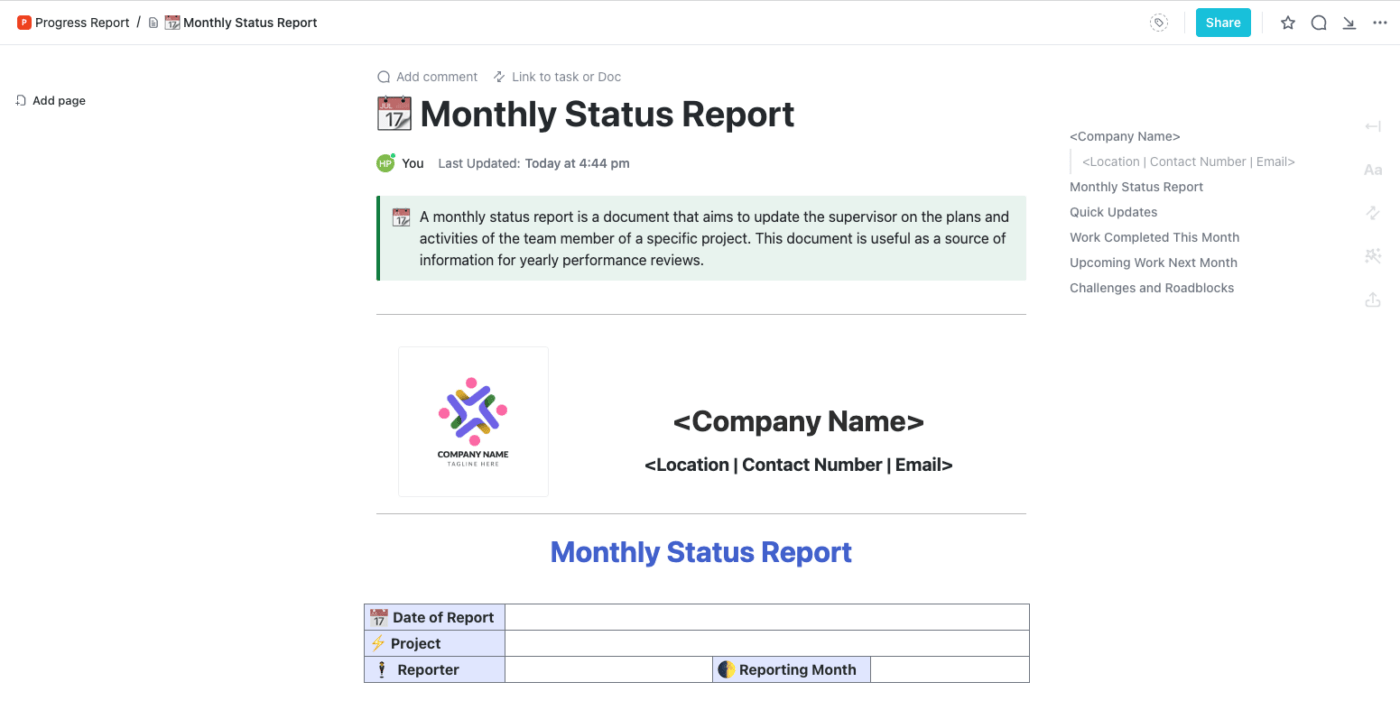
If you’re required to give a monthly update or project status report for your team or department, the Monthly Business Status Report Template by ClickUp is an effective KPI report example for you.
This memo-style report allows you to track and visualize performance metrics and add summaries and context alongside them in the form of a report.
5. ClickUp OKR Framework Template
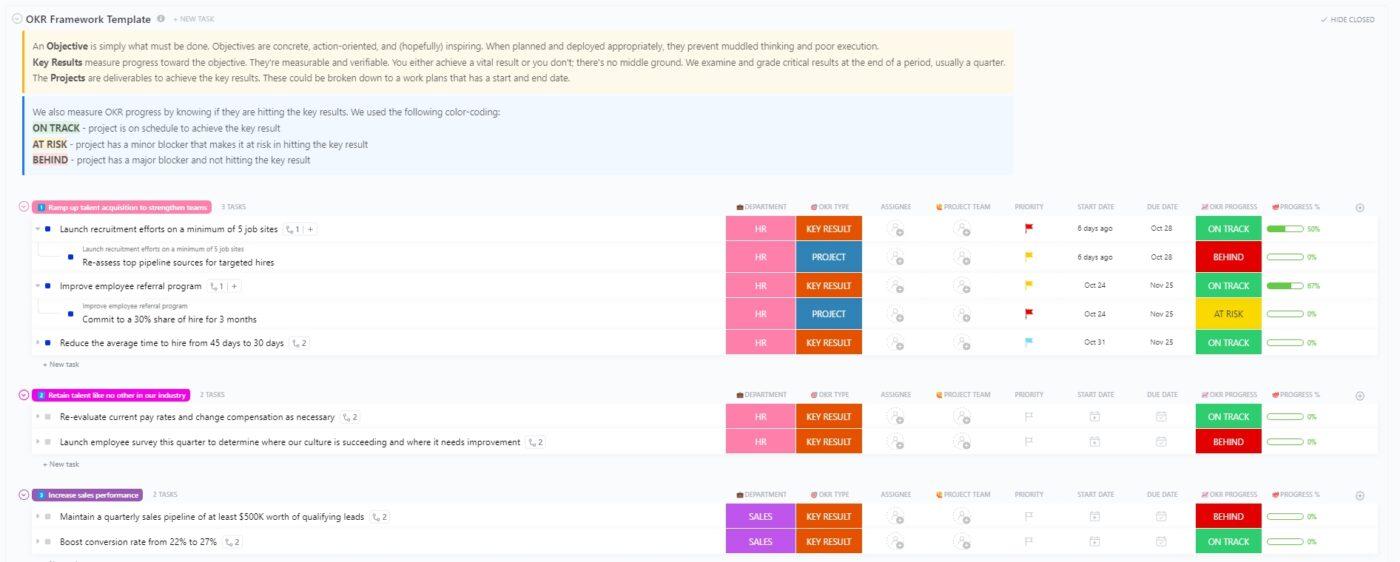
Monitoring your OKRs over the entire company can become overwhelming if you don’t have a system that works. Use the OKR Framework Template by ClickUp to introduce a more robust process that enables you to set SMART goals and track their progress in real time.
6. ClickUp Quarterly Business Review Template
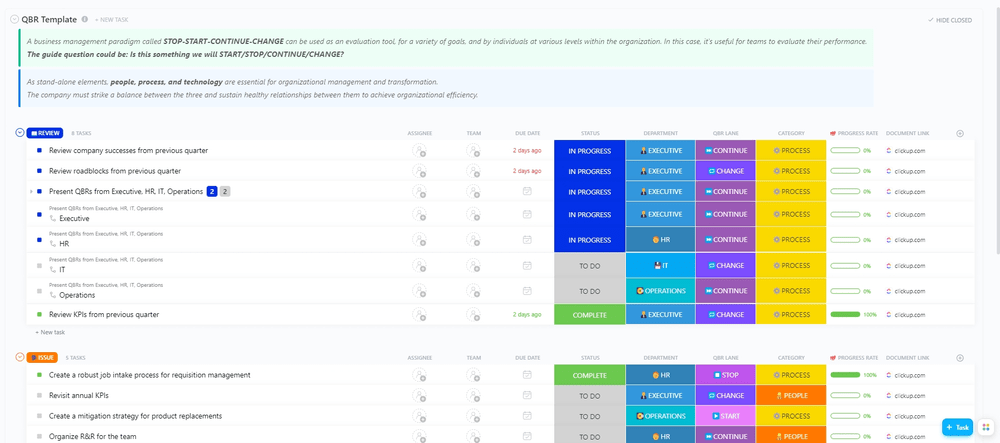
Checking in on your progress every quarter has become a useful habit for most organizations. Use the Quarterly Business Review Template by ClickUp to streamline the process and present your KPI progress in a more visual way.
7. ClickUp Sales KPI Dashboard Template
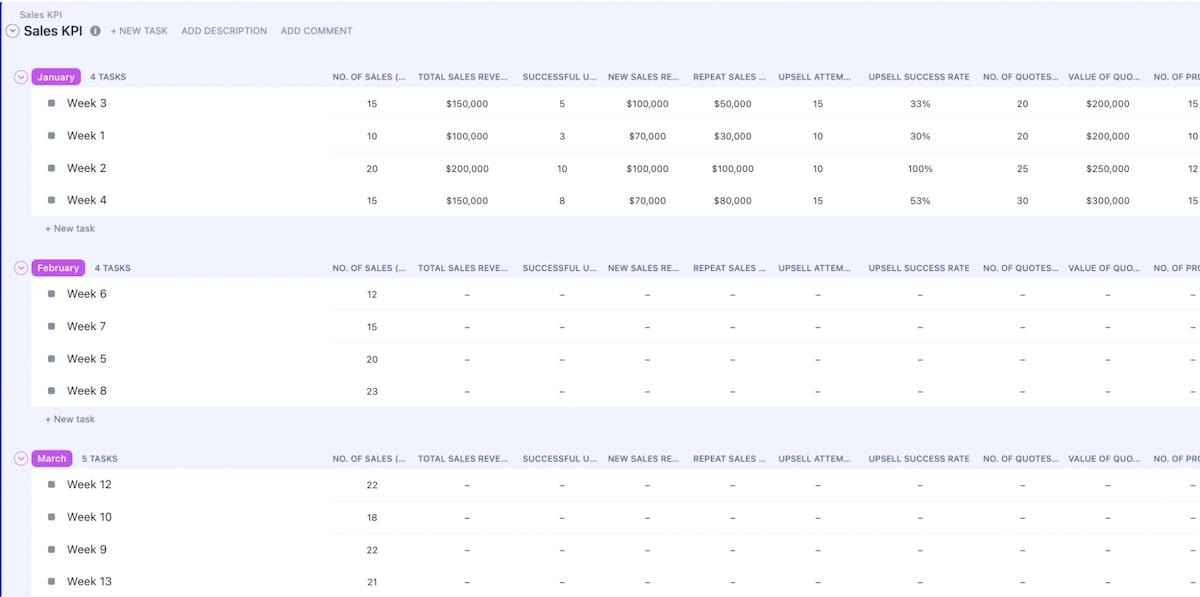
Sales KPIs are a must-have for any effective sales team. Use the Sales KPIs Template by ClickUp to motivate your team to reach shared goals, with a design that allows everyone to see what the most valuable KPIs are and what progress looks like so far.
8. ClickUp Warehouse KPI Dashboard Template
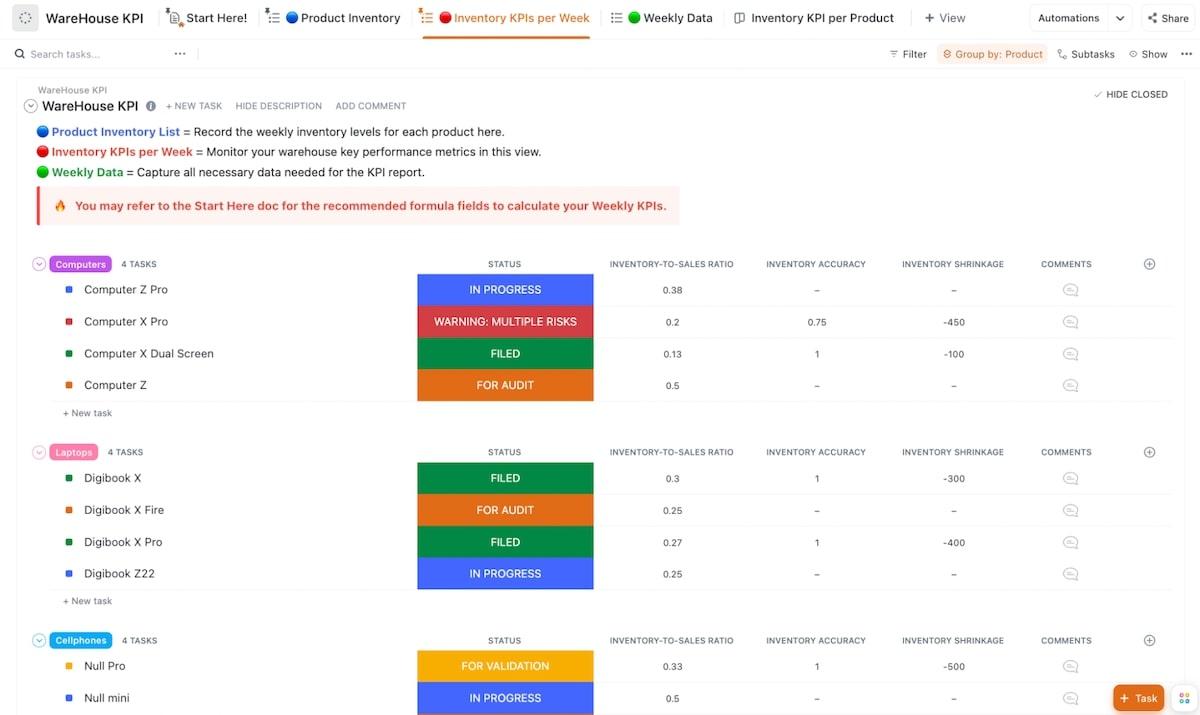
Like sales teams, warehouse teams are highly driven by their KPIs. The Warehouse KPIs Template by ClickUp has been specially designed for warehousing teams’ needs with KPI tracking, real-time data visualizations, and key operational insights.
9. ClickUp Weekly Status Report Template
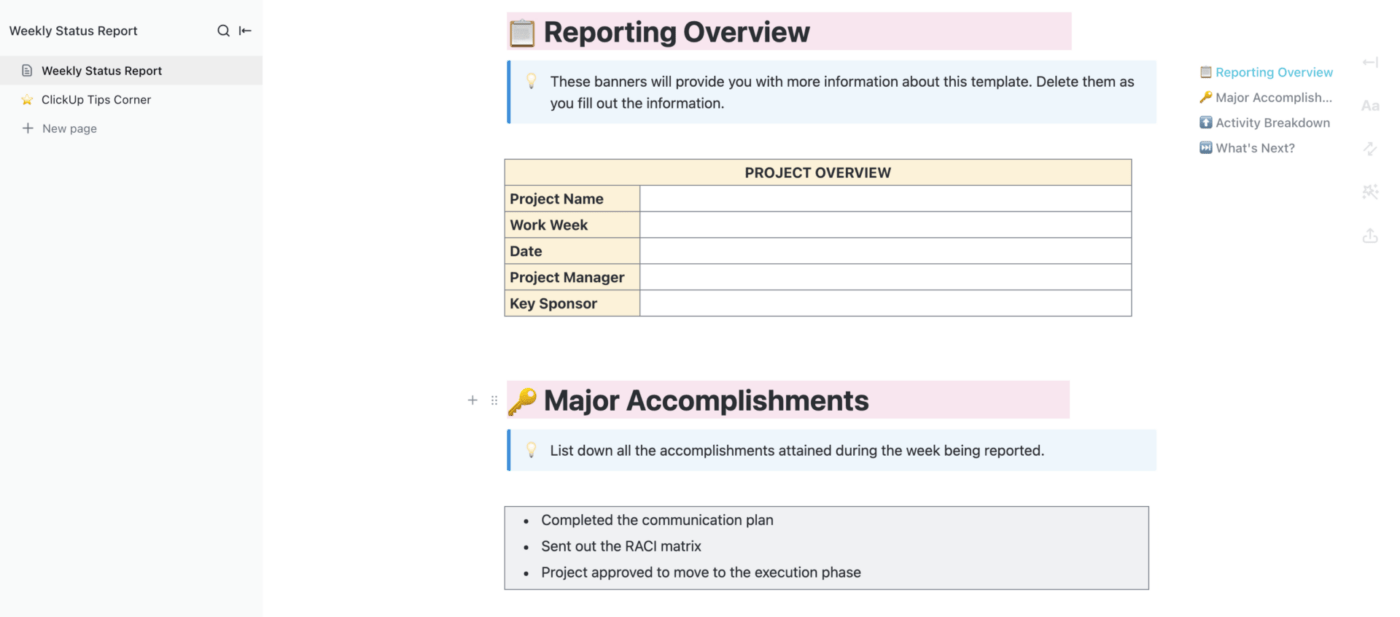
If you’re reporting on metrics that change daily, a weekly report to your team is a great way to keep everyone informed and motivated to reach your shared goals. Use the Weekly Status Report Template by ClickUp to communicate your progress week-on-week, so you can monitor progress and take action quickly.
Make KPI Reporting Easier With ClickUp
Using KPIs is one of the easiest ways to stay on top of your key business goals and objectives. But remember, selecting KPIs is just one part of the process: You need a way to track them too.
There’s no easier way to do that than with an advanced business reporting tool like ClickUp. Our all-in-one platform has everything you need to stay on top of your KPI progress and measure performance.
Try ClickUp for free today and experience a better way to approach KPI reporting. ✨


Everything you need to stay organized and get work done.

Recent Articles
What Are Project Goals? Definition, Examples & How To Write Them 
What Are Project Goals? Definition, Examples & How To Write Them

