

Whether you’re a massive corporation or a budding startup, every company needs to keep track of its finances.
And while the finance world is highly unpredictable, one thing remains the same:
As a CFO or business owner, you need to keep track of your organization’s financial performance.
This way, you’ll be able to plan ahead and avoid losing money. 💸
But how do you do that?
By using financial KPIs!
In this article, we’ll cover what financial KPIs are and highlight ten financial KPIs that every business owner needs to track.
This Article Contains:
Let’s cash in on some KPIs! 💰

What are Financial KPIs?
A Key Performance Indicator (KPI) tracks how well your company performs in terms of achieving its core business objectives.
So when it comes to finances, what are your company’s core objectives?
Do you want to earn more revenue than you spend on operating expenses?
Are you looking to increase your cash flow?
Or do you want a more diverse revenue source?
Financial key performance indicators track your company’s performance in achieving those goals.
In a nutshell, financial KPIs illustrate your company’s financial health and help you determine if your company will make a profit.
Not sure how KPIs differ from metrics?
Check out the differences between KPIs and metrics.
10 Financial KPIs You Need to Track
Here are ten financial KPIs your finance team needs to invest in:
1. Operating cash flow
Your operating cash flow is a finance KPI that measures the total cash generated by your company’s day-to-day business operations.
Here’s how to calculate it:

This KPI depicts your company’s financial health.
It also determines if your company can maintain a positive cash flow or if you need external financing to handle all the expenses.
Note: when using this metric, it’s a good idea to look at operational KPIs, such as operating margin or operating profit, to understand the data better.
2. Current ratio
This KPI measures the ability of your company to pay off all its debts in one year.
Here’s how to calculate it:

A current ratio of less than 1.0 indicates that your company won’t be able to deal with its financial obligations unless you increase your cash flow.
And if it’s between 1.3–5.0, good news!
It indicates financial stability. 😌
A current ratio higher than 5 means that your company has a ton of cash (which is great), but it also means that the company is pretty much not doing anything useful with that money:

3. Net profit
Net profit or net income measures the amount of money your company has after all expenses (interest, taxes, operating expenses, etc.) have been deducted from your total revenue.
You can calculate it automatically with a profit calculator or by using a simple formula to manually calculate this financial metric:

A low net income means that your company may be struggling with several factors, such as poor resource management or inefficient pricing models.
On the other hand, a high net income indicates that your company is performing well.
4. Net profit margin
This KPI measures the percentage of profit a company produces from its total revenue.
Your net profit margin shows you the profitability of your business.
Here’s how to calculate it:

5. Gross profit margin
This financial KPI measures the amount of money left over from revenue after deducting only the cost of goods sold.
The gross profit margin or gross margin shows you if your company is financially healthy.
Here’s how to calculate it:

A high gross profit margin means that your company can pay off all its operating expenses and still have money to invest in innovation and growth.
You know what they say:

6. Current accounts receivable and payable
Current accounts receivable is a KPI that measures the amount of money that debtors owe to your business.
Here’s how to calculate it:

This performance indicator helps finance teams predict how much money is coming in and when.
However, a high accounts receivables balance means that your debtors still owe you tons of money.
Why is that a problem?
If the outstanding amount has been there for a while, it means that your company might have a collection problem or can’t handle long-term debtors.
On the other hand, current accounts payable measures the amount of money your business owes to suppliers, banks, and creditors.
Here’s how to calculate it:

7. Working capital
Your working capital is the money that’s readily available to meet your company’s short-term needs.
This KPI looks at your company’s current financial position.

Working capital includes things like available cash, short-term investments, and current accounts receivable.
That being said, this financial KPI indicates if your company has the available assets needed to settle short-term financial obligations.
Here’s how to calculate it:

8. Customer acquisition cost
This finance KPI measures the amount of money and resources your company invests in securing new customers.
It includes resources like:
- Advertising costs
- Marketing costs
- Creative costs
- Salaries
Customer acquisition cost is a measure of a company’s health.
It’s actually a very useful financial KPI to determine the future profitability of a business.
Here’s how to calculate it:

9. Debt to equity ratio
This KPI measures how efficiently your company is using its shareholder investments.
Here’s how to calculate it:

A high debt to equity ratio indicates that your company has been financing its growth with debt.
The problem?
Your company might default on its loans if interest rates increase suddenly. Yikes!
On the other hand, a low debt to equity ratio may indicate that your company is afraid to use its money to invest in growth opportunities.

So what’s a good debt to equity ratio to have?
Usually, a debt to equity ratio below two is considered manageable.
10. Revenue growth rate
This financial KPI measures the increase and decrease in a company’s sales revenue between two periods.
Here’s how to calculate it:

If you’re an innovative startup, it’s a good idea to track this business metric.
Why?
A high revenue growth rate indicates that your company can expand, acquire new talent, and attract investors!
Interested in more examples? Here are 50+ KPI examples and a template to track them.
How to Track and Measure KPIs with ClickUp
Thinking about tracking your financial goals using pen and paper?
Or Excel spreadsheets, for that matter?
Well, that’s not gonna cut it!

Why?
Your pen and paper aren’t gonna automate and streamline processes for you.
Additionally, you don’t get powerful automated reminders or goal tracking features with spreadsheets.
Instead, all you need is KPI management software like ClickUp.
ClickUp helps you set strategic goals and track your progress towards core business objectives with ease.
Don’t worry, we’ll put our money where our mouth is. 🤑
Here’s how ClickUp makes tracking financial KPIs a breeze:
1. Goals
Since KPIs focus on key business objectives, you need to set a few goals first.
Goals in ClickUp are high-level containers that you can break down into smaller, quantifiable Targets.
Complete the smaller Targets, and you’re on your way to nailing that Goal!

Not sure if you’re making progress?
No worries. ClickUp tracks your goal progress in real-time to help you understand how close you’re to achieving it.
Each time you complete a target, your progress percentage increases automatically.

You can even choose from different Target types like:
- Currency: manage your profit, expenses, and budgets
- Numbers: numerical figures such as the average revenue generated from sales
- Tasks: see if your accounting team is getting things done the right way

Explore how to use ClickUp to set moonshot goals for your team.
2. Dashboards
Dashboards in ClickUp give you a high-level overview of everything that’s going on with your finances.
Manage your financial goals, track your spending, view your profits and budget allocations… Dashboards give you accurate insights into your financial performance so you can predict where your business will be in the future.
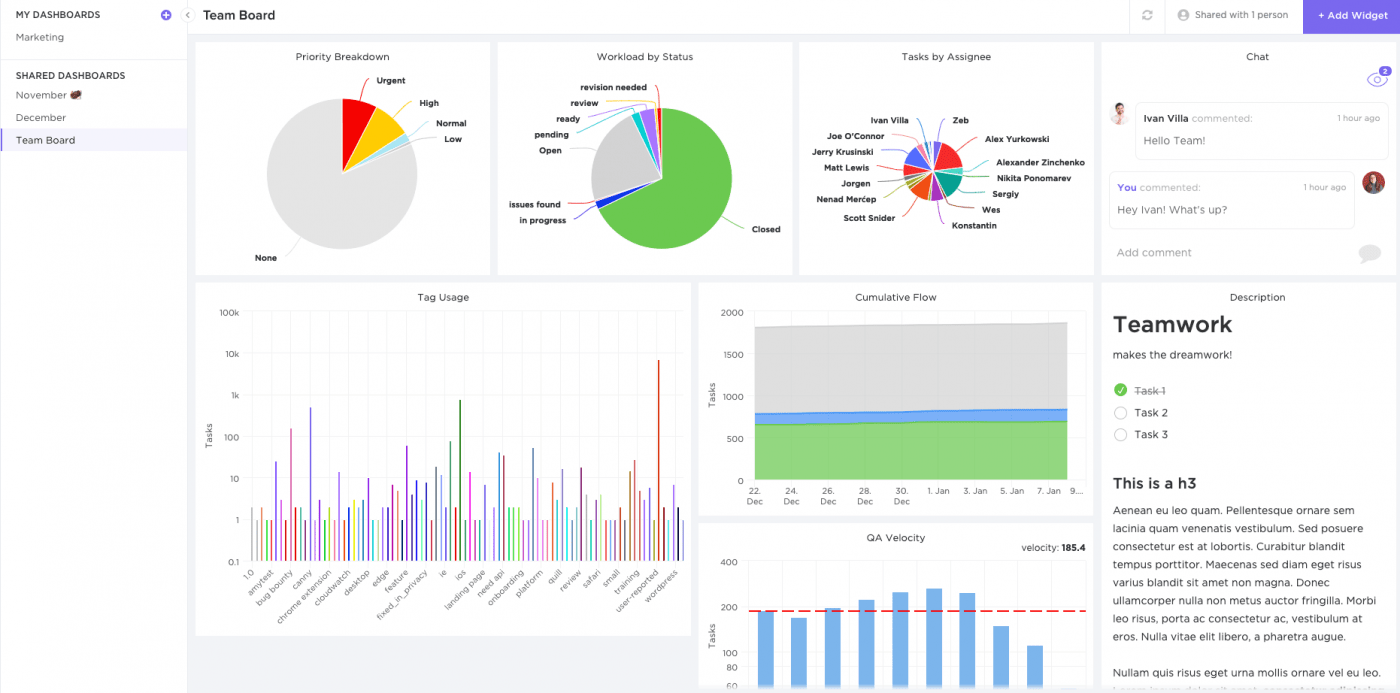
To get an even more detailed picture, you can add several custom widgets to your financial KPI Dashboard, like:
- Calculation: calculate numerical data like the recurring revenue rate
- Line Chart: create a custom line chart to monitor your net and gross profit margins 📈
- Bar Chart: design custom bar charts to track your income, expenses, and profit 📊
- Pie Chart: use a custom pie chart to map out your business’s monthly expenses
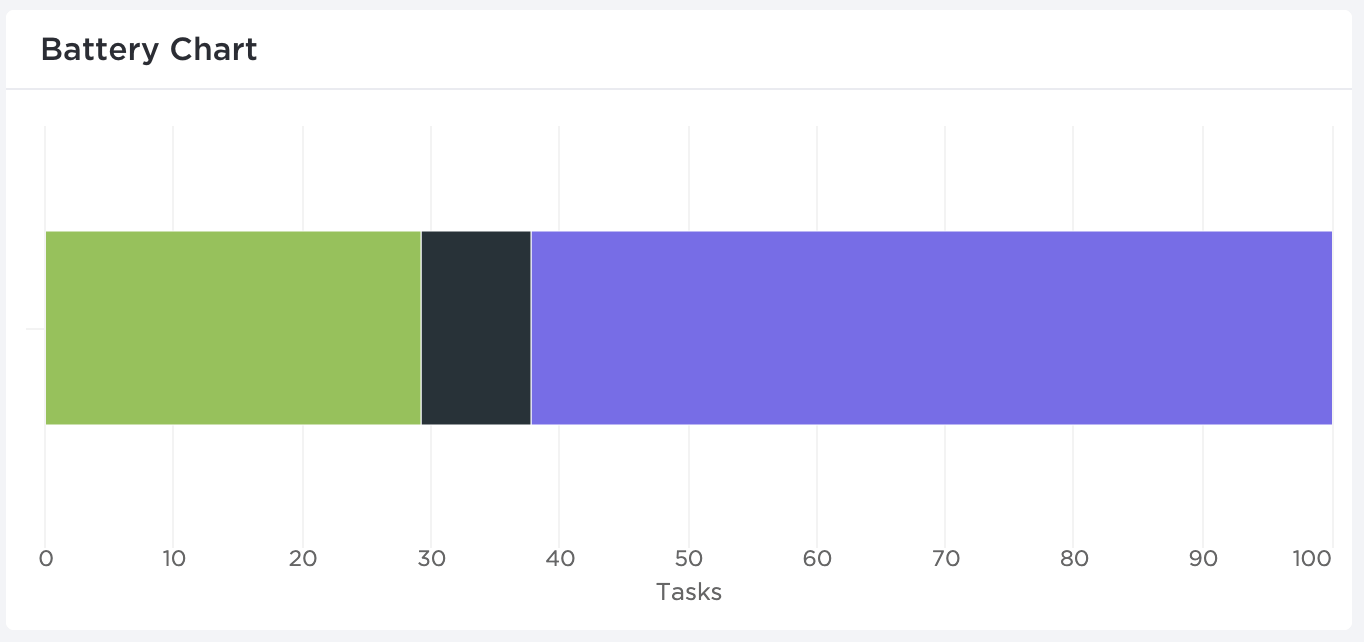
- Battery Chart: create a battery chart to represent your KPI metrics 🔋
Bonus: General ledger templates
3. Reports
Just like how you have financial reports, you also need employee reports to see if your finance team is working towards your KPIs.
Fortunately, ClickUp lets you add table widgets to your finance KPI Dashboard, like:
- Completed Report: track the number of tasks completed by each teammate
- Worked On: get insight into how many tasks each teammate worked on a specific day, week, or month
- Workspace Points: gamify your financial tasks to make your financial processes even more engaging
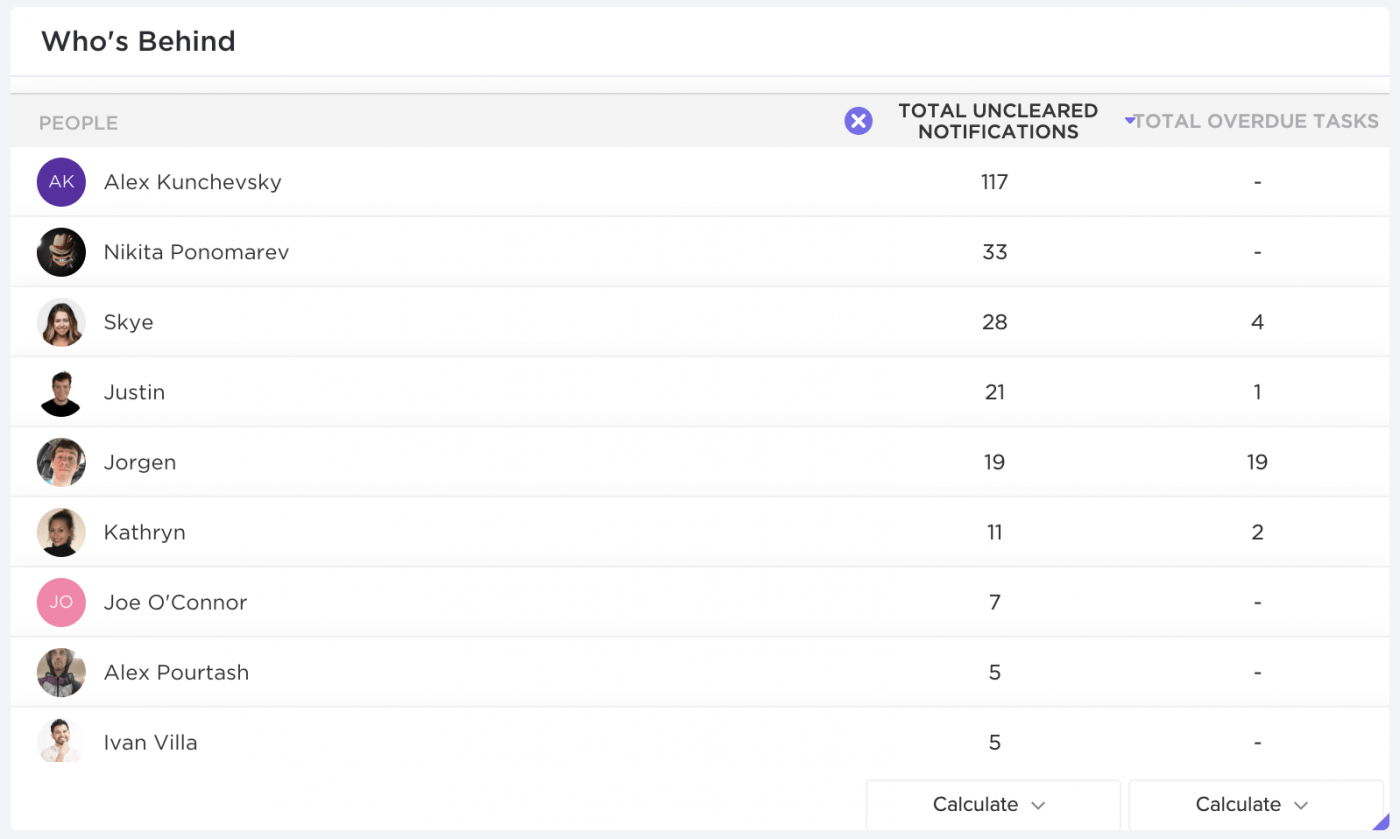
- Who’s Behind: see which team members have uncleared notifications and overdue tasks
4. Calculations
Say goodbye to your calculator because you can do the math right in ClickUp!

ClickUp lets you perform powerful column calculations using numerical data in your tasks. You can do this in the List view and Table view.
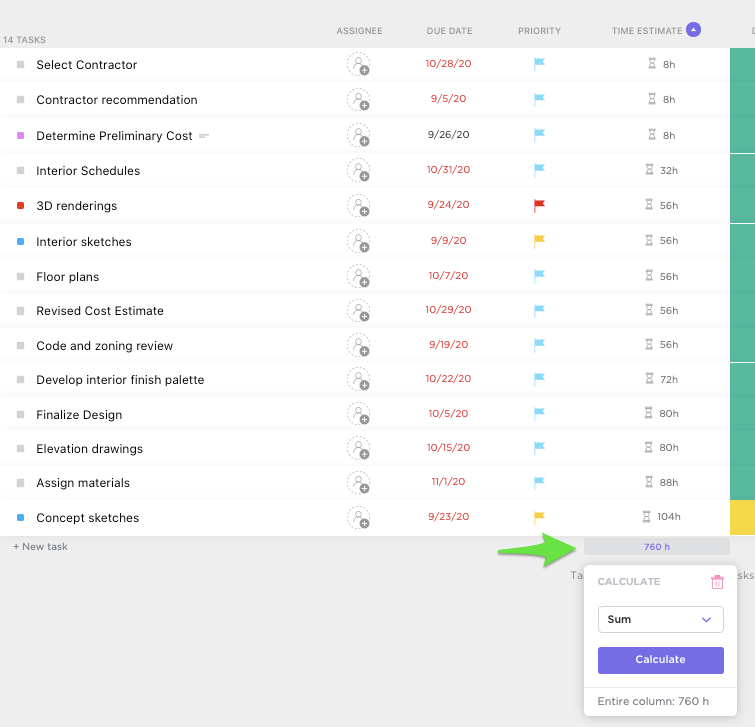
Additionally, you can use formula fields to calculate the cost of a new product order or the profit you made from sales.
You can even calculate KPIs like working capital and customer acquisition costs quickly!
This way, you’ll have all your metrics lined up, literally. 🤩
5. Recurring tasks
Set Recurring tasks for processes that you repeat daily, weekly, or even quarterly.
For example, you can set a recurring task for quarterly tax filing deadlines or even invoice requests.
Still not sold on the idea?

Don’t worry; you can even use recurring tasks to pay your bills!
You’ll get notified when payments are due and after paying the bill, simply mark it complete, and a new task will be automatically created for the following month.
6. Custom statuses
In most cases, tasks that involve money can’t only be marked as “done” or “not done.”
There are many different stages involved in the financial process, like invoicing, cost and revenue budgeting, financial reporting, and more.
That’s why ClickUp lets you create your own custom statuses so you can see your progress the way you want to.

7. Templates
Familiar with moments like this?

We know, organizing invoices, collecting client info, and tracking invoices can be time-consuming.
Fortunately, templates in ClickUp can help you manage your income, clients, sales, and more in seconds.
Here are some of the templates you get:
- Invoicing: keep track of all types of invoices
- Accounting: keep track of your accounts payable and accounts receivable
- Corporate Audits: streamline your audit planning
- Bookkeeping: manage your bookkeeping processes
- Onboarding: onboard new clients and collaborate with them with ease
But this is just the start.
Read more on how ClickUp can help you with finance project management.
FAQs about Financial KPIs
Here are the answers to some burning financial KPI questions:
1. What are lagging indicators?
Lagging indicators communicate events that have already happened. Some common examples are profit and revenue growth.
Since lagging indicators confirm trends that are already in progress, they’re incredibly useful when you’re looking to sell or buy assets.

2. What are leading indicators?
Leading indicators are performance indicators that predict future events and trends in the economy. For example, the number of products you expect to be purchased by each customer.
3. What are quantitative indicators?
These are indicators that can be measured by a number, percentage, or ratio.
For example, your company’s conversion rate or operating profit margin.
4. What are qualitative indicators?
Qualitative indicators are non-numerical factors (opinions or perceptions) that determine the progress made towards an objective.
Qualitative indicators usually measure non financial KPIs like employee and customer satisfaction.
Closing the Books 📗
Financial KPIs determine if your company is moving in the right direction to generate revenue and profit.
But choosing a few financial KPIs from our KPI library is just the first step.
After all, do you simply say you want to make money and hope for the best?
To achieve your objectives successfully, you need to track and manage the KPIs you set.
And to do that efficiently, you need ClickUp.
From custom Dashboards that help you track your finances to formula fields that let you perform calculations in a snap, ClickUp has E-V-E-R-Y-T-H-I-N-G you need to reach your KPIs.
Get ClickUp for free today to crush all your financial goals. 👊


Everything you need to stay organized and get work done.

Recent Articles
Claude Skills for Project Management: A Practical Guide 
Claude Skills for Project Management: A Practical Guide
How to Write a Scope of Work (+ Examples & Templates)
How to Write a Scope of Work (+ Examples & Templates)
What Are Project Goals? Definition, Examples & How To Write Them 
What Are Project Goals? Definition, Examples & How To Write Them
