

Sales enablement strategies are important in boosting your team’s effectiveness and your organization’s overall success.
However, you may wonder how to create effective sales enablement strategies as a team manager or leader. This is where sales enablement KPIs and metrics come into play. Monitoring and aligning your efforts with these indicators significantly enhances your team’s efficiency and drives revenue growth.
This blog will guide you through exploring these KPIs and metrics in detail and understanding how to measure and track them effectively.
A Comprehensive Guide to Measuring Sales Enablement KPIs and Metrics
What Is Sales Enablement?
Sales enablement is a strategic approach used by sales leaders. It involves equipping sales representatives with the resources they need to sell products and services successfully. These resources include relevant training, quality content, and technology that help sales reps connect meaningfully with potential buyers.
Moreover, by providing a structured framework, sales enablement facilitates smoother customer interactions, increases sales teams’ odds of closing deals, and decreases customer acquisition costs.
🌟Did You Know: Sales professionals who include sales enablement content in their sales strategy are 58% more likely to exceed their targets 🎯
Identifying and tracking sales enablement metrics is important to benefit from and understand whether your sales and marketing efforts are working.
These metrics provide insights into the effectiveness of your sales enablement program and the performance of your sales team. They help you to:
- Understand which sales enablement initiatives are working and which need a relook
- Devise strategies for improvement in areas with lagging sales performance
- Identify training needs and plan for training programs
- Showcase how your sales team’s efforts contribute towards the bigger picture
- Promote a culture of continuous improvement
Thus, sales enablement metrics are crucial in helping you develop effective sales enablement strategies.
Sales enablement metrics vs. KPIs
While sales enablement metrics and KPIs (key performance indicators) seem similar in measuring sales enablement success rates, they serve different purposes.
Sales enablement metrics are general data points that measure particular elements of the sales enablement programs, like the number of calls made or emails sent. They provide insights into day-to-day sales activities.
Conversely, sales enablement KPIs are specific metrics tied to strategic business goals and objectives. They assess the effect of your sales enablement strategy on achieving key goals, such as increasing sales productivity or improving conversion rates.
In essence, while all KPIs are metrics, not all metrics qualify as KPIs. This is why tracking sales enablement KPIs helps focus on strategic impact, whereas measuring metrics provides a broader sales performance overview.
Core Sales Enablement Metrics
Understanding sales enablement metrics is essential for improving the day-to-day performance of your sales processes. Let’s explore the core metrics one by one.
Revenue growth
Revenue growth, one of the more critical quantitative sales enablement metrics, indicates the increase in a company’s sales over a specific period. It helps sales leaders assess how well sales and marketing teams meet their targets and convert leads into customers.
Revenue growth reflects the organization’s overall financial condition and assesses the impact and effectiveness of sales enablement initiatives. This metric also scrutinizes the sales enablement team’s performance.
To calculate the revenue growth rate, subtract the previous period’s revenue from the current period’s revenue. Then, divide the difference by the earlier period’s revenue, multiplying the resulting value by 100 to get the value.
🔍Revenue growth rate = [(Current revenue – Previous revenue)/Previous revenue]*100
Sales rep activity
This core metric tracks your sales team’s day-to-day activities, such as the number of calls made, emails sent, meetings booked, and overall sales rep performance.
Monitoring these activities helps you understand how actively your reps engage with prospects and how well their actions relate to target sales performance.
Sales cycle length
Sales cycle length measures how long it takes your sales team to close a deal from the first touchpoint.
This metric evaluates how your team guides potential prospects toward the final sale. Additionally, it identifies stages where team members typically get stuck, enabling you to devise strategies to overcome these bottlenecks.
Tracking the average duration of your entire sales cycle generates further insights to streamline sales processes and accelerate deal closures.
🔍Average sales cycle length = Total number of days it took to close all deals/Number of deals closed
Win rate
Win rate is a vital sales enablement metric that reflects the percentage of deals successfully closed compared to the total number of opportunities pursued over a specific period.
Measuring the win rate helps you assess your sales team’s performance and the influence of enablement materials.
The metric provides insight into the types of deals your team excels at and those that require additional support. It also allows you to assess which sales techniques are more effective than others.
As such, win rates reveal patterns and areas for improvement to refine your sales strategies and achieve a higher average win rate.
🔍Win rate = [Number of deals closed/Total number of opportunities pursued]*100
Quota attainment
Quota attainment measures the percentage of sales reps who meet or exceed their sales targets over a given period.
By tracking quota attainment, you assess the effectiveness of your sales enablement strategy in accelerating conversions and achieving the company’s sales objectives.
🔍Quota attainment = [Total Actual Sales in a specific period/Assigned sales quota for that specific period]*100
Content usage
Content usage is a reliable metric for determining whether your sales reps use the case studies, datasheets, and other content resources created as part of the sales enablement strategy.
This metric reveals which sales enablement content your sales reps rely on the most and how often they access them. It also pinpoints underutilized materials that may need revision.
Beyond mere statistics, content usage provides insights into the accessibility, quality, and relevance of the materials. Tracking this metric ensures that your sales enablement efforts suit the needs of your sales reps.
Sales training completion rate
Monitoring the completion rate of sales training programs ensures that your team is engaging with and benefiting from enablement content.
A higher completion rate suggests that your sales teams find the training content useful and are better prepared to respond to customer needs.
🔍Sales training completion rate = [Number of employees who completed the training program/Total number of employees scheduled to attend the program]*100
Customer retention rate
Customer retention rate (CRR) is a crucial sales metric. It indicates the percentage of customers that stay with your company over a specific period.
A high CRR implies greater customer satisfaction with your sales and customer support teams’ efforts and the quality of your products or services. This ultimately contributes to your business’s overall growth and sustainability.
🔍Customer retention rate = [(Number of customers at the end of a specific period – Number of new customers acquired during the specific period)/Numbers of customers at the beginning of that specific period]*100
Key Performance Indicators (KPIs) in Sales Enablement
Understanding KPIs in sales enablement helps you make data-driven decisions in the sales process. These KPIs track the progress toward your sales and organizational goals.
Let’s explore the core sales enablement KPI metrics in detail.
Product knowledge retention
Even though it partially falls under quantitative metrics, this KPI measures product knowledge retention among sales reps after training sessions.
Regular assessments help ensure that your sales teams fully understand the products they’re selling, which leads to more effective sales conversations, higher close rates, and better customer satisfaction.
Sales productivity
Sales productivity is a crucial sales enablement KPI that measures how effectively your sales department uses the resources available to generate revenue and achieve other sales targets.
Different companies measure sales productivity differently. Some look at revenue per sales rep, while others consider the pipeline-to-quota ratio or the average number of deals closed.
By measuring and tracking sales productivity, enablement teams identify areas for improvement. The data also enhances sales efficiency by guiding them to make informed decisions regarding training, resource allocation, and strategies.
If you’d like to quickly assess where your team stands, try using ClickUp’s Sales Productivity Calculator for a simple, hands-on way to evaluate your numbers.
Ramp-up time for new reps
Ramp-up time measures how long it takes a new sales rep to start meeting sales targets and become a productive member of your team. This period includes onboarding, training, and one complete sales cycle.
Like sales productivity, companies employ various methods to calculate the ideal ramp-up time.
If you know little about a newly hired sales rep’s ramp-up history, use the simple formula of average sales cycle plus 90 days. Some also add the training completion time to the average sales cycle to get a figure.
However, the most prevalent method for measuring ramp-up time is calculating the average duration it takes your new sales rep to attain 100% of their quota.
A short ramp-up time is crucial for improving your team’s efficiency. The faster new sales reps acquire essential skills, the better they meet customer needs. This helps your sales numbers and increases the new employee’s engagement and motivation.
Sales technology adoption rate
This KPI monitors how effectively your sales reps are adopting and utilizing sales tools and technologies provided as part of your enablement efforts. High adoption rates suggest that the sales tools are user-friendly and beneficial, contributing to better overall performance.
🔍Sales technology adoption rate = [New active users for a sales tool/Total number of signups for that tool]*100
Lead-to-opportunity conversion rate
The lead-to-opportunity conversion rate is the best way to determine the percentage of leads your sales reps have successfully converted into possible sales.
🔍Lead-to-opportunity conversion rate = [Number of leads converted/Total number of generated leads]*100
Deal slippage rate
Deal slippage rate refers to the percentage of deals that are delayed or pushed into the next sales cycle.
A lower deal slippage rate shows that your sales enablement programs are helping reps overcome sales objections and other challenges to close deals on time.
🔍Deal slippage rate = [Number of slipped deals/Total number of forecasted deals]*100
Pipeline velocity
Pipeline velocity can be used as a KPI to measure how quickly your sales reps move prospective customers through the sales funnel.
Through this, assess how efficient your sales process is and identify areas you must work on.
🔍Pipeline velocity = [Number of qualified opportunities* Average deal size* Win rate] /Average sales cycle length
Cross-sell and upsell rates
This KPI measures the success of your sales organization in expanding existing customer accounts through cross-selling and upselling.
Higher rates in these metrics signal that your sales enablement strategies are helping reps recognize and capitalize on opportunities within the existing customer base.
🔍Cross-sell or upsell rate = [Revenue from cross-sold items or Revenue from upsold items/Total revenue]*100
Average deal size
The average deal size is a vital sales enablement KPI representing the typical amount customers spend on your products or services.
This KPI provides insights into your sales team’s revenue generation patterns and helps you set more informed sales OKRs. It lets you modify your sales strategies so your team can upsell your products or services to existing customers and new prospects.
To calculate the average deal size, you must divide the total revenue generated in a given period by the total number of deals closed.
🔍Average deal size = Total revenue generated during a specific period/Total number of closed-won deals during that specific period
Measuring and Tracking Sales Enablement Metrics
Now that you have a solid understanding of core sales enablement KPIs and metrics, the next question is: How do you measure and track them?
Through sales enablement platforms! These platforms and analytics tools can increase a sales team’s win rates by as much as 7%.
But how do you decide on which platform or tool to use?
Enter ClickUp with its comprehensive suite of sales enablement tools.
From customizable dashboards to integrated CRM software, ClickUp offers the full sales tech stack that teams require. Track metrics, visualize data, and streamline the sales process to close deals and easily generate revenue.
ClickUp for Sales Teams brings all sales-related activities under one roof, ensuring your team doesn’t have to toggle between multiple applications. It also integrates with your CRM reporting system, allowing seamless data flow and management.
With ClickUp, you can see and manage client relationships in whichever workflow view you prefer—a List view, Table view, or Kanban Board-like view. You can also maintain your own system for storing, analyzing, and managing contacts, customers, accounts, and deals.
What’s more, ClickUp’s sales enablement software facilitates effective order tracking and helps you develop strong relationships with clients.
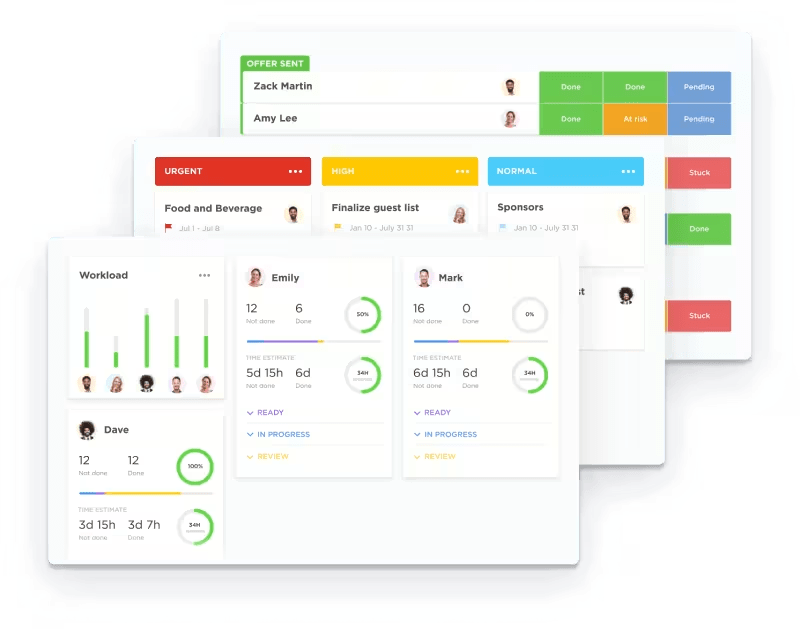
Real-time tracking of sales metrics
With ClickUp Dashboards, sales managers track real-time sales enablement KPIs and metrics.
Customize your dashboard with your preferred sales enablement KPIs and metrics, including bar, column, pie, line, battery, and other charts.
Track performance, identify bottlenecks, discover sales patterns and trends, and make informed decisions.
Automated alerts and reporting
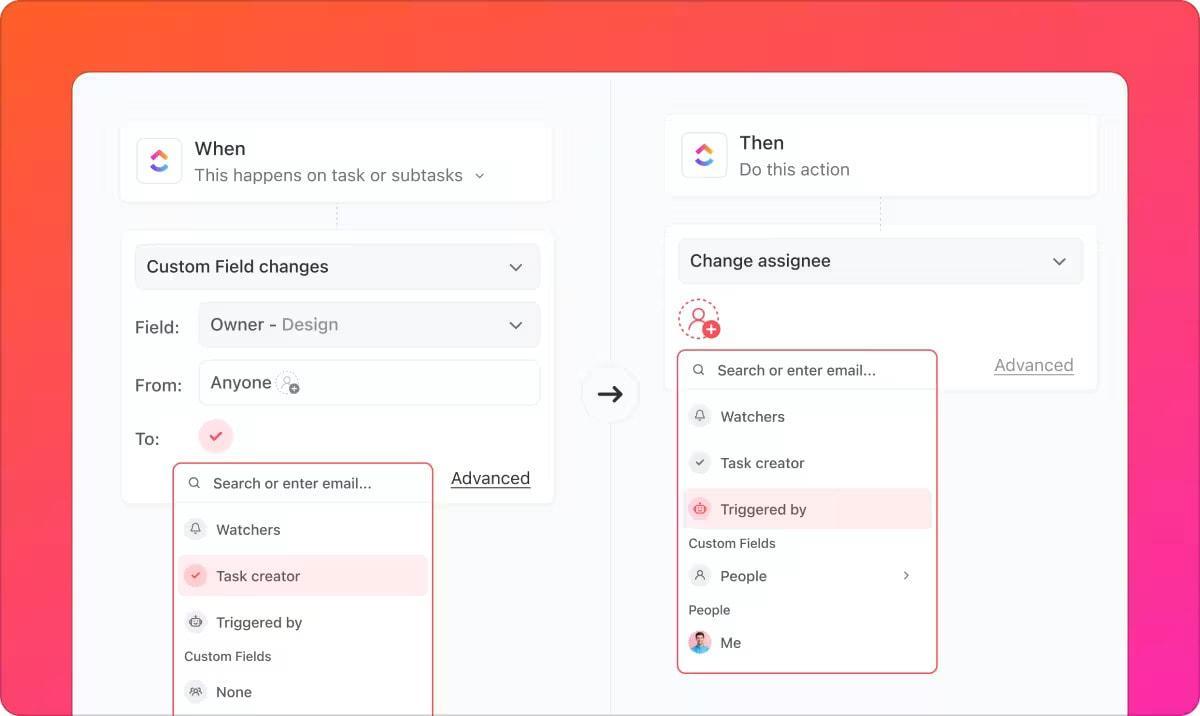
With ClickUp Automations, your sales team quickly sets up automated alerts and reports for sales-related activities, including tracking sales enablement KPIs and metrics.
For instance, teams can create alerts when deals are won or lost and set reminders for follow-up tasks, ensuring that opportunities are not neglected.
Automating alerts and reporting offers several benefits:
- Keeps your sales team informed about critical changes, such as when a deal moves in the pipeline or when specific KPIs drop below a certain threshold, enabling quick action against emerging issues
- Everyone on your sales team receives the same information in a consistent format, maintaining clarity and alignment
- By automating repetitive sales processes in ClickUp, your sales team saves time and reduces manual errors, allowing them to focus more on closing deals
Automation also supports your sales team across various areas of the sales operations. For example, ClickUp Automations assigns new leads to team members based on criteria like territory or expertise so that every lead is followed up. It also automatically changes the stage of a deal when specific conditions are met.
Leveraging AI for sales enablement insights
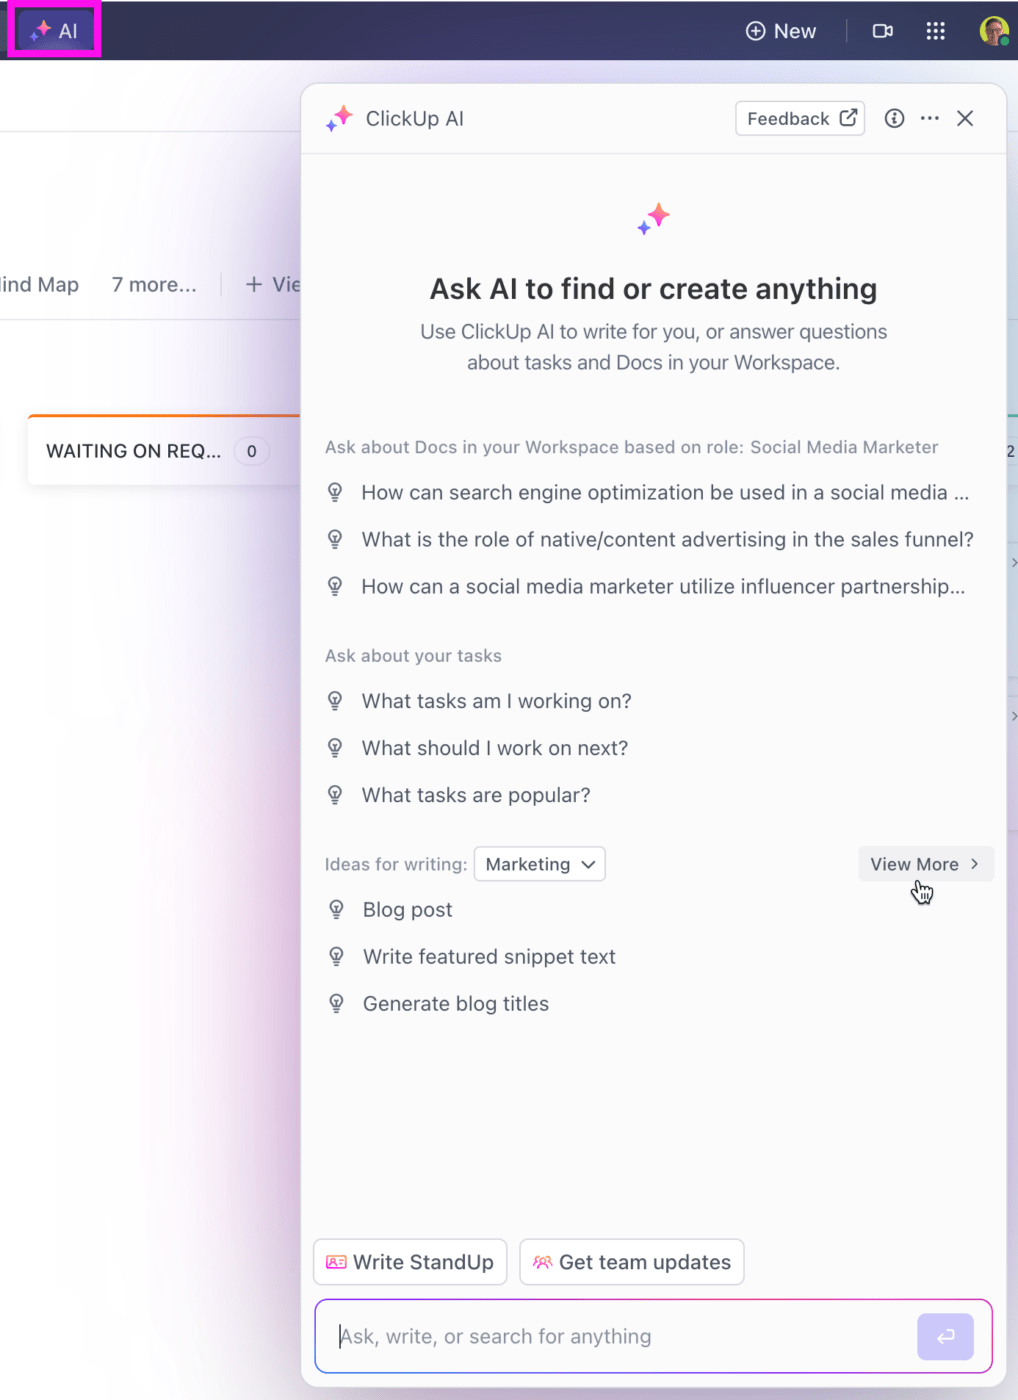
In addition to automation, your sales team can generate sales enablement insights through ClickUp’s AI-powered solution, ClickUp Brain.
With ClickUp Brain, you gain the ability to:
- Identify sales trends and patterns to refine and create future sales strategies
- Tailor your sales techniques to the unique needs of every customer
- Gain predictive insights on lead quality, helping your team focus on leads most likely to convert
- Provide personalized feedback and recommendations for improvement based on individual rep performance
- Generate prospecting email copy and other content with AI
Templates for tracking metrics and streamlining sales processes
ClickUp provides various customizable and easy-to-use templates for sales teams, from sales pipeline templates to ClickUp’s KPI template.
Among these, the ClickUp Sales KPI Template is among the most popular.
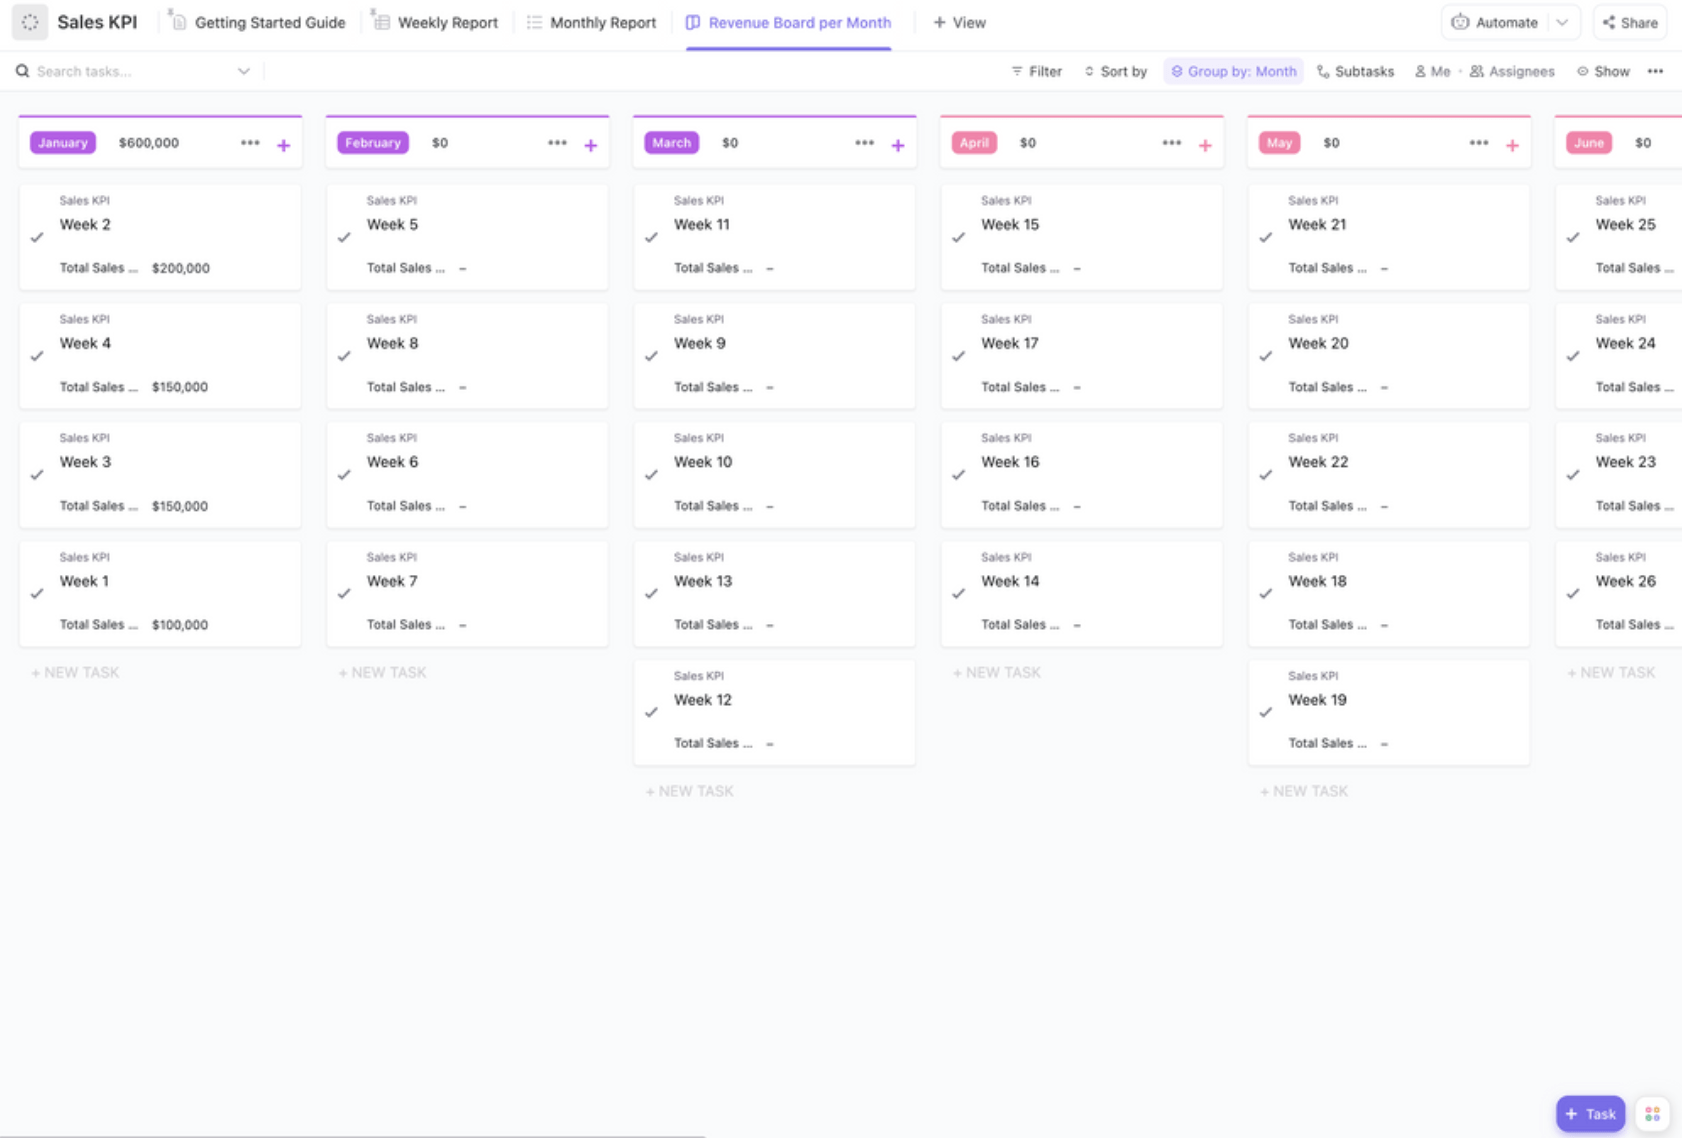
This template helps you define and monitor sales KPIs and track sales performance. It ensures your sales team members are on the same page and focused on achieving your organization’s objectives.
Save essential information such as upsell attempts, repeat sales revenue, and more using 15 custom attributes and improve KPI tracking using tags and dependency warnings. The Monthly Report View will help you analyze monthly sales performance, while the Revenue Board per Month View will give you an overview of your monthly revenue.
Best Practices for Sales Enablement
Here are some of the key practices to follow to build and maintain a robust, useful, and relevant sales enablement program:
Personalized training programs
Custom training programs empower your sales team with the skills and knowledge to engage with customers and successfully close deals. Identify the skill gaps and inefficiencies in the sales process and create sales training programs to bridge these gaps.
Aligning marketing and sales teams
Alignment between the sales and marketing teams is important for successfully implementing sales enablement strategies.
Develop shared goals and objectives that keep everybody working in the same direction. Hold regular meetings where members from both teams discuss sales enablement KPIs and metrics, strategies, successes, challenges, and solutions.
💡Pro Tip: Set up SMART goals easily with ClickUp Goals. The feature allows you to create, group, and categorize custom objectives, set deadlines, measure progress, and more.
Usage of content libraries
The right content available at the right time can improve your sales team’s success rates.
Store all relevant sales material in one centralized location to ensure your team knows and uses it. Organize these materials by category, content type, topic, sales stage, etc., and provide your sales team with accessible links to this sales content library.
💡Pro Tip: Use ClickUp Docs to create a centralized content library with nested pages. This tool allows you to store, categorize, and share all your sales material efficiently and securely, from case studies to sales report templates.
Application of sales playbooks
Sales playbooks guide your sales team members through every step in the sales process. Playbooks provide sales reps with generic best sales practices and tips for handling sales objections. This builds their ability to respond effectively to customer needs and close deals.
Track Sales Enablement Metrics and Improve Your Sales Process With ClickUp
Sales enablement empowers sales teams with the needed resources, facilitating smoother customer interactions that improve sales productivity and drive revenue growth.
Tracking the core sales enablement metrics and KPIs is important to ensure your sales enablement program is at its most effective. Tracking these metrics becomes easier with platforms like ClickUp, designed to support scaling sales teams.
ClickUp provides sales enablement tools, from dashboards and sales plan templates to an in-built AI assistant, to monitor key metrics, measure sales enablement success, and enhance sales enablement efforts. Sign up with ClickUp and power your sales enablement program toward success.


Everything you need to stay organized and get work done.

Recent Articles
Agency Capacity Planning: How to Find the Hours You Already Pay For 
Agency Capacity Planning: How to Find the Hours You Already Pay For
AI Performance Metrics: 50+ KPIs to Measure AI-Driven Efficiency 
AI Performance Metrics: 50+ KPIs to Measure AI-Driven Efficiency
How to Schedule Instagram Stories: Tools & Best Practices
How to Schedule Instagram Stories: Tools & Best Practices
