
Sorry, there were no results found for “”
Sorry, there were no results found for “”
Sorry, there were no results found for “”
Setting up goals is inevitably followed by tracking how they are realized. This is one of every project manager’s core responsibilities, and software development managers are no different.
Project managers use specific KPIs to manage software development projects efficiently. Development velocity, cycle time, and lead time are all examples of KPIs that can be used to track software projects.
These KPIs for software development are your toolkit of objective data to track every step in the software development lifecycle to identify bottlenecks and work towards continuous improvement.
Let’s see how software development teams can optimize the development process with the help of the top 25 software development KPIs (key performance indicators) to drive decision-making.
Innumerable KPIs exist tailored to specific business objectives and ongoing projects. Here are the top 25 that cut across the board to keep your developer team ahead of targets.
More of a visual learner? We’ve captured the most critical KPIs for you in this video as well:
Let’s explore them in depth, below.
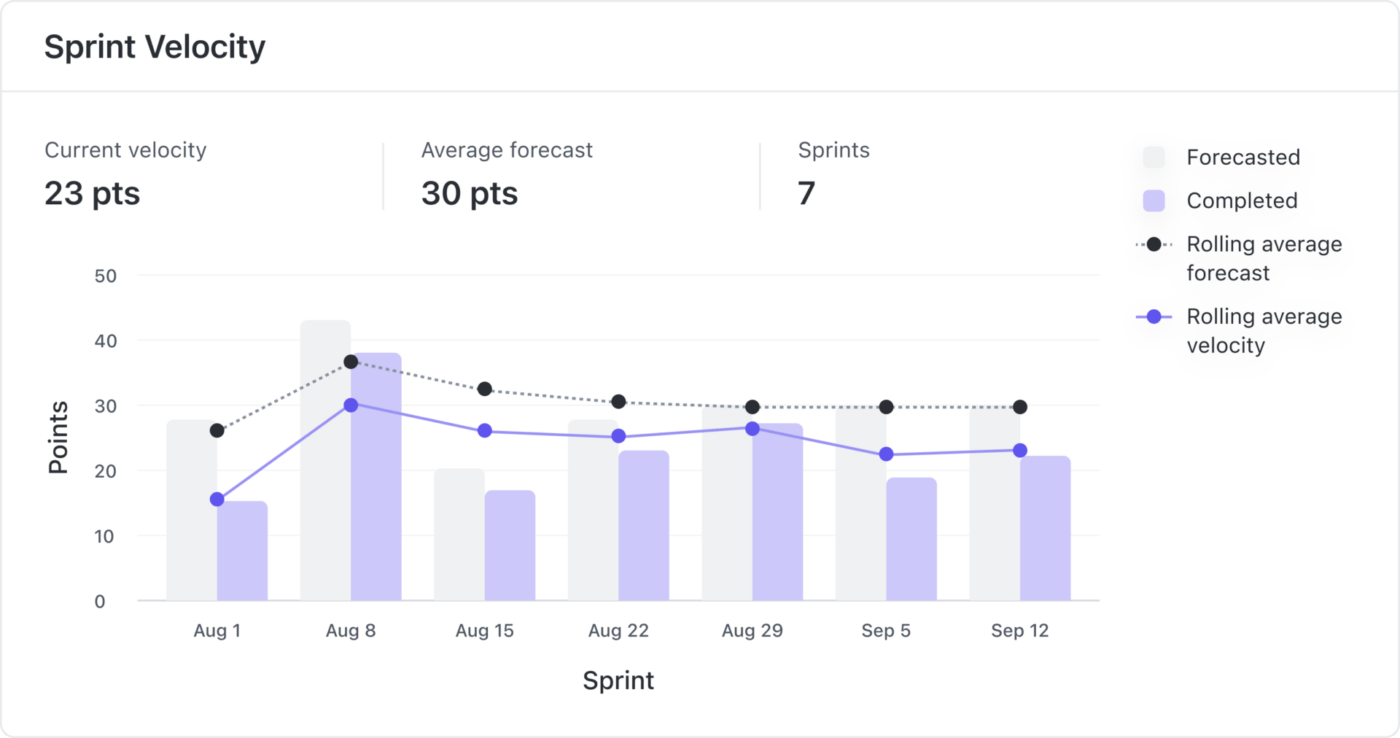
Measure the software development team’s performance with development velocity. It indicates the total work your team can accomplish during a sprint (a fixed period during which tasks are to be completed).
Within a sprint, use story points to calculate the effort required to complete a task on a scale of one to ten, with one being the quickest and ten the most complicated. By measuring each sprint and story point, you can understand your development team’s average velocity within three sprints.
Without this metric, it will be difficult to plan, prioritize, allocate resources, and set realistic expectations for future projects.
Development velocity = Total story points completed in a sprint

Cycle time is a DevOps Research and Assessment (DORA) metric to measure the time spent accomplishing a particular task. It quantifies the team’s performance and estimates the time required to finish future tasks.
For example, in software development, cycle time can refer to the time it takes to resolve a bug, from when it is assigned to a developer and undergoes code stability and code testing until it is fixed and approved by quality assurance.
This metric helps assess the developer team’s productivity and identifies areas for improvement. You can compare the cycle time of each task with the desired duration to analyze where the team is lacking.
Cycle Time = End time – Start time
Code coverage, also called test coverage, measures the percentage of tested code. This DevOps metric measures software quality for production and testing purposes.
It prioritizes test-driven development (TDD) and identifies bugs in codes. The higher the code coverage, the fewer the chances of bugs.
Code coverage = (Number of lines of code executed by tests / Total number of lines of code) X100
Implementing agile methodologies can make measuring the company’s performance harder as the entire team must track agile metrics throughout the development cycle. When tracking the performance of software development tools and processes under such a process, you can depend on the deployment frequency KPI.
It determines the speed at which the deployment team deploys code into different departments, such as staging, testing, and production. This KPI is among the four DORA metrics and is interlinked with others, such as change failure rate, lead time for changes, and mean time to recovery.
This software KPI provides insight into the development team’s efficiency and agility, sets benchmarks for improving deployment practices, and helps with continuous improvement.
Deployment frequency = Total number of deployments / Time period
The Net Promoter Score (NPS) measures customer satisfaction on a scale of zero to ten, where zero describes the worst user experience, and ten is the best.
People who rank the software between zero and six are termed detractors, seven and eight are passive, and those who rank it nine or ten are promoters. If your number of promoters exceeds detractors, then the software performs well.
Net Promoter Score = (% promoters) – (% detractors)
When trying to gauge software reliability, the MTBF metric quantifies the average time between two software failures.
In software development, where failures are inevitable, the MTBF metric is critical for assessing software tasks and developing repair strategies.
Mean Time Between Failures (MTBF) = Total uptime/Total number of breakdowns
Measuring software quality is complex due to its subjectivity. The Change Failure Rate metric gives an insight into the software quality by calculating the percentage of deployments that lead to a failure in production.
A low change failure rate indicates fewer bugs and high quality. On the contrary, a high rate signifies more bugs and a need for the team to revamp the code.
CFR = (Number of failed changes/Number of changes)/100
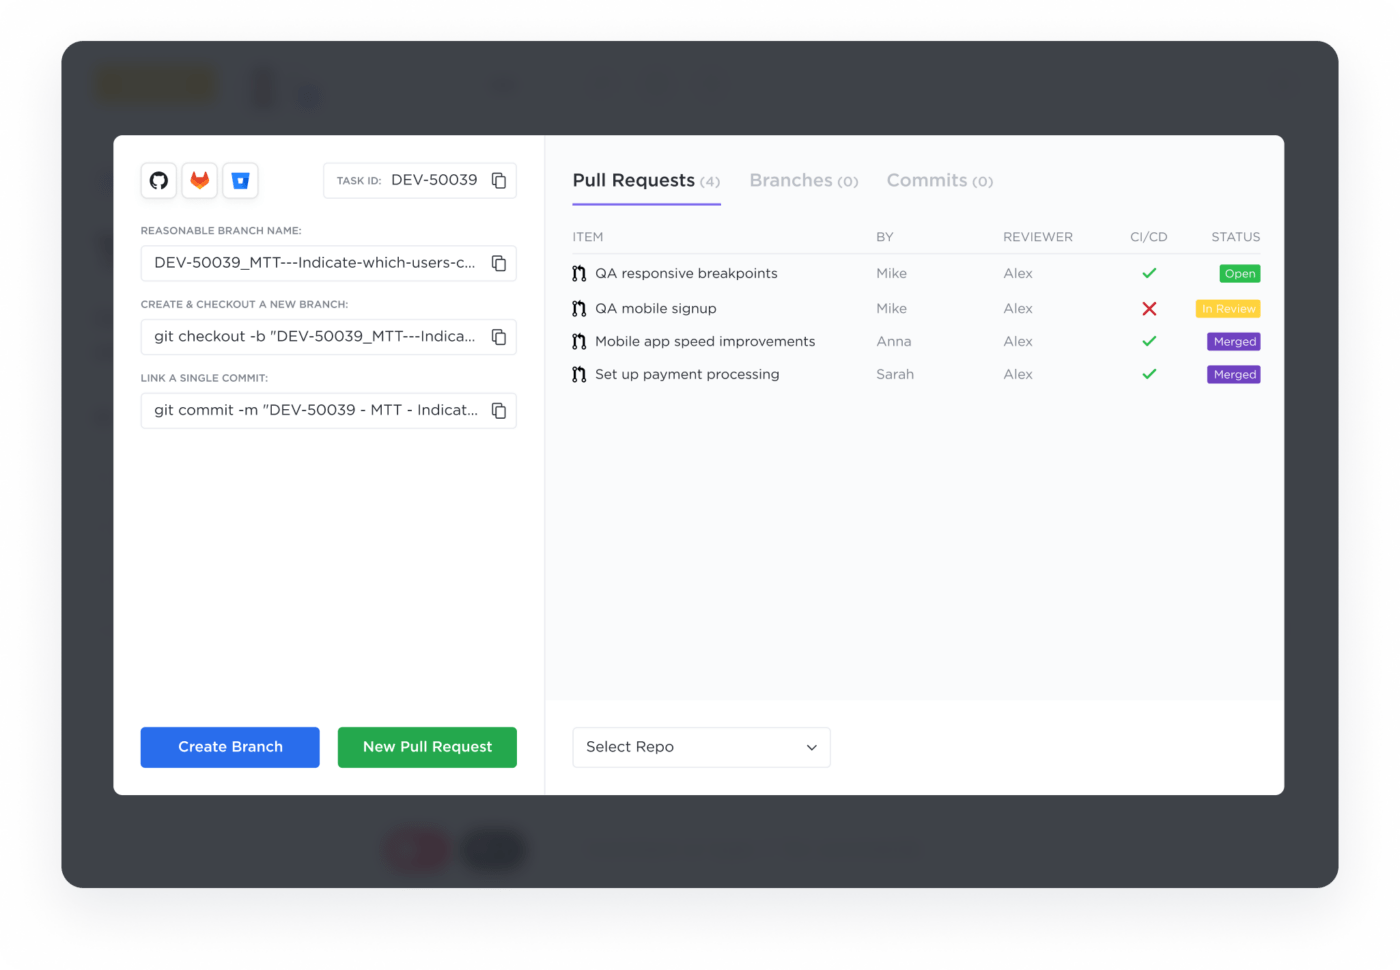
Pull request size is a software development metric that measures the number of code changes in a single pull request, reflecting the size or scope of changes a developer introduces.
Small pull requests are easier to review and process, facilitating faster integration, providing more specific feedback, and reducing the risk of bugs. In contrast, large pull requests take longer to understand, review, and fix.
The DDR ratio measures the number of defects found before release compared to those found after release.
Use the DDR metric to assess the number of defects missed by your testing team and encountered by customers, which negatively impact their experience.
Defect Detection Ratio = (Defects found in a phase + Total defects) X 100
Codes frequently need revision with software upgrades and the introduction of new features. The code churn metric measures the number of times a software code requires iteration during a specific period. A higher code churn indicates higher maintenance and risk.
For example, DevOp teams usually function at an average 25% code churn rate, which indicates that the codes are 75% efficient.
Code churn rate = Total lines of code in the beginning – (Lines added + lines deleted + lines modified)/ Total lines of code X 100
A simple code executed successfully is superior to a complex code that demands constant iterations. The code simplicity can be measured using several metrics such as cyclomatic complexity, code duplication, code churn, etc.
Good code simplicity indicates that the code would consume less time, require fewer iterations, and have fewer bugs.
There is no direct formula to measure code simplicity like cyclomatic complexity, as it is a qualitative rather than quantitative metric.

Software development managers often want to know the stage of software development projects. The cumulative flow demonstrates, via visual diagrams, whether a task is approved, in progress, or in the backlog stage.
Different colors portray different statuses. Additionally, the width of the band tells you the cycle time. This software development KPI lets you gauge the software development status, identify bottlenecks, and calculate the effort needed to complete backlog items.
Also Read: What a software developer’s day is like
The bug rate demarcates the number of bugs identified during software testing. Most software development teams use this metric to compare bug rates across projects, teams, and timeframes, establish benchmarks, and set realistic goals to reduce bugs.
You can look at them from two angles: the total number of bugs detected and the severity of the bugs identified.
Bug Rate = (Number of bugs detected/ Total number of lines of code) X 100

Measure the total number of tasks executed within a sprint with the sprint burndown metric. It is among the key software engineering KPIs that determine work done during sprints. Re-adjust the team’s performance if the results do not match the expectations.
Companies often use sprint burndown charts and measure the time and amount of work to complete in story points to check for deviations from the ideal progress.
The release burndown KPI metric measures the progress of the product release and predicts how many sprints it will take to complete a version based on previous sprints.
Use a release burndown chart to gauge whether the operations are running on time or behind schedule and demonstrate the project’s progress to the stakeholders.
The flow efficiency key performance indicator metric tracks the total and active time ratio to give an insight into the standstill period and optimize the workflow.
Flow Efficiency = (Value-adding time / Lead time) X 100
Value-adding time = Time spent on activities directly contributing to the customer’s needs, like source code/testing.
Total lead time = Time from when a work item enters the Kanban system until it is delivered to the customer.
The mean time to repair refers to the total time a system takes to repair an issue or failure. It includes the repair and testing time to incorporate all the time taken until the software is fully functional.
A high MTTR in software development projects can lead to unplanned downtime.
The MTTR evaluates the reliability and availability of your systems and equipment and identifies areas of improvement and trends in failures so that your software developers can optimize the maintenance strategies.
MTTR = Total maintenance time / Number of repairs
Queue time is the processing time from when a ticket is issued to when it is resolved. It refers to the period when the ticket is still in the queue and unaddressed or unresolved.
Long queue times can be caused by a lack of QA specialists, poor internal communication, or insufficient tools and support. This KPI showcases how optimized the pipeline is; hence, the lower it is, the better.
The faster the ticket completion process, the more positively it reflects on the software development team’s efficiency. The scope completion rate is a metric that determines the total number of tickets completed within a sprint.
A low scope completion rate hints at unoptimized processes, unrealistic targets, or too few staff members.
Scope added is a critical metric for all software development managers as it accounts for the total number of story points added after the sprint commencement.
A high scope-added percentage indicates a lack of planning to determine the challenges ahead. It disrupts the sprint planning by reducing the possibility of performing new work.
To lower the scope added, eliminate features that require more time than your team can dedicate. You can also build a maintenance forecast stating the time and effort required to keep the function running in the long run.
Lead time measures a task’s total time from request to completion. Unlike the cycle time for software development teams, it also considers the waiting time, approvals, and reviews required before the task is completed.
A lower lead time indicates a faster time to market, increased agility, and efficient resource utilization. Together, these factors contribute to higher customer satisfaction.
Lead Time = Deployment timestamp – Commit timestamp
The wasted effort metric measures the time and resources spent on tasks that do not contribute to the final project or the business objectives.
For example, if the team worked on a software feature that was considered irrelevant after two weeks, the wasted effort would be the amount paid to all the developers for their work in those two weeks.
To increase productivity and reduce the time to market, measure KPIs for software development, such as wasted effort, and find ways to reduce it for project success.
Wasted Effort = (Total wasted effort / Total effort) X 100
The interruption metrics measure the total number of interrupted tasks within a given period. You can also measure the total number of interruptions within a task to get a clearer idea.
Interruptions directly impact performance and must be measured to stay on realistic timelines. Some examples of interruptions include technical issues, system failures, personal interruptions, or those due to resource unavailability.
Interruption Rate = (Total number of interruptions / Total time worked) X 100
You need adequate resources to execute your software development lifecycle. Hiring a team of skilled developers sometimes takes time, underscoring the need to set realistic task accomplishment expectations.
The hiring time defines the period from when the candidate applies for a job until they accept it. With this, account for the ramp time, which refers to the time between when the candidate is hired for a role and when they become fully productive in it.
Consider both these markers while estimating the software development lifecycle.
Stakeholders often demand an estimated ship date for the software’s completion, and this KPI assists cross-functional departments in planning their work.
The ship date might change as the operations progress and can be altered when changes occur.
Also Read: What’s the difference between OKR and KPI?
When setting software development KPIs, figuring out the most relevant ones for your project can be challenging. How do you choose the most important key performance indicators from the several options?
We recommend starting with the organizational goals and KPIs that support the strategic initiatives. For example, key areas where software development can significantly impact include improving product quality, increasing customer satisfaction, and reducing the time to market.
The corresponding KPIs that add business value include code coverage, cycle time, code quality, MTTR for improving product quality, NPS for customer satisfaction, and deployment frequency for go-to-market.
Gather input from engineers, testers, developers, project managers, and product developers to make this a collaborative effort and increase the likelihood of successful implementation.
KPIs are not static; they must be regularly adjusted to changing requirements and business goals. You can track them over spreadsheets; however, this has limited scalability owing to version control, lack of automated data changes, and role-based access.
You need software or a template to track and adjust your software development KPIs for successful project completion.
Assume a scenario where the development team measures and prioritizes the NPS score but forgets to communicate it to the customer support team. Without this alignment, the support team may prioritize speed over customer experience, undermining the business objective.
Along with measuring the relevant KPI metric, you must communicate it with relevant team members so they understand its significance and alignment with company goals.
Without using a common dashboard or software, how do you ensure everyone is aligned on the KPIs and is empowered to contribute to achieving them?
Spreadsheet-based data tracking has several shortcomings, including duplicate entries, manual data entry errors, and outdated information, which can misguide decisions.
Data silos get created in many companies where each department works in isolation with its own data and methodologies.
For example, the cybersecurity team within the organization may work on different data sources. In contrast, the development team could have separate methodologies, while these teams have a common goal—reducing software vulnerabilities prone to cyber-attacks.
The result is a fragmented landscape without a single source of truth. Organizations cannot undervalue the importance of data hygiene and timeliness for sound decision-making, especially when cross-functional teams collaborate toward a shared goal. Having a single source of truth, with all teams having access to the same centralized data, is essential.
Once you know the key software development KPIs, the next question is how you will track and implement them.
Tracking software KPIs is time-consuming and erroneous without effective tools that provide distinct data points in a clear and actionable manner.
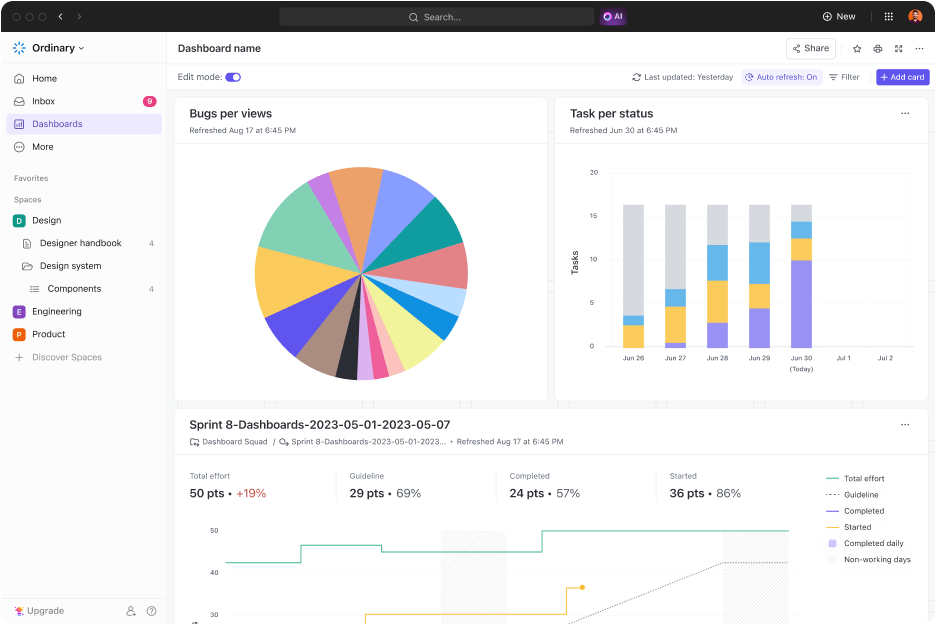
ClickUp is a comprehensive platform for tracking all your key performance indicators related to your software project and ensuring they are aligned with your business and strategic objectives.
You can customize the ClickUp Dashboards to track the most relevant KPIs with real-time data and inculcate effective and timely decision-making. The dashboard can be customized with sprint reporting cards such as velocity cards, burndown cards, burnup cards, cumulative flow, cycle time, and lead time.
All these cards are updated regularly (except for velocity) to simplify KPI tracking and measure development efforts. These cards have various customization options, including source, time range, sample period, amount of work, task filters, etc.
ClickUp Dashboards integrate valuable data from distinct sources to provide a holistic idea of the software development project metrics and performance. This data can be used to make data-driven decisions about the software development process, optimize resource allocation, and the overall development process.
Success is a matter of staying ahead of the KPIs, and as a manager, you must measure what’s working and what’s not for your software development team.
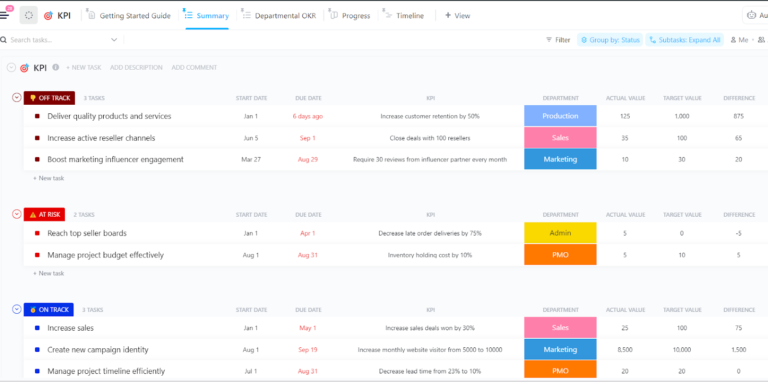
ClickUp software development templates are designed for high-quality software development. They come with ready-to-use, fully customizable subcategories and help track project management KPIs with custom views, statuses, and fields.
ClickUp KPI Template makes KPI measurement a breeze whether you’re a startup or an established business. With this template, you can:
Here is how ClickUp for Software Development Teams simplifies KPIs measurement:
Related: Product management KPIs 🎯
Quality assurance must be central to measuring software development metrics, from identifying security flaws to testing the software for bug identification.
A structured and dependable testing process ensures the development team fixes all the bugs and problems before the customer uses your product/software.
Additionally, optimal quality delivery reduces code rework time and decreases the bug rate and defeat detection ratio. This is why we recommended optimizing the quality assurance for swift and smooth software development processes.
Software development is an iterative process that requires frequent monitoring and adjustments to ensure project success. Setting software development KPIs keeps everyone accountable and ensures software development efforts focus on business objectives.
They serve as the North Star for software development teams, measuring daily progress and helping the leadership and managers better understand the bigger picture.
Integrate ClickUp’s project management software with the software delivery process to measure progress, track KPIs, adjust them as needed, and optimize your development process.
Sign up on ClickUp for free to set and track your software development KPIs.

Engineering Team
Max 12min read

Praburam Srinivasan
Max 24min read
Praburam Srinivasan
Max 13min read

© 2026 ClickUp