

Increase gross profits, optimize revenue growth, reduce average resolution time for support tickets, improve marketing team performance—there are dozens upon dozens of processes and strategic goals that are trackable with the right KPIs.
So how do you get started? You’re going to need a set of good KPIs that are relevant to your particular goals, and you’ll need to learn how to build a KPI scorecard to effectively keep track of progress toward those goals.
Ready to get started? Read below for an in-depth guide to KPI scorecards, plus steps to create your own.
What Is a KPI Scorecard?
Let’s start with what KPIs are: Key performance indicators (KPIs) are metrics used to quantify and track progress toward your objectives or goals. So what is a KPI scorecard?
Think of it like the scoresheets you and your friends might use to track your scores on bowling night or while playing a board game. It’s a visual representation of your KPIs that makes it easier to track and measure progress toward various goals. They track KPIs at the individual level, per team or department, or on a company-wide basis.
Benefits of Using a KPI Scorecard
It’s one thing to understand what a KPI scorecard is—but why should you use them? There are lots of reasons:
- KPI scorecards make it easy to see goals and objectives—and that promotes transparency throughout your company
- They keep the focus on achieving specific goals, which in turn keeps people accountable ✨
- KPI scorecards are an easy-to-read performance measurement that lets you track performance for individuals, teams, departments, or even organizational performance as a whole
- Use KPI scorecards as a basis for strategic planning and project forecasting
- Because KPI scorecards place emphasis on particular goals or objectives, they keep everyone aligned with your overall strategy
- While tracking progress, you’ll notice that some areas aren’t progressing as well as others—and this gives you insights into areas that are due for process improvements 🛠️
Different Types of KPI Scorecards
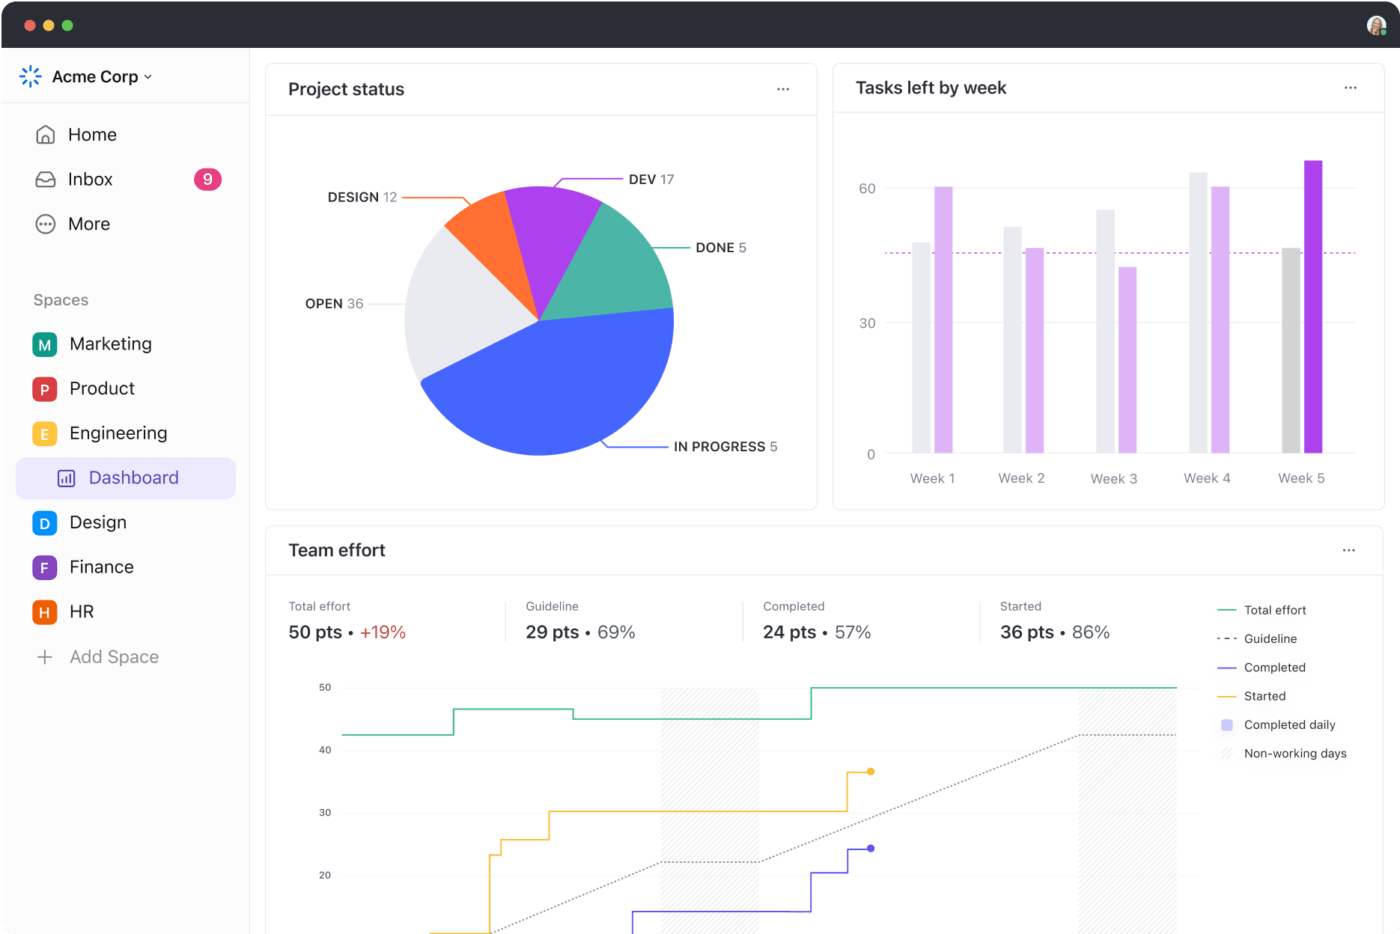
Ultimately, KPI scorecards might take any shape or form that is most helpful for you and your team. Whether you’re measuring overall performance or tracking goals for individual employees, feel free to use charts, graphs, and other data visualizations to make it easier to track progress.
Some KPI scorecards display data in a list format and use color coding to differentiate between on-track and off-track KPIs.
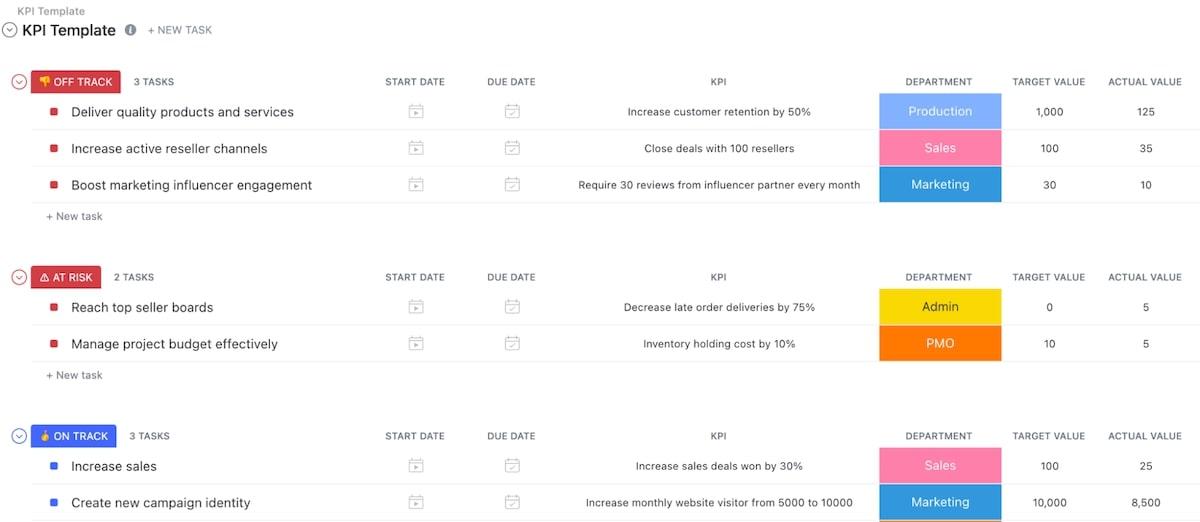
Use the ClickUp KPI template to create a quick and easy KPI scorecard. This KPI scorecard template allows for custom statuses for each task or objective, fields that let you add different attributes to your KPIs, custom views that display your KPIs from different angles, and more.
While there are lots of ways to approach a KPI scorecard, there is one methodology that is particularly popular—and we’ll go into detail on that below. 👀
The Balanced KPI Scorecard
The Balanced Scorecard (BSC) is a KPI scorecard created by Dr. David Norton, co-founder of the Renaissance Solutions consulting firm, and Dr. Robert Kaplan, Professor of Leadership Development at the Harvard Business School.
This type of KPI scorecard pulls together KPIs that assess overall organizational performance from four different perspectives.
- The financial perspective: These include metrics that evaluate your company’s financial performance. Profit margins, income targets, and revenue are all examples of financial KPIs ✨
- The customer or stakeholder perspective: Customer perspective KPIs provide a measure of factors like customer satisfaction, customer retention, net promoter scores, and so on. For stakeholders, you’d likely measure sentiment, which includes how positively they view your company, their satisfaction, and other measures related to stakeholder engagement and success
- Internal processes: KPIs for this perspective analyze how well your company operates and how efficiently you deliver your product or service. These performance metrics will measure the success of logistics, order management, and other business processes
- Learning and growth: These KPIs look at things from your employees’ perspectives. They measure things like investments into training, skills development, workplace culture, technological tools and resources, and employee engagement
The name says it all: The Balanced Scorecard gives you a “balanced” look at how well your company is performing from four different—and crucial—angles. It also lets you quickly identify potential problems (like a drop in employee engagement or falling customer retention), making it easy to find the source of the problem and create a strategy to address it before it spirals out of control.

The best part? Using the Balanced Scorecard doesn’t preclude you from creating other KPI scorecards. Feel free to use this methodology to assess company performance as a whole—and also create department-level or team-level scorecards to more easily manage projects and measure their success.
How to Create a KPI Scorecard to Improve Project Performance
Ready to start creating your own KPI scorecards? Whether you want to create an overall strategy map for your company, assess business goals, or track and improve project workflows, follow the steps below. 🤩
1. Define the scope
Since KPI scorecards monitor everything from company-wide organizational goals to individual success, the first step is to define the scope of your scorecard. Sales teams track different KPIs while achieving their objectives than the KPIs an organization as a whole might use to pursue business objectives.
Choose between scorecards for the company as a whole, departments within the company, and teams working on particular projects, or create scorecards at the individual level to encourage employees to achieve their own goals.
2. Outline your goals
What is it that you want to achieve with your KPI scorecards? Do you want to improve your customer retention rates, or generate more website traffic? What about improving marketing campaigns or employee satisfaction?
Choose any goal you want—but before you create a KPI scorecard, you’ll need to outline those goals clearly and choose the right KPIs to track along the way.
As you define your goals, also think about the time frame. For example, if you want to reduce churn by a certain percentage by the end of the next financial quarter, then your scorecard will need to reflect progress toward that goal over the specified time period.
Tip: Try the SMART criteria!
Having trouble defining goals? One way to get clear on your goals is to follow the SMART criteria. “SMART” stands for Specific, Measurable, Achievable, Relevant, and Time-bound. Using this approach instead of generalizing makes your goals crystal clear.
For example, you could set a goal to reduce your customer acquisition cost (CAC)—but that’s pretty vague. Follow the SMART criteria to refine that goal.
- Specific: You want to reduce the cost of acquiring customers on social media
- Measurable: You know how much it costs to acquire customers on social channels currently—and you’ll continue analyzing that data as you work to lower the cost
- Achievable: You can’t lower your CAC to zero, but you do need to come up with a realistic percentage to target
- Relevant: Think about the reasons why you’re pursuing this goal—for example, because your CAC is rising faster than other costs, or your CAC for one product is disproportionate to another
- Time-Bound: Set a realistic date by which you anticipate meeting your goal
3. Choose your KPIs
With your goals fully outlined, you’re ready to choose KPIs, right? Not so fast!
First up, make sure you learn the difference between KPIs and metrics so that you don’t accidentally fill your scorecard with metrics instead of KPIs. Here’s the basic difference:
- Metrics: What you measure your success against
- KPIs: Quantifiable measures of progress toward your goals
Let’s take the example of customer acquisition cost from above. CAC is most commonly used as a KPI—in other words, businesses use it to track progress toward optimizing their CAC—but it also functions as a metric. Compare your numbers to a benchmark or industry standard. If the average CAC in your industry is $100, compare your CAC to this metric to see if your costs are higher or lower than the industry standard.
Once you’re clear on your KPIs vs. metrics, choose KPIs that are relevant to the goals you want to achieve. There are dozens of KPIs to choose from, so take your time and choose those that best fit what you want to accomplish.
Tip: Less is more!
You could create a KPI dashboard that tracks a few dozen KPIs related to your goals—but often, the better approach is to minimize. It’s the whole “can’t see the forest for all the trees” conundrum. You don’t want to get lost in too much data, and you definitely don’t want to spend all of your time on analytics to keep your KPI reports current.

Start with around 10 to 15 different KPIs and go from there. You may find that removing some or adding a few more strikes the right balance for your particular objectives. 🌻
4. Develop specific targets to achieve
By now, you should have in mind your strategic objectives and a list of effective KPIs to use to track progress toward those objectives. The next question is: At what point will you reach your goal?
If you’re tracking sales KPIs—perhaps measuring the number of qualified leads who ultimately convert—your objective is likely to increase the number of conversions. But by how much, and over what period of time?
Developing targets means coming up with specific numbers to hit. In the case of conversion rates, maybe you want to increase from your current 10% conversion rate to 15%, and you want to hit that number within three months.
5. Find the right tools to track your KPIs
Now that you’ve defined your goals, selected KPIs, and set attainable targets to achieve, you’re almost there. The last step? Choose a tool to help you track those KPIs.
Some default to an Excel spreadsheet for this—and it is a workable option if you’re only tracking a few basic things. But spreadsheets may not give you all the functionality needed to properly visualize progress toward your business goals.
Remember, too, that KPI scorecards are meant in part to increase transparency—and spreadsheets just aren’t as easy to share as a KPI dashboard that every member of your team has access to at any time.
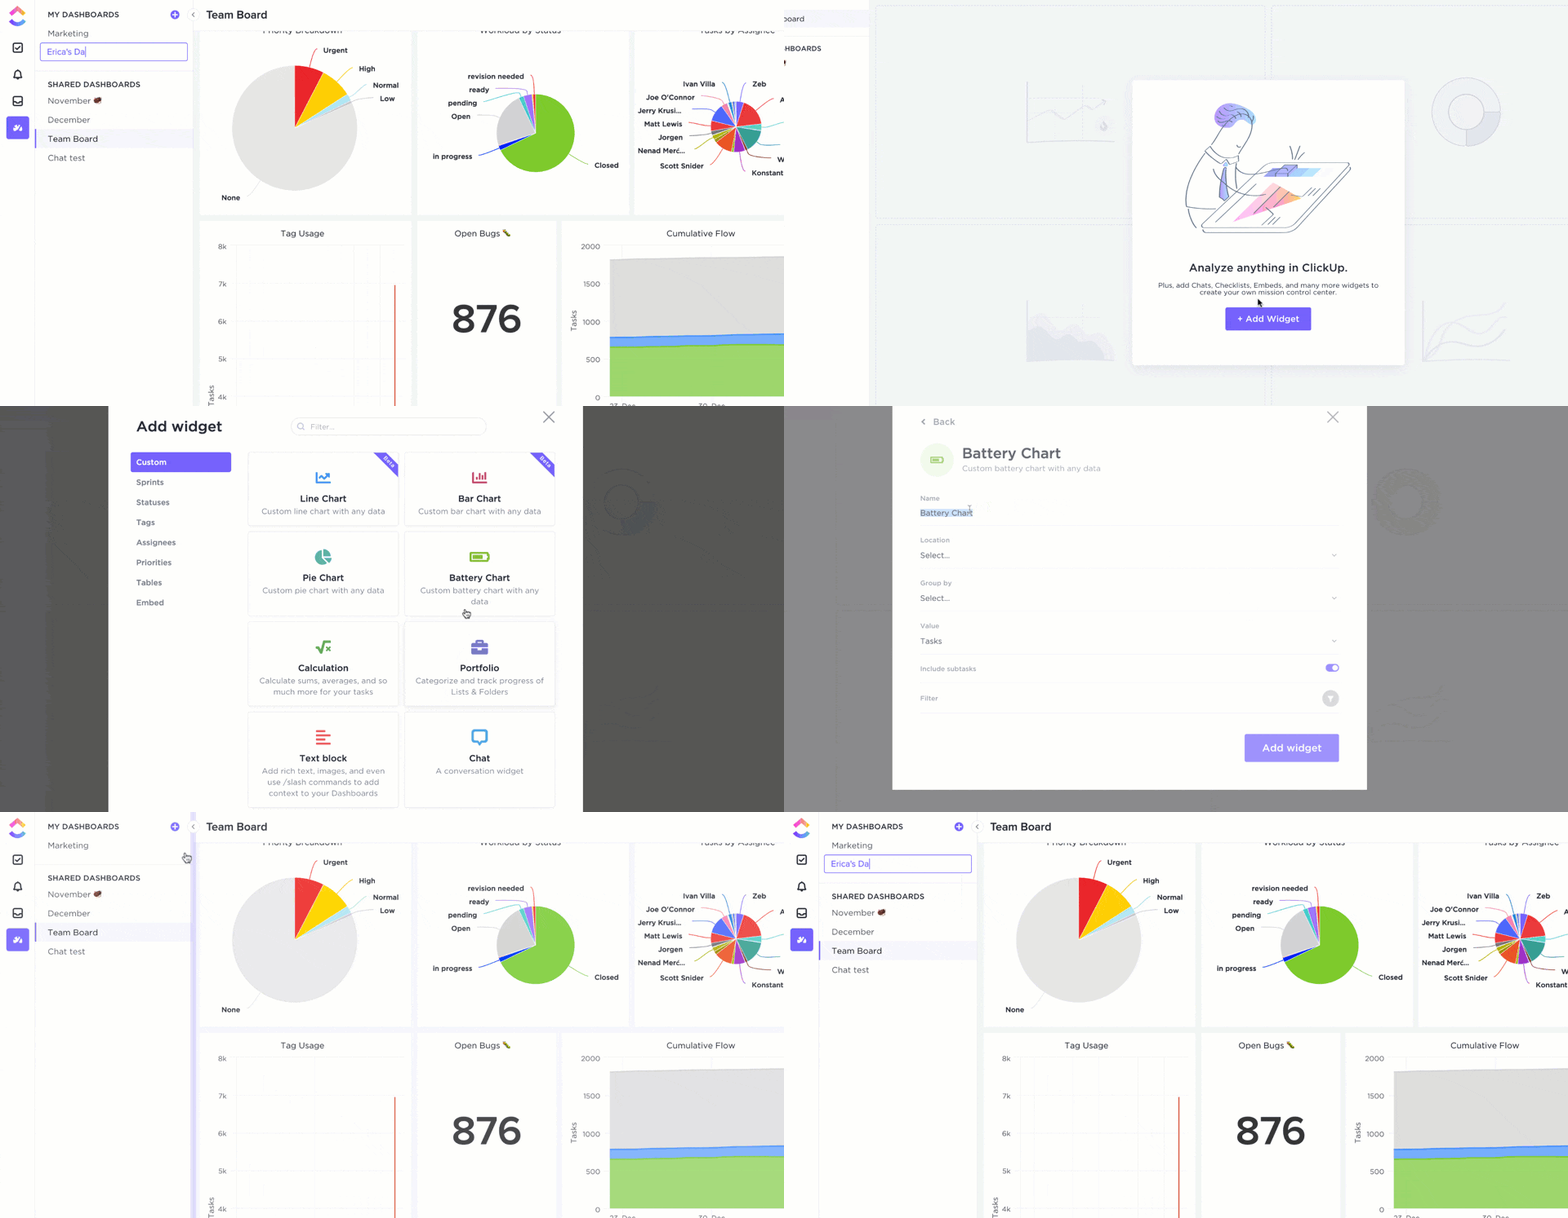
Instead of going the spreadsheet route, consider using a project management platform. The best among these platforms offer all the bells and whistles—not just the ability to manage multiple projects easily, but also spaces for you to monitor analytics, build KPI dashboards, and more.
Tip: Try ClickUp!
If you’re looking for that one tool to rule them all, ClickUp is what you want. It’s a project management platform that gives you a huge range of features and functionality, including the ability to plan projects and track and prioritize tasks.
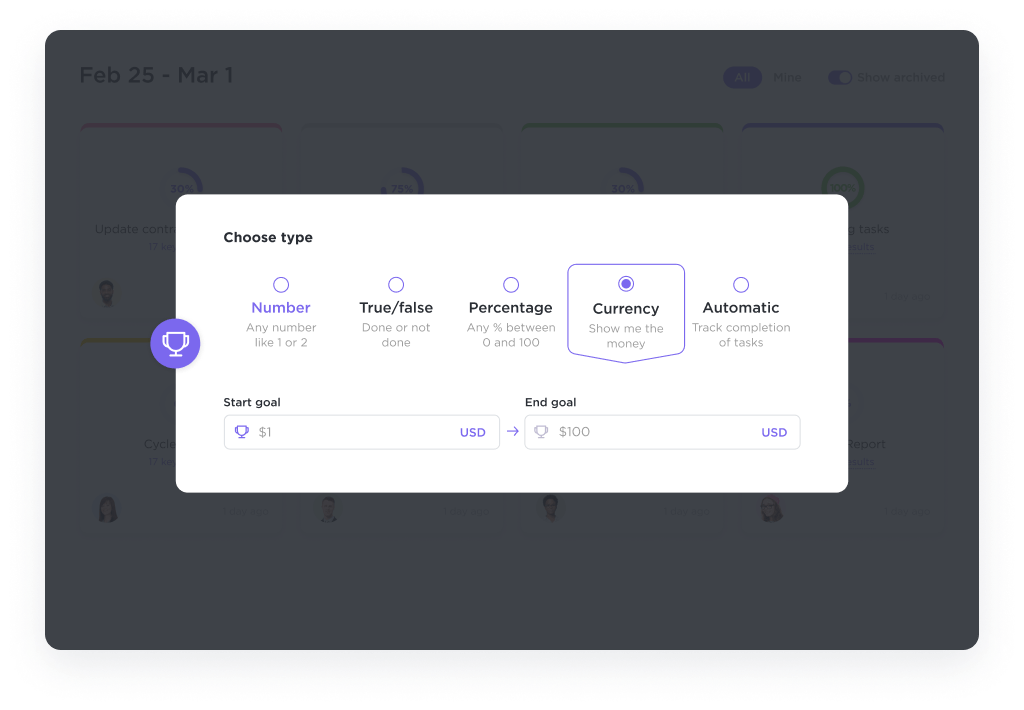
And where KPI tracking is concerned—that’s where ClickUp really shines. Rather than using separate apps or software for your KPI scorecard, use ClickUp Goals to create trackable goals that are connected to your work. Even better, ClickUp Goals let you track progress in a variety of different ways. Create task targets, monetary goals, numerical targets, and more, all in an easy-to-use dashboard that will keep your whole team on track. 🙌
Meet Your Goals with ClickUp
What are your goals? Maybe you want to start tracking KPIs, or maybe you need a platform to track tasks, improve collaboration, or plan projects more efficiently.
Why not all of the above? ClickUp gives you the features to meet all of these goals and then some. Sign up for free—and start exploring to discover all the ways ClickUp achieves your goals.


