Sorry, there were no results found for “”
Sorry, there were no results found for “”
Sorry, there were no results found for “”
Wellingtone has surveyed project practitioners since 2016, and across that run the top two challenges have always been the same two: poorly trained project managers, and attempting to run too many projects. In the 2026 report, training finally improved enough to fall to eighth place. Managing multiple projects didn’t get any easier.
Managing multiple projects is the practice of running several active projects as one portfolio, with a shared ranking, shared people, and a single decision cadence. Almost every guide treats it as a visibility problem, which is why almost every guide ends up recommending a bigger dashboard. Visibility helps. It is not what breaks first.
TL;DR: Multi-project management is a subtraction problem wearing a visibility costume. The number that governs your portfolio is your concurrency ceiling, meaning the count of projects you can make a real decision about in one week. Everything above that line is being monitored, not managed. This guide covers how to find that ceiling, how to enforce it at intake, how to pick between spreadsheets and portfolio software honestly, and the seven steps that hold a multi-project portfolio together once you have.
Managing multiple projects means coordinating separate projects that compete for the same people, budget, and attention, while keeping each one’s plan intact. In multi-project management, projects stay independent; the constraints they share are what you actually manage.
That distinction gets blurred constantly, which is expensive. A practitioner writing in PMI’s own library puts the test plainly: if the only variable your projects share is you, there is no reason to merge their schedules. Merge them anyway, and you’ve built a plan nobody can read to answer a real question.
Three terms get used interchangeably here, and knowing which one you are actually doing tells you which artifacts you need.
| Term | What it coordinates | What success looks like | Who usually owns it |
|---|---|---|---|
| Multiple projects | Unrelated projects sharing people and calendar time | Each project lands; nobody is double-booked | A project manager or team lead |
| Program | Related projects delivering one connected outcome | The combined benefit arrives, even if one project slips | A program manager |
| Portfolio | Every project the organization has chosen to fund | The mix of work matches strategy; low-value work gets cut | A PMO or portfolio manager |
Most people searching for this are doing the first row and being asked to report like the third.
This guide uses the word portfolio throughout, even though your projects probably aren’t a formal portfolio in the PMO sense. The reason is practical: the moment you share people or decisions across projects, you need the same mechanics a portfolio manager uses, just without the governance layer. You need a ranked list, a capacity view, and a stop mechanism.
Multi-project work fails in four recognizable ways, and a lack of effort or hard work isn’t one of them. Each has a different fix, which is why generic advice doesn’t work.
Two projects can have clean, independent timelines and still collide, because the same senior engineer sits on the critical path of both. Timeline software shows you dates. It rarely shows you that Priya is the constraint in weeks 3, 4, and 7 across three plans. Wellingtone’s respondents rank resource management among the hardest processes to embed anywhere in project management, because the conflict lives between plans, not inside one.
No plan has a line item for reorientation. Microsoft’s 2025 Work Trend Index special report found that employees are interrupted as often as every two minutes during core hours. In the accompanying survey of 31,000 knowledge workers, 48% of employees and 52% of leaders said work feels chaotic and fragmented. Add a third project to someone’s plate, and you’ve not added a third of a workload. You’ve added a new set of contexts that they must reload every time they come back.
The more projects you run, the more of your week goes to describing them. In the Wellingtone data, 72% of respondents spend half a day or more each month manually collating project status information. Around half have no access to real-time project KPIs. That is a portfolio being narrated rather than steered. A status report that a human assembles by hand is already out of date when it is read.
This one does the most damage because it is the least visible. Projects get added by anyone with urgency and removed by almost nobody. Too many teams don’t have a defined approach to selection that would ensure that not every idea turns into a project. Without a stop mechanism, a portfolio only grows, and every project in it gets thinner.
Managing multiple projects as one system changes three things: projects get attention before they become emergencies, one project’s slippage stops silently cascading into others, and new requests force a comparison instead of landing on top of the pile. The failure modes above show what happens without a system. Here is what changes with one.
Unmanaged portfolios follow the loudness curve: the project generating the most noise gets the most attention. When you’re managing multiple projects efficiently, this changes. Because you know that your decision budget is finite, you allocate proportionally more to the early-stage and off-track projects that are expensive to fix later. The quiet project that suddenly explodes in week six is almost always one nobody budgeted decision time for in weeks two through five.
A baselined portfolio lets you see that Project B slipping by a week means the shared designer now collides with Project D’s review phase. Unbaselined portfolios absorb that slip invisibly: nobody notices until two projects miss the same month.
The long-term effect can be expensive. One project slipping a week is recoverable. Three projects losing four days each because of the same root cause can cost you an entire quarter.
Without an intake gate, every new project is additive. With one, a new request is a forcing function. It makes the existing rank visible, demands a comparison (“Is this more valuable than what is currently fifth?”), and sometimes kills a zombie in the process.
When teams have a working intake gate, conversations about what to add become conversations about what to stop, and the portfolio gets sharper each time rather than wider.
Your concurrency ceiling is the number of projects you can make a real decision about in a single week. The word doing the work there is decide, not track. Everything above that line is being watched rather than managed.
This is the reframe many miss. They assume the failure is that you can’t see everything, so they prescribe a consolidated view. But a dashboard showing 14 projects to a manager with the authority and bandwidth for five has not solved anything. It has made the overload legible, and legible overload feels worse, because now you can watch every project you are neglecting in real time.
Johanna Rothman has spent a career on exactly this problem and wrote the book on it. As she frames the whole discipline in Manage Your Project Portfolio:
You can do it all. Just not all at the same time.
Rothman is explicit that portfolio management does not require heavy statistics or complex math. It requires people willing to rank work from first to never. The math that does matter is small enough to do on a napkin.
Count the hours you genuinely have for project decisions each week. This includes reviewing status, unblocking, renegotiating scope, and re-ranking. For most people carrying delivery plus their own deliverables, that is four to six hours, not 40.
Then estimate the decision cost per project: about 45 minutes a week for a steady project in execution, closer to two hours for one that is early, political, or off track. Most portfolios are a mix. Say you have three steady projects and two difficult ones: (3 × 0.75) + (2 × 2) = 6.25 hours of decision cost.
A manager with five decision hours has already overshot by more than an hour, and the difficult projects suffer first because they need the most attention and get the least.
The useful part is what the number does to the conversation. “I am at capacity” is a feeling a stakeholder can argue with. “My ceiling is four, I am carrying eight, here are the four I propose to pause” is a decision they have to make with you.
Whatever you build it in, a working multi-project system carries these 10 things. Missing any one of them produces a specific, predictable failure.
The baseline item is worth pausing on. A third of respondents in Wellingtone’s survey have projects that aren’t baselined, which makes “are we behind?” an unanswerable question across a portfolio.
These steps are tool-agnostic. Each works in a spreadsheet, and each works better with software once you are past the ceiling where a spreadsheet stops being honest.
List every active project on one page. Include the ones that arrived as a favor, the ones that are technically paused but still generating messages, and the ones you inherited. Assign exactly one human name to each.
This step almost always surprises people because the count comes in higher than expected. A marketing lead who describes their load as “four campaigns” typically writes down nine items once the website refresh, the recurring newsletter revamp, and the two vendor migrations get counted. You can’t set a ceiling against a number you have never actually written down.
Force a single ordered sequence. If two projects share a rank, the tie will be broken later by whoever emails most persistently.
Rank projects on expected value and the cost of delaying, not on how loudly the project is being requested. The “never” bucket matters as much as the top. A project you have honestly declined stops consuming attention, while a project that stays vaguely alive keeps costing you decisions.
Calculate the ceiling using the decision-hours math above, then treat it as a hard number. When the portfolio is full, a new project can’t start until something finishes or pauses.
This is a work-in-progress limit applied one level up from tasks, and it borrows the same logic Kanban teams use on a board. The intake gate is what makes it real: new requests land, get scored, and either displace something or wait. Without the gate, the ceiling is a preference. With it, the ceiling is a rule, and “not yet” becomes a defensible answer rather than an apology.
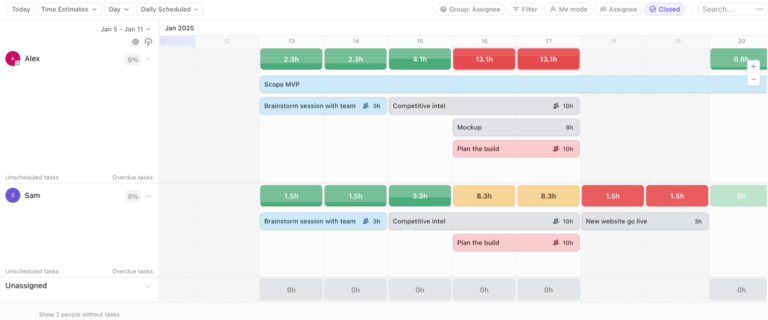
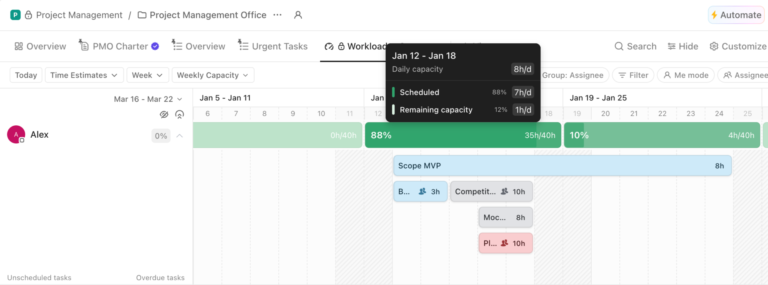
Build a view of who is committed where, by week. This capacity planning check is the single most useful step in multi-project work, and the one most teams skip.
You are looking for two things:
In a spreadsheet, this is a grid of people down the side and weeks across the top. In portfolio software, it is a workload view. Either way, the output is the same: a short list of names to renegotiate before the month starts, rather than after it breaks.
A project management calendar that shows every project’s deadlines against your actual availability makes the collisions visible a week early instead of the morning they land.
Design each view around the question it answers, then delete anything that doesn’t help answer it. A single view that tries to serve every audience serves none.
Three views cover most portfolios:
Executives read the first, you act on the second and third. Building a fourth “everything” view is how dashboards get abandoned.
Hold one standing 30-minute slot each week where the rank can actually change, and something can be paused. The meeting has one job: end the week with something paused or re-ranked.
The agenda is three questions. What changed in the shared-people map? Which project is now the constraint? What are we stopping or deferring to protect the top of the rank? If nothing is ever paused in this meeting, it has turned into a status readout, and the giveaway is that attendance starts drifting.
It’s also essential to name the person who can say stop. The weekly review only works if someone in the room has the authority to pause a project without escalating further. In most teams, this is a director, a PMO lead, or a head of department. In smaller teams, it is whoever controls the headcount. Write that name into the review’s standing terms of reference. If nobody in the room can pause work, the meeting is advisory only.
Every project you add multiplies meetings, threads, and check-ins faster than it adds output. Batch your coordination and defend the blocks where work actually happens.
Consider putting all cross-project check-ins on the same two days, and keep the other days free of recurring meetings. Use written updates and async communication to share status, instead of a call. Rothman draws a useful line here between context switching and multitasking: switching is survivable if you leave each project in a clean state, whereas multitasking leaves you holding all of them at once.
Engineers running three codebases often solve this by giving each project a distinct editor color scheme. The eye knows which world it is in before the brain does. That doesn’t remove the switching cost, but it shortens the reload.
There are three honest options for tracking multiple projects. Wellingtone found 22% of respondents still plan in Microsoft Excel, with a further 11% running no project management solution at all. A third of the profession is doing this in a spreadsheet or in their head, and plenty of them are doing fine.
| Approach | Where it holds up | Where it taps out | Best for |
|---|---|---|---|
| Spreadsheets (Excel, Google Sheets) | One row per project, any columns you want, zero setup cost | Nobody updates it but you; no link between the summary and the actual work | Two to six projects with one owner each |
| Single-project tools (Trello, Jira, Microsoft Project) | Excellent inside one project’s workflow | Cross-project rollup is an add-on, a plugin, or a manual export | Teams whose projects genuinely do not share people |
| Portfolio-capable software (ClickUp, Asana, monday.com, Smartsheet, Wrike) | Rollup views, workload across projects, automated status | Needs a hierarchy decision before it pays off; more setup than a short list deserves | Six or more projects sharing a resource pool |
A spreadsheet is the fastest way to get one row per project with owner, phase, next milestone, and a health flag. It is genuinely good at the summary layer.
The catch is structural rather than technical. The spreadsheet is a copy of reality, so it is only as current as your last manual update. Multi-project Gantt charts in Excel are possible and get built often, but dependency edits become brittle past roughly 15 linked tasks.
Best for: Two to six projects where you are the only person who needs the cross-project view
Skip it if: More than one person has to keep it accurate, or if the projects share people whose capacity you need to see
Trello, Jira, and Microsoft Project are strong within a project’s own workflow. Trello’s board model is hard to beat for a small team running visible work, and Jira’s project management model is built for engineering throughput.
The limitation shows up at the seam: each of these is organized around one project’s board, backlog, or schedule. Seeing across projects usually means a plugin, a master file, or a person exporting to a sheet on Friday. That is workable at three projects and painful at nine.
Best for: Teams already deep in one ecosystem whose projects rarely draw on the same people
Skip it if: Your main question is “who is overloaded next month,” which is a cross-project question these tools answer indirectly
ClickUp, Asana, monday.com, Smartsheet, and Wrike all support a portfolio layer. This means a view that treats each project as a record with status, owner, and dates, plus workload views that total commitments per person across projects. This is the category that answers the cross-project questions directly, instead of by export.
The honest cost is upfront thinking. These tools all make you decide on a hierarchy first, and a hierarchy chosen badly in week one is annoying to unpick in month six. Below roughly six projects, the setup rarely pays for itself.
Best for: Six or more concurrent projects drawing on a shared resource pool.
Skip it if: You have three projects and a spreadsheet that everyone already reads.
For tool-by-tool comparisons rather than categories, our roundup of project management software for smaller teams covers the entry tiers. For a deeper look at what to put in that layer, see our walkthrough of the wider project portfolio management process.
You can also consider these AI tools to improve resource management and capacity planning across your projects:
Prioritize by the cost of delay, not by deadline proximity. A deadline tells you when someone asked for something; the cost of delay tells you what actually happens if the deadline moves. That’s the only input that helps when two dates genuinely conflict.
When two projects want the same week, run four questions in order:
Then take the answer to the stakeholders together rather than separately. Competing deadlines are usually two people who each believe theirs is the only one, and the conflict resolves faster in one room than in four threads. The Eisenhower matrix is a reasonable first filter for the personal version of this, though it struggles once projects have owners other than you.
Most multi-project systems work on the day they are built and quietly die within six weeks. The seven steps above get you a working portfolio. These practices keep it from decaying into another artifact nobody opens.
Your concurrency ceiling is only valid for the current blend of steady and difficult projects. A project entering its final sprint, a new stakeholder joining, or a scope renegotiation can all shift a project from 45 minutes of decision cost to two hours. Recalculate at least monthly, and treat the number as a rolling output of the weekly review, not a one-time decision.
If only one person maintains the capacity view, it dies the week they are on leave or buried in delivery. Assign a rotating owner each sprint or month. The map stays current because someone’s name is on it this week, not because everyone cares equally about accuracy.
A project that starts without a saved baseline becomes impossible to measure once the first change lands. Lock the project baseline within the first week of active work, even if the plan still feels rough. A rough baseline you can compare against is infinitely more useful than a perfect plan you never saved.
Projects that were paused three months ago but never formally killed still generate questions, meetings, and guilt. Once a month, scan the bottom of the ranked list and ask: has anyone made a decision about this in the last 30 days? If not, move it to an explicit “stopped” state. A stopped project costs nothing. A vaguely alive one costs attention every time someone wonders whether it is still happening.
The moment your portfolio view becomes what you show to leadership, you will start optimizing it for narrative instead of accuracy. Keep a clean operational view that tells you the truth (flags, capacity, blockers) and a separate project monitoring layer that tells stakeholders the story. When these are the same, you lose the truth first.
The same seven steps produce very different systems depending on what the projects share. Here is what the artifacts look like across three common cases.
The binding constraint here is billable people, and the projects are near-identical in shape. The ranking factor is mostly commercial: retainer clients above project clients, renewal-quarter clients above the rest. The critical artifact is the capacity view, because one designer across seven brands is the entire risk.
The concurrency ceiling here applies per person, not per portfolio: two active client projects each, with a third only if one is in a review phase. The weekly review is where scope creep gets caught.
An in-house team may have fewer projects, but deeper interdependence. Two initiatives probably wait on the same platform work, which makes cross-project dependencies more critical than capacity. The rank should follow the dependency graph: whatever unblocks the most downstream work goes first, even if it is the least visible to leadership.
The ceiling is low, often three, because each initiative demands genuine design and engineering thought rather than coordination. The failure mode is a platform project being deprioritized because it has no customer-facing date, which then stalls everything behind it.
Managing multiple construction projects inverts the usual priority. The shared constraints are equipment, subcontractors, and inspection windows, and those have real sequencing costs that software can’t wish away. A crane booked for site B on the wrong week means idle labor on site B and rescheduled inspections on site C. The critical artifact is a shared-resource calendar covering plant and subcontractors, maintained ahead of the individual site schedules.
The ceiling is set by travel time as much as decision time, since site presence is not substitutable. Weekly review here is genuinely weekly, because the weather can make any longer cadence hard to keep consistent.
The five mistakes that sink a multi-project portfolio are merging plans that share nothing, treating “high priority” as a rank, setting the ceiling per portfolio instead of per person, reporting status instead of making decisions, and planning at 100% capacity. Each is worth naming by its symptom, because that is how you catch it. Most people reading this have made at least three.
What it looks like: A master schedule combining projects with no shared resources or handoffs, which nobody opens because it answers no question either project owner has.
The fix: Keep separate plans and build a thin summary layer above them. Merge schedules only where a genuine dependency or shared person exists.
What it looks like: Six projects are tagged high, and the one that gets attention each day is whichever stakeholder followed up most recently.
The fix: Force an ordered list. Ranks are integers, and two projects cannot both be third.
What it looks like: The team agrees to cap active projects at eight, and one designer is still on six of them. A portfolio-level cap can be met while individuals are far past their own limit.
The fix: Set the ceiling where the work actually happens. Cap concurrent projects per person, then let the portfolio total be whatever those caps add up to.
What it looks like: A weekly portfolio meeting where every owner narrates their project, nothing is re-ranked, and the same blocker appears in three consecutive weeks’ notes.
The fix: Automate the narration and spend the meeting only on the constraint and the trade-off.
What it looks like: Every person is fully allocated across projects, so one sick day or one scope change cascades into three plans.
The fix: Plan people to about 80% and leave the gap deliberately. Across a multi-project portfolio, the slack is the only thing absorbing variance. Flow efficiency is the metric that makes this visible if you need to argue the case with numbers.
ClickUp sits in the portfolio-capable category above, and the parts that matter for multi-project work map onto the artifacts that this guide has already described.
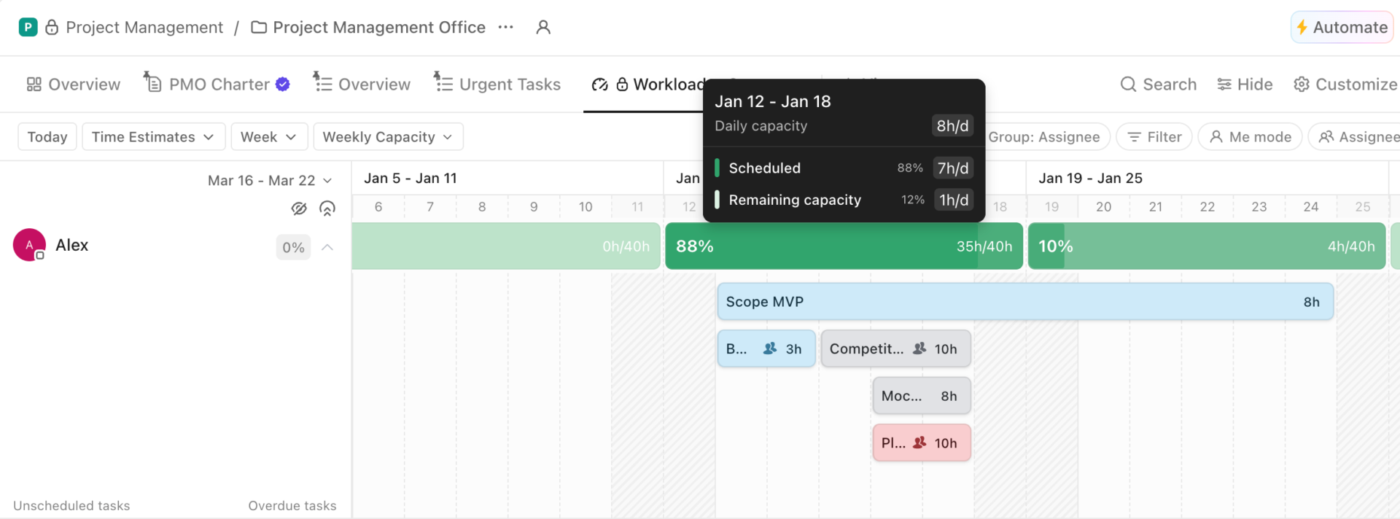
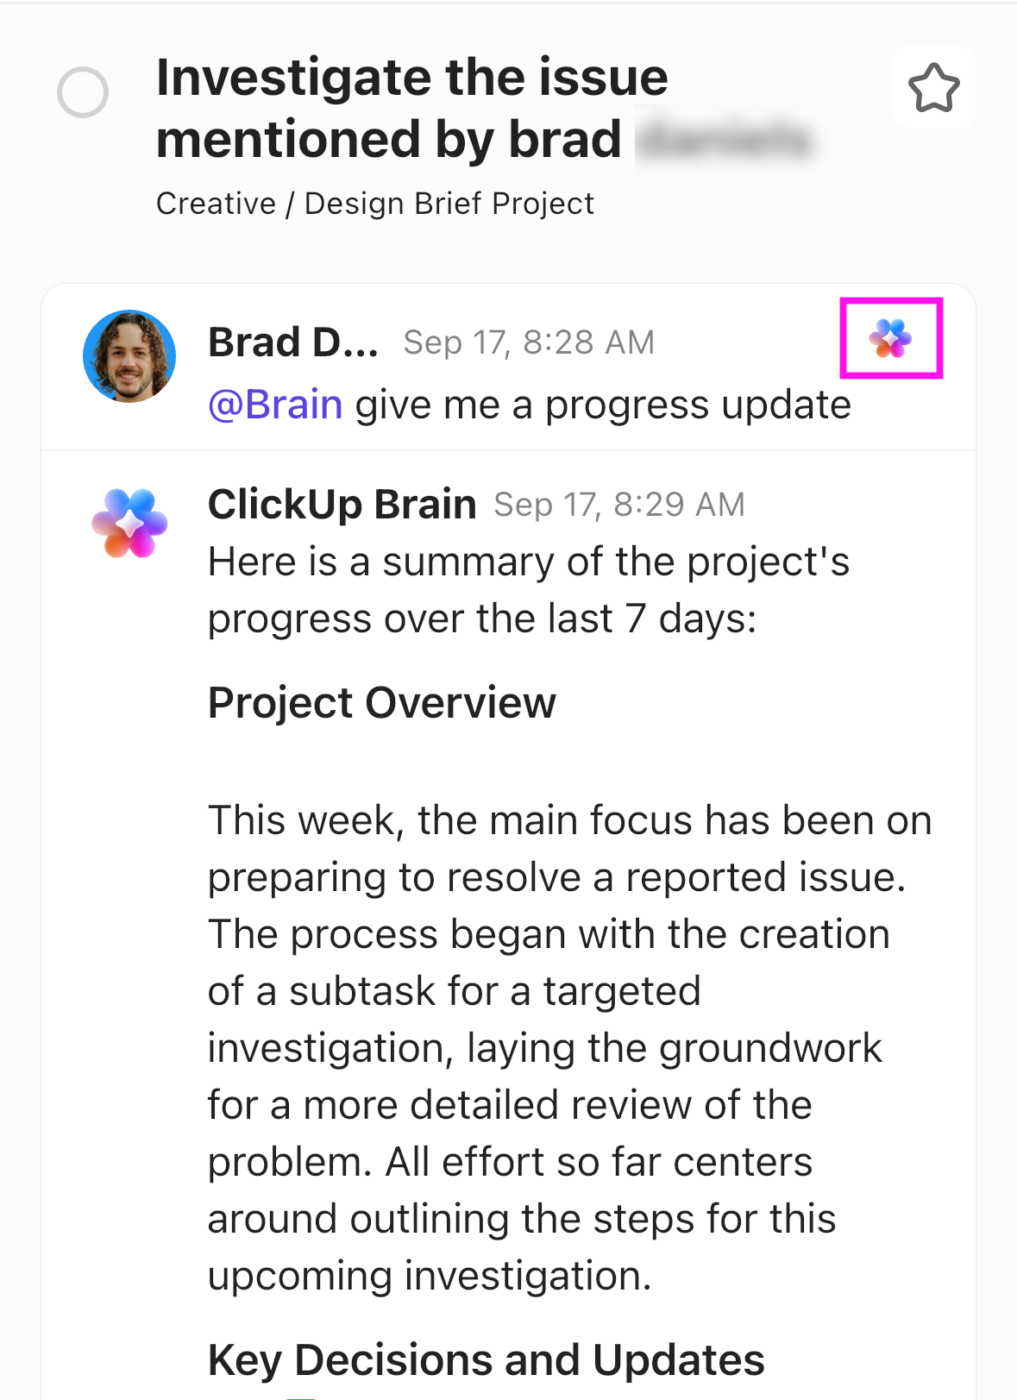
In practice: Plus972, a New York branding agency under 50 people, runs 30-plus concurrent client engagements in one workspace: three development teams, design, PM, and pre-sale work. The setup follows the same artifacts described above. Every Space maps to a real business function, with a portfolio view across the top, and Dashboards surface capacity and blockers in real time instead of the round of Slack messages that used to pass for status.
Senior Project Manager Kateryna Brik notes the team previously “kept the agency on schedule by carrying the system in their heads.”
Like every tool in this category, ClickUp asks you to decide on a hierarchy of Spaces, Folders, and Lists before the portfolio views earn their keep. This means that teams arriving from a single-purpose tracker usually spend their first week on that decision rather than on their projects. For two or three projects with one owner each, a shared spreadsheet will get you a working summary faster. ClickUp fits best once projects outnumber the people running them and the cross-project questions have started arriving weekly.
If you take one thing from all of this, take the count. Write down every active project, work out how many hours a week you genuinely have for decisions, and divide. Whatever number comes back is your concurrency ceiling, and the projects above it are already being neglected, whether or not you have admitted it.
Then do the harder half. Rank the list, name who can stop things, and put a weekly slot on the calendar where stopping is allowed. Wellingtone’s decade of data shows that volume was never a skill problem, and no amount of individual competence fixes a portfolio that only ever grows.
Once the ceiling is set and the rank is real, software stops being a place to store projects and starts being the thing that answers cross-project questions for you. Get started with ClickUp for free and build the portfolio view, workload map, and weekly review in one workspace.
Most people can genuinely manage three to five concurrent projects, and the exact number depends on decision cost rather than project size. Divide your weekly hours available for project decisions by roughly 45 minutes a week per steady project, or two hours for a project that is early, political, or off track. Practitioners writing in PMI’s library describe running three simultaneous projects as workable but slower and more stressful than running one.
Answer with a specific system and a real trade-off you made, not with the word “prioritize.” Name the number of projects, how you ranked them, the artifact you used to spot conflicts, and one project you paused or renegotiated as a result. Interviewers are testing whether you can say no with evidence, so an answer that includes something you stopped is stronger than one where everything shipped.
The 80/20 rule, or Pareto principle, holds that roughly 80% of a project’s outcome comes from about 20% of the work. Applied across multiple projects, it argues for finding the small set of deliverables and decisions that carry most of the value and protecting those first. Treat it as a lens for where to spend attention, not as a measured ratio, since the split varies by project.
Yes, and a significant share of the profession does: Wellingtone’s 2026 survey found 22% of respondents still plan in Microsoft Excel. A single sheet with one row per project, plus owner, phase, next milestone, and health flag, is a legitimate portfolio summary. It stops working when more than one person needs to keep it current, or when you need capacity across projects, because the sheet is a manual copy of reality rather than a live view of it.
A multi-project Gantt chart plots several projects’ timelines on one shared axis so overlapping milestones and cross-project dependencies are visible together. It is most useful when projects genuinely hand work to each other, and least useful when they merely run in parallel. Keep it to milestones rather than every task, because a combined chart at the task level becomes unreadable well before it becomes wrong.

Manasi Nair
Max 15min read

Praburam Srinivasan
Max 16min read

Sudarshan Somanathan
Max 23min read

© 2026 ClickUp