
Ever tried wrangling a project timeline with a spreadsheet that looked like a Tetris game gone wrong? Yeah, we’ve been there too.
That’s where Gantt charts swoop in like the superheroes of project planning—except now, they’re powered by AI, and let’s just say… they’ve had a serious glow-up. 🦾✨
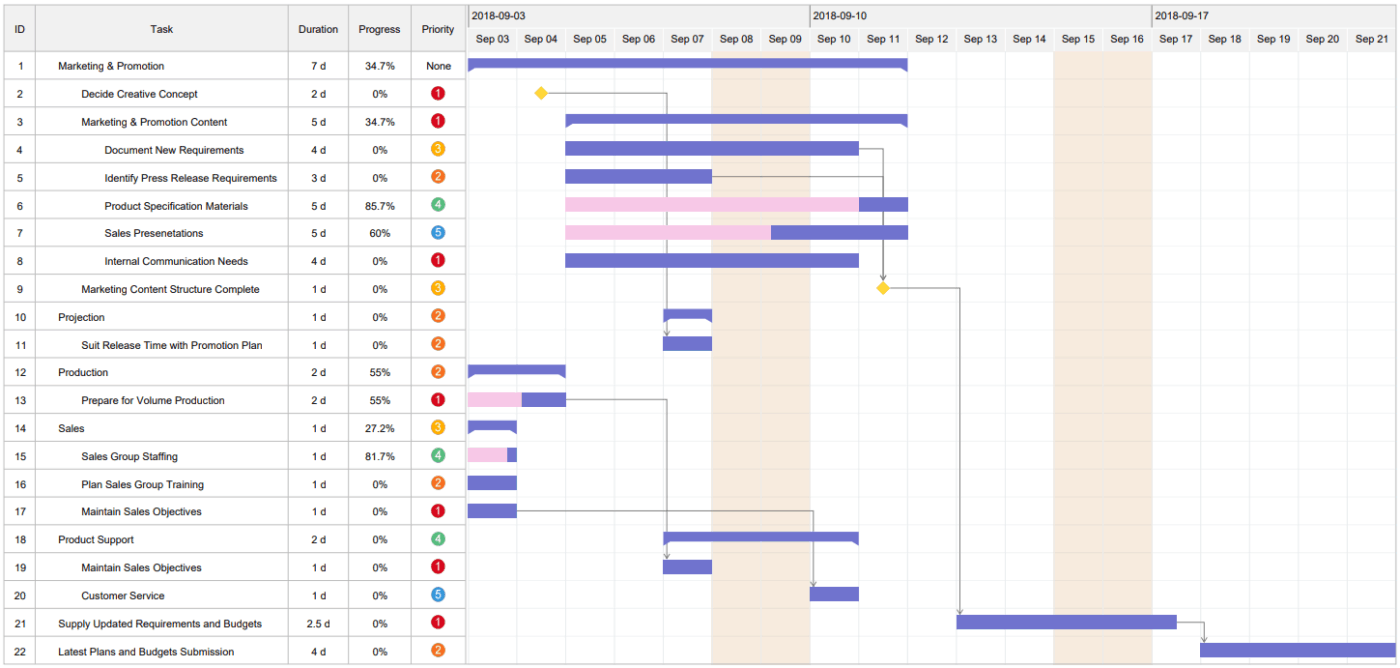
A good Gantt chart AI maker maps out dependencies, adjusts timelines in real time, and gives your team a clear view of what’s next and predicts delays beforehand.
In this post, we’re diving into the best AI Gantt chart makers that’ll help you plan projects like a time-bending wizard. Whether you’re leading a product launch, wrangling a creative team, or just trying to make sense of project chaos, these tools are here to turn your timeline from “uh-oh” to “heck yes.”
8 Best AI Gantt Chart Makers to Plan Projects Faster (2025)
- Top Gantt Chart AI Software at a Glance
- What Should You Look for In Gantt Chart AI Software?
- The Best Gantt Chart AI Software
- How we review software at ClickUp
- 1. ClickUp (Best for all-in-one project management with smart scheduling)
- 2. TeamGantt (Best for simplified drag-and-drop planning)
- 3. Gantt.io (Best for visual presentation focus)
- 4. Instagantt (Best for AI-powered schedule optimization)
- 5. Lucidchart (Best for integrated diagram workflows)
- 6. EdrawMax (Best for template-heavy chart creation)
- 7. Toggl Plan (Best for resource-focused timeline management)
- 8. Gantt Chart AI (Best for automated timeline generation)
- Gantt You Believe It? ClickUp Does It Best
Top Gantt Chart AI Software at a Glance
Here’s a quick look at the top AI Gantt chart tools and what they bring to the table.
| Tool | Best For | Best Features | Pricing* |
| ClickUp | All-in-one project management with AI-powered scheduling Team size: Ideal for individuals, startups, and enterprises | AI-generated timelines, task dependencies, automation, Workload View, and integrated and contextual AI assistance | Free forever; Customizations available for enterprises |
| TeamGantt | Drag-and-drop Gantt scheduling with personalized views Team size: Ideal for marketing teams and agencies | My Tasks view, milestone alerts, portfolio management, and client-friendly sharing | Free; Starts at $59/month per manager |
| Gantt.io | Visually polished Gantt charts for stakeholder presentations Team size: Ideal for consultants and design-focused teams | High-res Gantt chart export options, chart customization, branded layouts, and tooltip notes | Free; Starts at $8/month |
| Instagantt | AI-driven schedule optimization and project overviews Team size: Ideal for teams managing cross-functional timelines | Timeline suggestions, mobile updates, baseline tracking, public links | Free; Starts at $12/month |
| Lucidchart | Integrated diagramming for project workflows and systems Team size: Ideal for hybrid teams needing diverse visuals | Live data linking, flowchart + Gantt support, formatting AI | Free; Starts at $9/month per user |
| EdrawMax | Template-heavy Gantt chart creation across industries Team size: Ideal for enterprise teams and education sectors | Task color rules, branding, industry-specific icons | Subscription starts at $79/year |
| Toggl Plan | Visual timeline planning with capacity management Team size: Ideal for creative agencies and remote teams | Capacity warnings, color-coded work, milestone mapping, workload reports | Free upto 5 users; Starts at $6/month per user |
| Gantt Chart AI | Fully automated project timeline generation from prompts Team size: Ideal for small teams and solopreneurs | Natural language input, ML-powered durations, conversational editing | Free credits; Starts at $3 (30 credits) |
What Should You Look for In Gantt Chart AI Software?
The right AI Gantt chart maker should actively lighten your workload and keep your plans moving.
Here’s what to look for. 👀
- Automated scheduling: Adjusts timelines based on dependencies, task durations, and team bandwidth
- Predictive insights: Flags potential delays early and suggests realistic adjustments
- Live updates: Reflects changes across Gantt charts in real time as tasks progress
- Smart resource planning: Recommends optimal allocation of team members across projects
- Workflow learning: Tailors suggestions to your team’s unique planning patterns
- Bottleneck detection: Highlights blockers in achieving project milestones before they disrupt delivery
- Custom views: Allows switching between high-level and detailed timelines effortlessly
The Best Gantt Chart AI Software
How we review software at ClickUp
Our editorial team follows a transparent, research-backed, and vendor-neutral process, so you can trust that our recommendations are based on real product value.
Here’s a detailed rundown of how we review software at ClickUp.
If you’re ready to level up your planning, these are the Gantt chart software tools worth your time.
Let’s dive right in. 🛠️
1. ClickUp (Best for all-in-one project management with smart scheduling)
Traditional Gantt tools help map timelines, but they leave you doing all the manual work: adding tasks, calculating durations, and tracking progress.
ClickUp changes that.
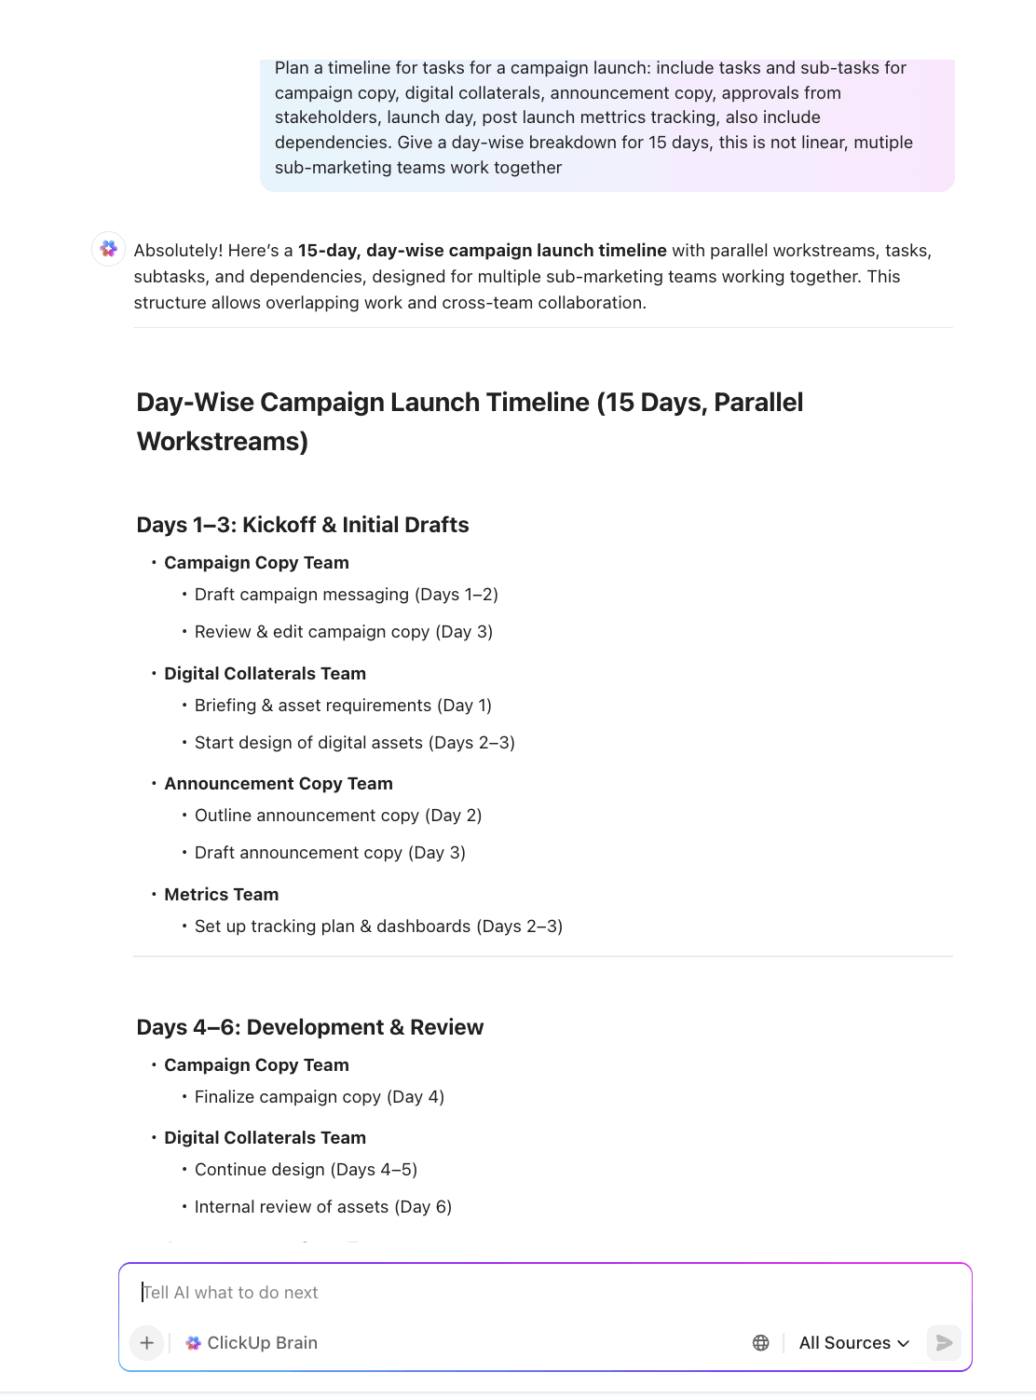
Build smarter Gantt timelines with ClickUp Brain
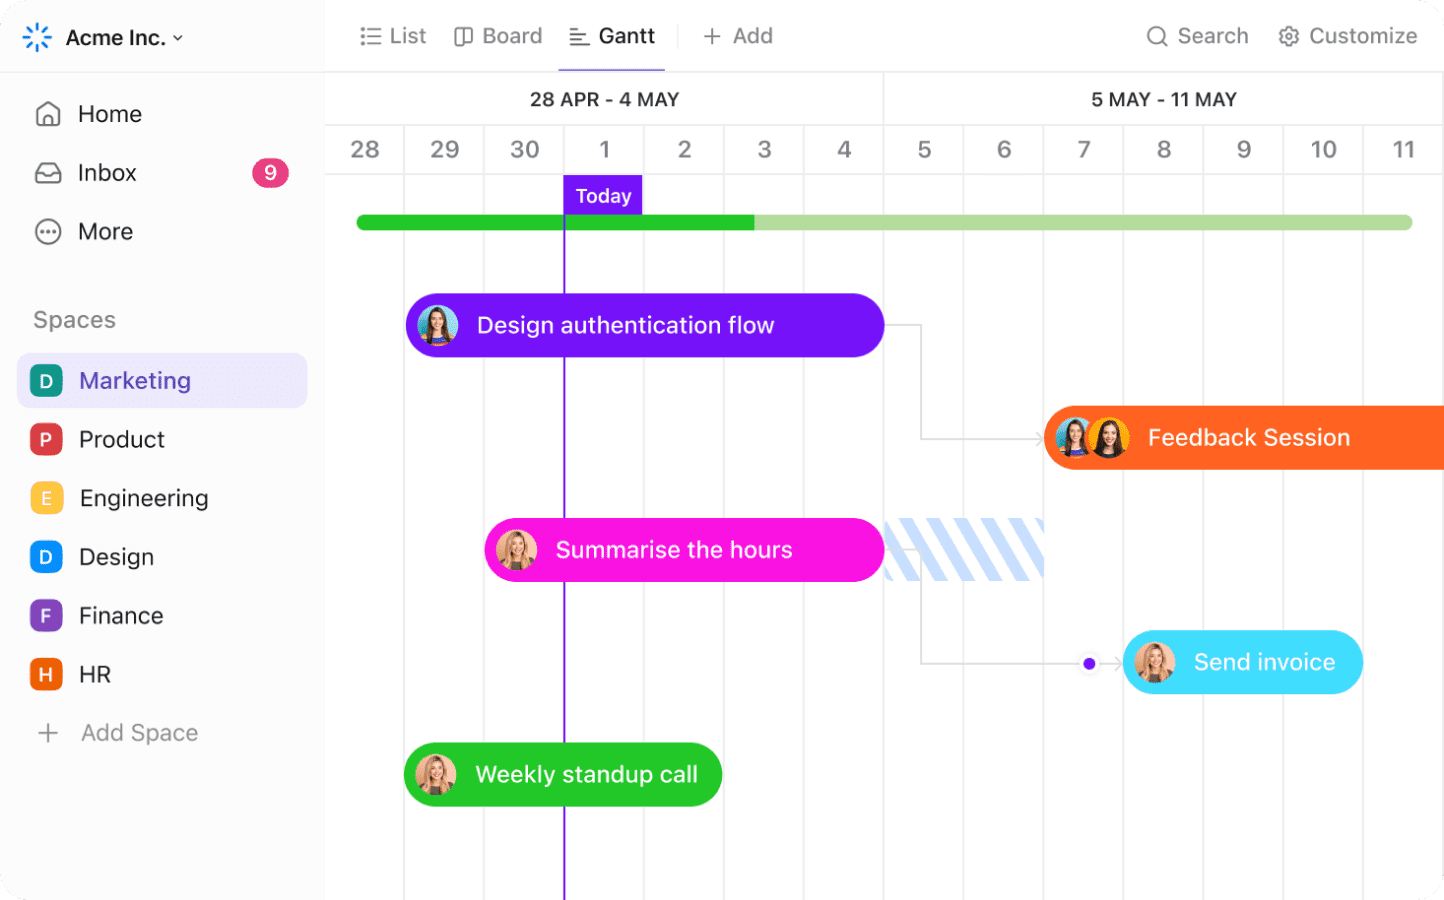
If you’re looking for a flexible visual layout for planning projects and making adjustments in real time, the ClickUp Gantt Chart View is ideal. You can map out task durations, create links using ClickUp Task Dependencies, and add ClickUp Milestones to flag high-stakes deliverables.
Watch how to use the Gantt view in ClickUp:
However, what sets it apart from other Gantt tools is its use of AI to fill the gaps in planning.
Using ClickUp Brain, you can describe your project in plain text, and the AI generates a full task list with estimated durations, recommended dependencies, and suggested milestone points.
Let’s say you’re coordinating a campaign launch. The team needs to finalize copy and messaging, design the collaterals, update socials, launch across platforms, and track metrics in real time, all within a tight deadline.
For example, if the copy edits need to happen before the new collateral design, ClickUp automatically links those tasks. If the social campaign handoff depends on completing the metrics dashboard, that chain is already mapped out, too.
These show up directly in the Gantt Chart View, so you’re not left looking at boxes but a timeline built with logic instead.
That AI-generated plan becomes the foundation for your visual timeline.
Adapt timelines as work progresses with in-built Time Tracking
Once your chart is in motion, ClickUp Project Time Tracking helps you stay grounded in reality. If the content team logs more time than planned for writing brand guidelines, you can use that data to flag risks in upcoming phases and adjust timelines directly in the Gantt chart AI view.
Automate what happens next with ClickUp Automations
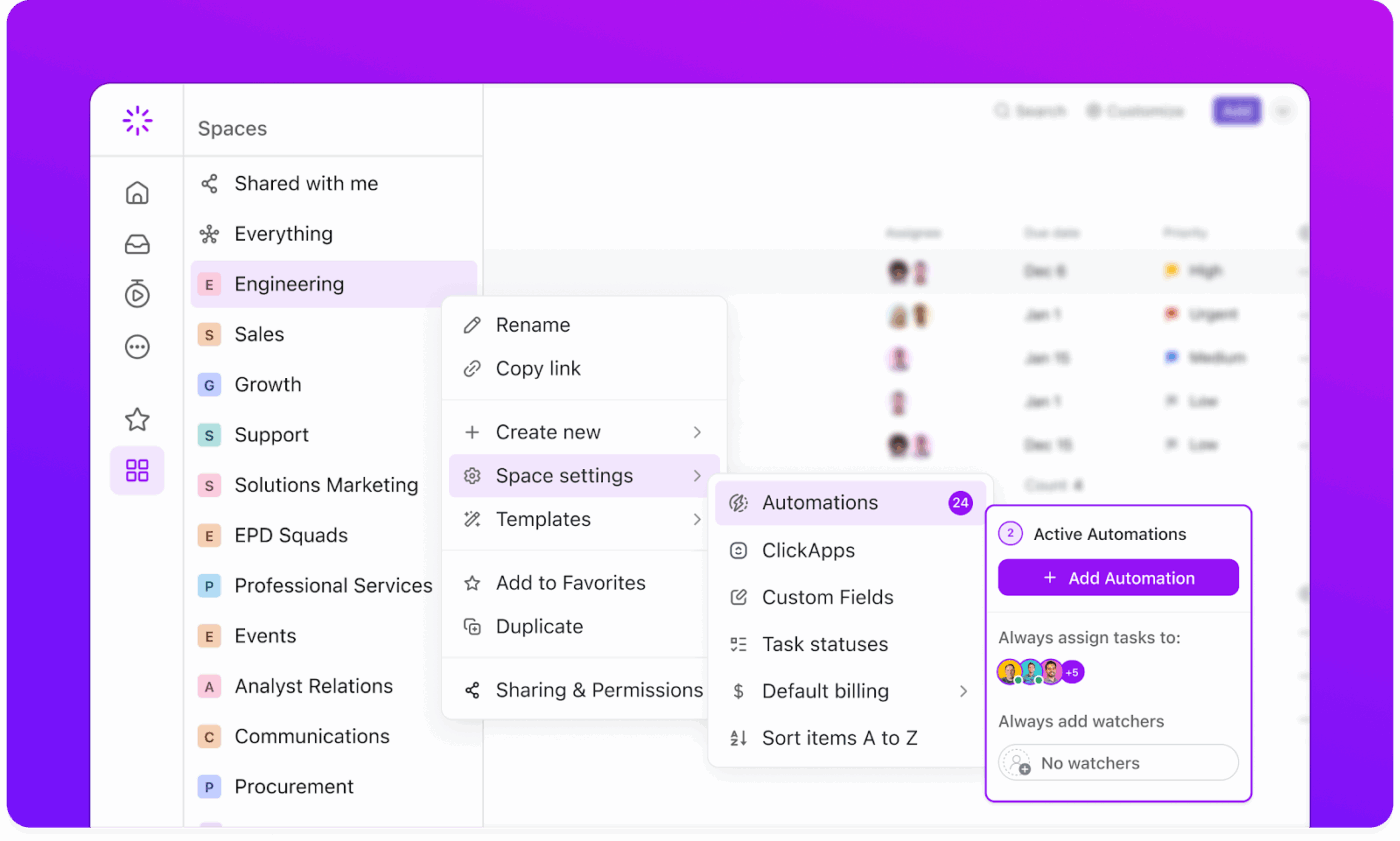
You can also set up ClickUp Automations to keep the momentum going.
For example, when a milestone like ‘Final Design Approval’ is reached, the AI scheduling assistant can auto-update the next phase’s status, notify the dev team, and assign the next task in line. This helps eliminate manual handoffs and keeps work flowing without interruptions.
ClickUp best features
- Manage capacity at a glance: Allocate tasks using the ClickUp Workload View based on availability and overall workload
- Collaborate without context switching: Share updates and discuss tasks using ClickUp Chat so everything stays in one place
- Map out ideas in real time: Build workflows using ClickUp Whiteboards and connect them directly to tasks for instant execution, catering to different visualization techniques
- Stay on top of performance: Visualize progress, time, and team effort using ClickUp Dashboards across multiple projects
- Get a schedule built for you: Automate daily planning using the ClickUp Calendar to block focus time and keep shifting tasks on track
ClickUp limitations
- It can feel overwhelming at first, especially for teams not used to highly customizable tools
ClickUp pricing
free forever
Best for individual users
Free Free
Key Features:
60MB Storage
Unlimited Tasks
Unlimited Free Plan Members
unlimited
Best for small teams
$7 $10
Everything in Free Forever plus:
Unlimited Storage
Unlimited Folders and Spaces
Unlimited Integrations
business
Best for mid-sized teams
$12 $19
Everything in Unlimited, plus:
Google SSO
Unlimited Message History
Unlimited Mind Maps
enterprise
Best for many large teams
Get a custom demo and see how ClickUp aligns with your goals.
Everything in Business, plus:
White Labeling
Conditional Logic in Forms
Subtasks in Multiple Lists
* Prices when billed annually
The world's most complete work AI, starting at $9 per month
ClickUp Brain is a no Brainer. One AI to manage your work, at a fraction of the cost.
ClickUp ratings and reviews
- G2: 4.7/5 (10,000+ reviews)
- Capterra: 4.6/5 (4,000+ reviews)
What are real-life users saying about ClickUp?
This G2 review really says it all:
💡 Bonus: Try ClickUp Brain MAX—the AI Super App that brings true intelligence to your Gantt charts and project planning. Say goodbye to Work Sprawl and hello to seamless, contextual project management. Here’s how:
- Instantly search ClickUp, Google Drive, GitHub, OneDrive, SharePoint, and ALL your connected apps + the web for your files
- Ask, dictate, and command your work by voice—hands-free, anywhere with Talk to Text
- Leverage premium AI tools like ChatGPT, Claude, and Gemini right from the app, with a single, contextual, enterprise-ready solution
With ClickUp Brain MAX, managing complex Gantt charts becomes smarter, more efficient, and fully integrated into your project management ecosystem.
2. TeamGantt (Best for simplified drag-and-drop planning)
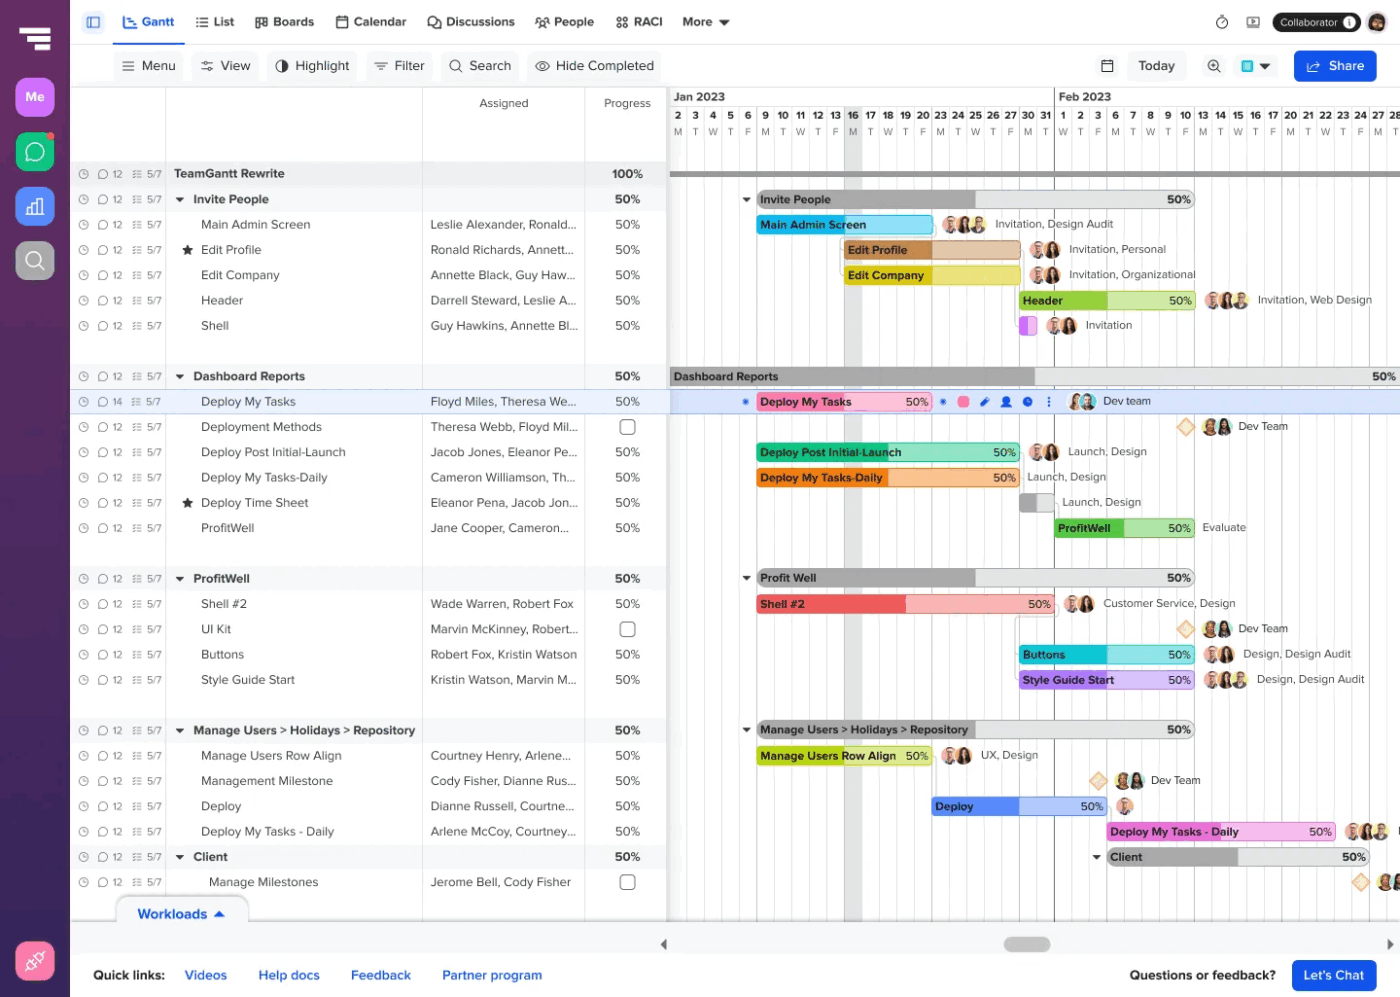
via TeamGantt
TeamGantt transforms complex project scheduling into something anyone can handle. Its drag-and-drop interface allows users to create tasks by dragging over dates in a calendar, making timeline adjustments feel natural.
What sets it apart is its My Tasks view, which gives team members a personalized dashboard without forcing them to navigate complex project hierarchies. The Gantt chart AI tool strikes a balance between scheduling capabilities and user-friendly design, making it accessible for teams who need robust planning.
TeamGantt best features
- Invite clients and stakeholders to view project progress without editing access to maintain control over your project timeline
- Set up automatic email alerts for team members when tasks are assigned, deadlines approach, or project milestones are reached
- Create portfolio views as Gantt chart alternatives to display multiple projects simultaneously for a bird’s-eye perspective
- Generate percentage-complete indicators that automatically calculate project progress based on completed tasks
TeamGantt limitations
- No advanced resource management capabilities for complex projects
- Some reviews note UI quirks, like difficulty with undo operations, resizing columns, or navigating annotations, which can be frustrating
TeamGantt pricing
- Free
- Pro: $59/month per manager
- Unlimited everything: Custom pricing
- Construction edition: Custom pricing (billed annually)
TeamGantt ratings and reviews
- G2: 4.8/5 (890+ reviews)
- Capterra: 4.6/5 (200+ reviews)
What are real-life users saying about TeamGantt?
Straight from a G2 review:
📮 ClickUp Insight: 31% of managers prefer visual boards, while others rely on Gantt charts, dashboards, or resource views.
But most tools force you to pick one. If the view doesn’t match the way you think, it just becomes another layer of friction.
With ClickUp, you don’t have to choose. Switch between AI-powered Gantt charts, Kanban Boards, Dashboards, or Workload View in a single click. And with ClickUp AI, you can auto-generate tailored views or summaries based on who’s looking—whether it’s you, an exec, or your designer.
💫 Real Results: CEMEX sped up product launches by 15% and cut communication delays from 24 hours to seconds using ClickUp.
📚 Also Read: TeamGantt Alternatives and Competitors
🧠 Friendly Tip: Before building your task list, define key delivery points, e.g., ‘Website Launch,’ ‘Final Client Review,’ or ‘Product Beta Live.’ Then, work backward to map out what tasks must be done to hit each one. In your AI Gantt chart maker, represent milestones as distinct markers (diamonds in ClickUp).
3. Gantt.io (Best for visual presentation focus)
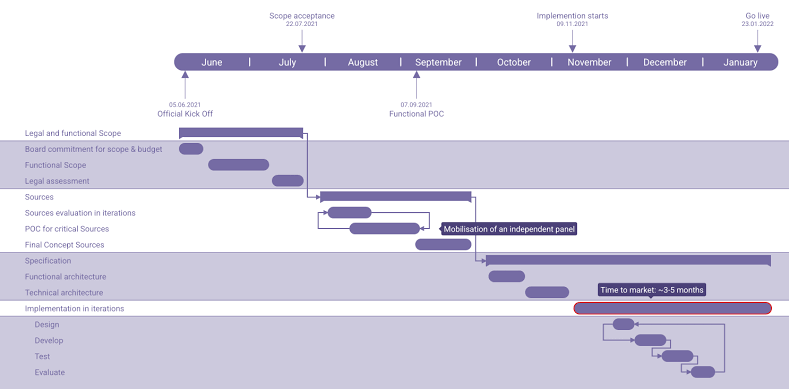
via Gantt.io
Sometimes, you need to create a Gantt chart that looks as professional as your project deserves. Gantt.io specializes in visually appealing charts that impress stakeholders and clients.
Rather than cramming every possible feature into one interface, it streamlines the experience around chart creation and presentation.
The platform supports real-time multi-user editing, meaning your team can build or tweak charts together and see updates instantly. Plus, its time travel feature lets you scroll through past versions and restore or fork charts, which is helpful for experimenting.
Gantt.io best features
- Customize every visual element of your charts, including fonts, colors, grid lines, and spacing, to match company branding
- Print charts on large-format paper or export as high-resolution images that maintain crisp quality when projected
- Add detailed task and project descriptions and notes that appear in tooltips when viewers hover over specific timeline elements
- Save multiple chart variations as task management templates so you can quickly recreate similar project layouts
Gantt.io limitations
- No built-in time tracking or resource allocation features
- It can get slow when dealing with large datasets
Gantt.io pricing
- Free
- Premium: $8/month
Gantt.io ratings and reviews
- G2: Not enough reviews
- Capterra: Not enough reviews
🧠 Fun Fact: Henry Gantt, working with Frederick Taylor, developed the concept around 1910 to track production and resources in factories, essentially creating the first visual work planner. This was one of the first few instances of the deliverables vs. time concept.
4. Instagantt (Best for AI-powered schedule optimization)
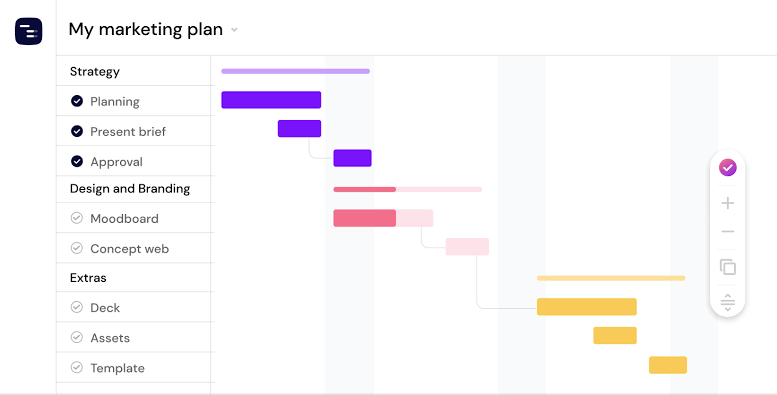
via Instagantt
Instagantt brings artificial intelligence directly into project scheduling, automating the tedious work of timeline optimization. The platform uses AI to automate schedules, optimize timelines, and streamline team collaboration for smarter, faster planning.
What makes Instagantt unique is its ability to suggest schedule improvements based on task dependencies and resource availability. The AI analyzes your project structure and recommends adjustments that could prevent bottlenecks or reduce overall project duration. It also handles the heavy lifting while keeping the interface accessible for non-technical users.
Instagantt best features
- Use baseline comparison features that show your original timeline alongside current progress, making it easy to identify delays
- Set up recurring Gantt chart templates that automatically populate with standard tasks and durations
- Let team members update task progress and view project timelines from anywhere with the mobile app
- Create public sharing links that allow external stakeholders to view project progress
Instagantt limitations
- AI suggestions may not account for unique business constraints
- Limited customization of AI optimization parameters
Instagantt pricing
- Free
- Individual: $12/month
- Team: $24/month, includes 3 collaborators ($8 per additional collaborator)
Instagantt ratings and reviews
- G2: 4.3/5 (25+ reviews)
- Capterra: 4.3/5 (445+ reviews)
What are real-life users saying about Instagantt?
This G2 review brings up an interesting angle:
📖 Also Read: Best AI To-Do List Apps & Task Managers
🎥 Watch: Here’s a video on how to use Gantt charts in ClickUp:
5. Lucidchart (Best for integrated diagram workflows)
Lucidchart approaches Gantt charts as part of a broader diagramming ecosystem, great for teams who need multiple visual tools during project planning.
Teams can seamlessly switch between creating Gantt charts, flowcharts, organizational diagrams, and process maps for a multi-diagram workflow. For instance, a product team can use a flowchart to map out features and immediately visualize timelines in a Gantt view, connecting both diagrams with linked data or shared objects.
Lucidchart best features
- Link your Gantt charts directly to live data sources like Google Sheets so timeline information updates automatically
- Use intelligent formatting to automatically align tasks, adjust spacing, and improve visual hierarchy as you build charts
- Create interactive presentations where you can click through different project phases or zoom into specific timeline sections during meetings
- Track every change made to your charts with version history and revert to previous versions, or see exactly who modified specific project elements and when
Lucidchart limitations
- Its Gantt chart AI features are less specialized than dedicated project management tools
- Lucidchart’s interface can feel overwhelming for users seeking simple project timeline creation
Lucidchart pricing
- Free
- Individual: $9/month per user
- Team: $10/month per user
- Enterprise: Custom pricing
Lucidchart ratings and reviews
- G2: 4.5/5 (6,465+ reviews)
- Capterra: 4.5/5 (2,190+ reviews)
What are real-life users saying about Lucidchart?
One G2 review puts it this way:
6. EdrawMax (Best for template-heavy chart creation)
EdrawMax is a desktop and online diagramming app that supports over 280 diagram types from flowcharts and Gantt charts to electrical schematics and floor plans, via drag‑and‑drop simplicity.
It boasts a massive library with 1,500 built-in Gantt chart project templates and 26,000+ vector symbols, plus a user‑generated community gallery, making it easy to craft visuals quickly and maintain consistency across teams
EdrawMax best features
- Browse through industry-specific symbol libraries containing thousands of icons, shapes, and visual elements
- Automatically change colors based on priority levels, completion status, or assigned team members with conditional formatting
- Design master templates that include your company logo, color schemes, and standard task categories for consistent branding
EdrawMax limitations
- The web version can lag under heavy loads, and the desktop app occasionally freezes or slows after extended usage
- Its licensing system is restrictive, often limited to one machine, and reinstallation or switching devices can require additional licensing steps
EdrawMax pricing
- Individuals:
- Subscription: $79 (semi-annual)
- Perpetual: $245 one-time payment)
- Perpetual bundle plan: $300 (one-time payment)
- Teams and businesses: $119 per user (annual plan)
- Students: $68 (semi-annual)
- Educators: custom pricing
EdrawMax ratings and reviews
- G2: 4.5/5 (135+ reviews)
- Capterra: 4.5/5 (205+ reviews)
What are real-life users saying about EdrawMax?
According to one G2 review:
🧠 Friendly Tip: Try the ‘Timeline Risk Mapping’ method. Gather your team and ask, ‘Where in this Gantt timeline could we fail?’ Mark those tasks with flags or custom tags to monitor closely. Pair this with contingency buffers on high-risk phases
7. Toggl Plan (Best for resource-focused timeline management)
via Toggl Plan
Toggl Plan shifts the focus of the Gantt chart from tasks to people, emphasizing resource allocation and team capacity management. It visualizes what needs to happen, who will do the work, and when they’re available.
Teams can see at a glance which members are overbooked, underutilized, or perfectly balanced across multiple projects. The project management software’s timeline view makes resource conflicts obvious before they become problems, enabling proactive schedule adjustments.
Toggl Plan best features
- Set a workload limit for each team member so you get automatic alerts if anyone gets assigned too much work
- Color-code project categories to instantly see the type of work everyone is focusing on
- Understand how much time each person spends on different types of activities with workload reports
Toggl Plan limitations
- Lack of recurring tasks support forces repetitive manual work
- No version history, making it hard to revert or audit changes
Toggl Plan pricing
- Free for up to 5 users
- Capacity: $6/month per user
- Starter: $9/month per user
- Premium: $15/month per user
Toggl Plan ratings and reviews
- G2: 4.3/5 (40+ reviews)
- Capterra: 4.6/5 (115+ reviews)
What are real-life users saying about Toggl Plan?
Look at what this Capterra review says:
🧠 Friendly Tip: Make your Gantt chart a living artifact, not a one-time setup. Set a recurring 15-minute review to:
- Reassign or unstick blocked tasks
- Add new items that have emerged
- Shift timelines if things slip
8. Gantt Chart AI (Best for automated timeline generation)
via Gantt Chart AI
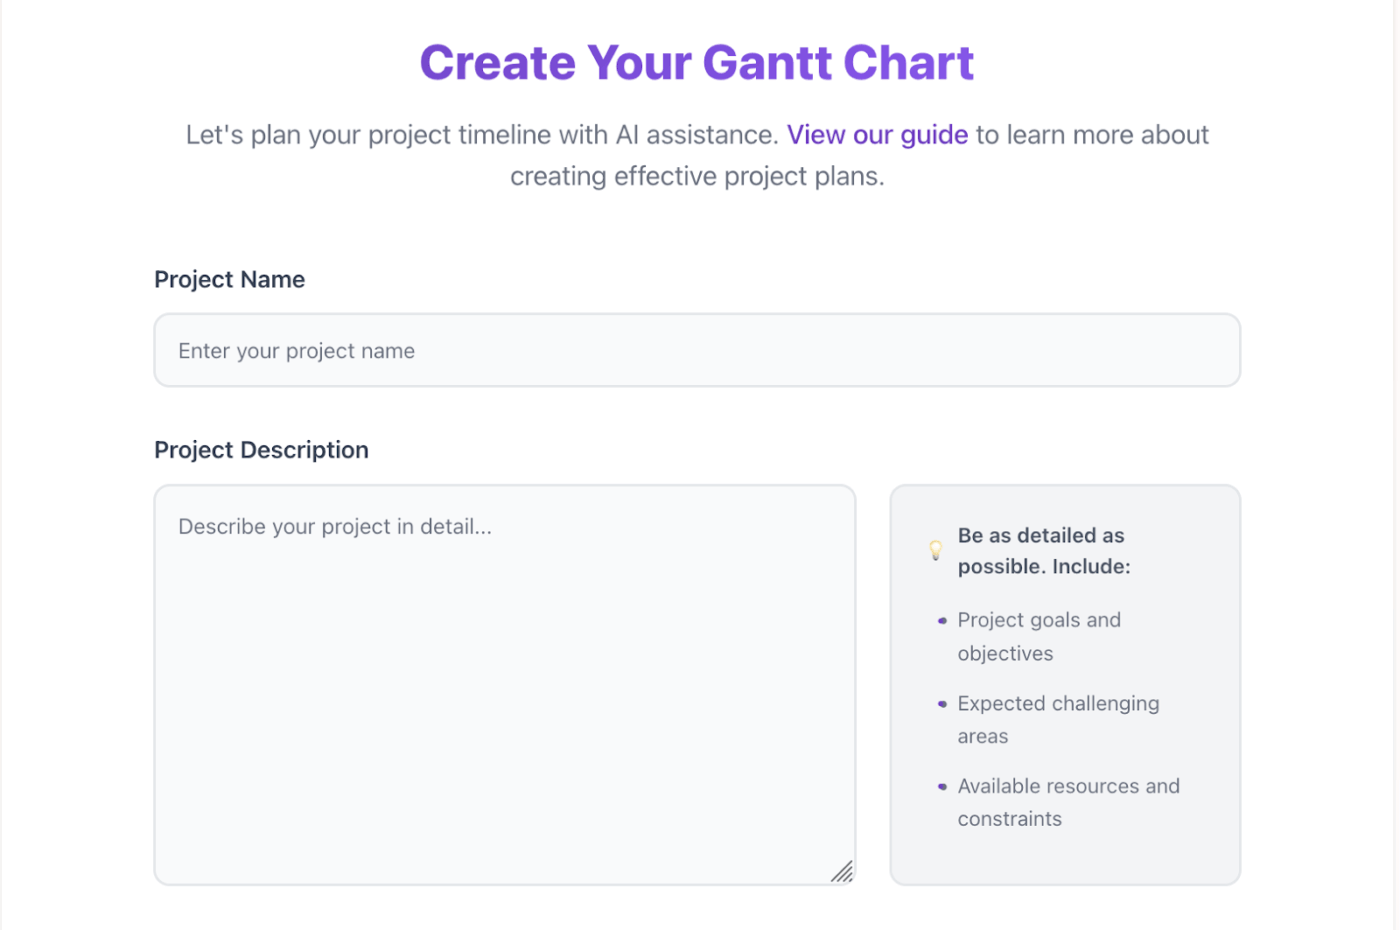
Gantt Chart AI utilizes machine learning to generate comprehensive project timelines with minimal input. Users describe their project goals and key constraints, then watch as AI algorithms create detailed schedules, assign realistic durations, and establish logical task dependencies.
The platform learns from thousands of successful projects to suggest realistic timelines and identify potential risks. This way, you can focus on execution rather than spending weeks perfecting your team’s initial schedule.
Gantt Chart AI best features
- Receive intelligent duration estimates that factor in task complexity, team size, and historical data from similar projects
- Get proactive risk assessments that identify potential scheduling conflicts, resource bottlenecks, or unrealistic deadlines, along with suggested solutions
- Fine-tune AI-generated schedules using conversational natural language commands
Gantt Chart AI limitations
- Limited control over specific algorithm parameters and assumptions
- It’s still developing compared to established tools in the market
Gantt Chart AI pricing
- Free (2 credits)
- 30 credits: $3 (30 credits)
- 100 credits: $6 (100 credits)
Gantt Chart AI ratings and reviews
- G2: Not enough reviews
- Capterra: Not enough reviews
🧠 Fun Fact: The Gantt chart was designed before computers, so every bar and update was drawn by hand. Managers had to literally use rulers and pencils to tweak timelines before every production change. Gantt’s colleagues referred to his creation as ‘Bar Charts,’ and the terminology stuck even as the tool evolved.
Gantt You Believe It? ClickUp Does It Best
Selecting an AI Gantt chart maker requires a system that anticipates change, recalibrates in real time, and converts raw input into structured execution.
ClickUp leads this shift.
Its Gantt chart AI generates structured schedules, aligns dependencies, adjusts timelines based on real workload data, and automates handoffs without manual follow-up.
Every change feeds back into the system, keeping execution aligned with reality.
Sign up for ClickUp today! ✅

Everything you need to stay organized and get work done.
