Gantt Chart vs. Roadmap: Project Managers’ Guide to Similarities and Differences

Sorry, there were no results found for “”
Sorry, there were no results found for “”
Sorry, there were no results found for “”
Efficient project management requires meticulous planning, scheduling, and tracking actual progress, all the while keeping a close eye on outlined goals and committed deadlines. That’s easy when you’re handling a small project. But if you’re running a large-scale initiative—you got yourself a project beast that has to be tamed with the most sophisticated weapons.
That’s what tools like Gantt charts and roadmaps are for! They can give you valuable insights into your project, helping you steer all its moving parts in the right direction and defeat the beast without a scratch. 😏
A common (and, dare we say, totally unfair) misconception is that Gantt charts and roadmaps are the same thing, primarily because they look similar and are used as project planning tools. But the truth is that each tool helps visualize a plan’s strategic elements in unique ways.
In this article, we’ll dig into the Gantt chart vs. roadmap similarities and differences and explain their primary use cases, as well as how they fit into the agile methodology. We’ll also suggest different tools and templates to leverage both visualization techniques.
A Gantt chart is a popular project management chart that visualizes tasks related to a particular project in the form of a handy bar diagram, typically horizontal. It focuses on task sequences and dependencies over a period, representing a linear schedule with precise deadlines and the orderly flow of particular tasks.
You may wonder why you need a Gantt chart when you can keep all the tasks and deadlines in a list or table. While that’s doable, the true purpose of a Gantt chart is to serve as a strategic thinking and planning tool in professional project management.
Having the project work laid out in a bar chart makes you visually receptive. As a result, you can fine-tune your strategic plan more efficiently, identify priorities, risks, and roadblocks, and stay on the right course toward objectives.
Here are other valuable benefits you’ll enjoy with Gantt charts:
Traditional Gantt charts revolve around fixed schedules and don’t allow much room for changes. This typically works for waterfall methodologies where you have a plan detailing everything from the project’s start to end, set to be completed linearly. These charts adhere to rigid timelines and aren’t exactly known for their flexibility. Additionally, they often fail to meet stakeholder expectations in terms of tracking realistic progress.
However, as more teams adopt the agile framework for their projects, it’s only natural for Gantt charts to adapt. Gantt charts for agile teams combine the best of both worlds, typically presenting sprint-specific tasks and dependencies. That way, teams get enough wiggle room to switch courses after each sprint.
Most modern Gantt chart tools display information related to projects linearly—it’s up to you to customize it for traditional or agile organizations.
Gantt charts aren’t quite the same as timelines or Kanban boards, although all these tools share the purpose of visualizing project tasks.
Project timelines give you quick overviews of all the tasks in chronological order—they focus more on the chronology and ignore dependencies and task durations (that Gantt charts present).
Kanban boards, on the other hand, classify your tasks according to their status, like Doing or Waiting. Here’s what a typical Kanban board looks like:

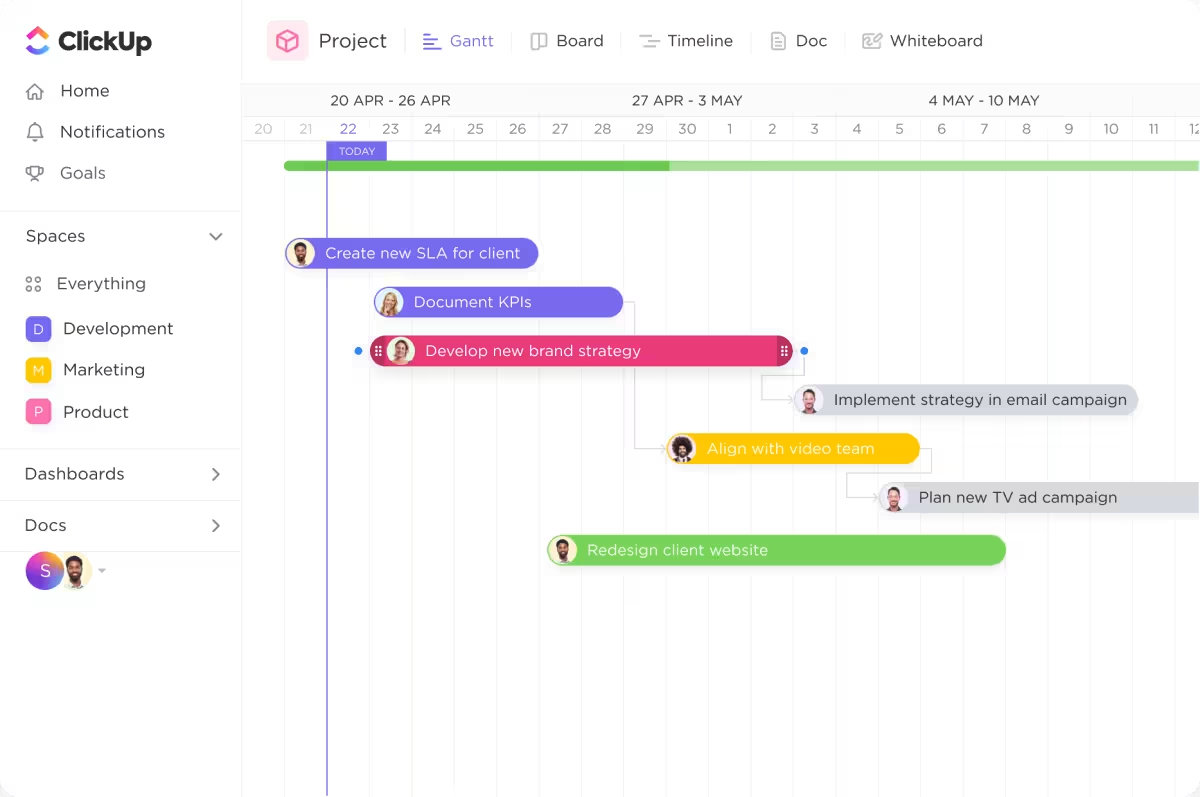
The best way to understand what Gantt charts are about is to observe examples. We’ll use samples from ClickUp, a popular Gantt chart software solution, to demonstrate how Gantt charts can serve different use cases.
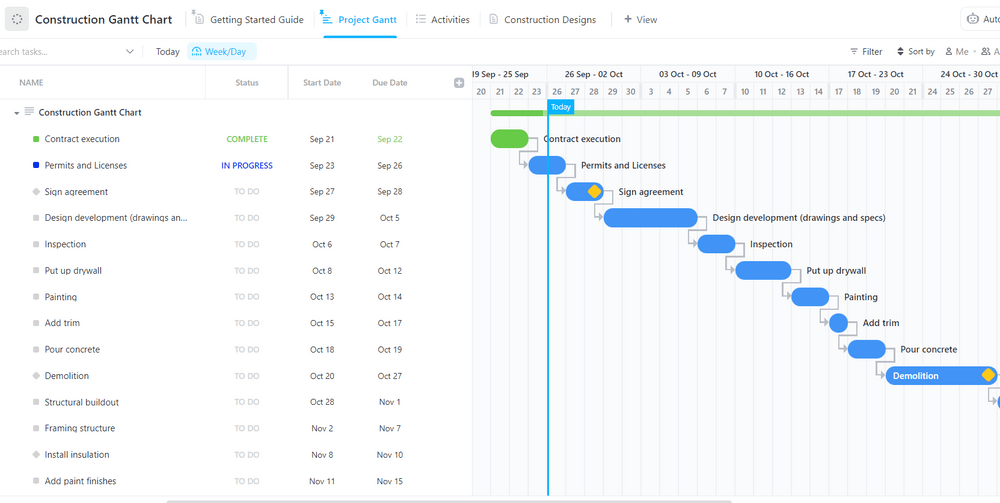
This Gantt chart focuses on a construction project. All project-related tasks and their statuses are listed on the left side of the graph.
In this example, the tasks are presented chronologically and are organized to have no overlaps. Tasks marked with a yellow diamond are project milestones—they represent important progress points in the project schedule. This Gantt chart has two milestones—Sign agreement and Demolition, denoting key events.
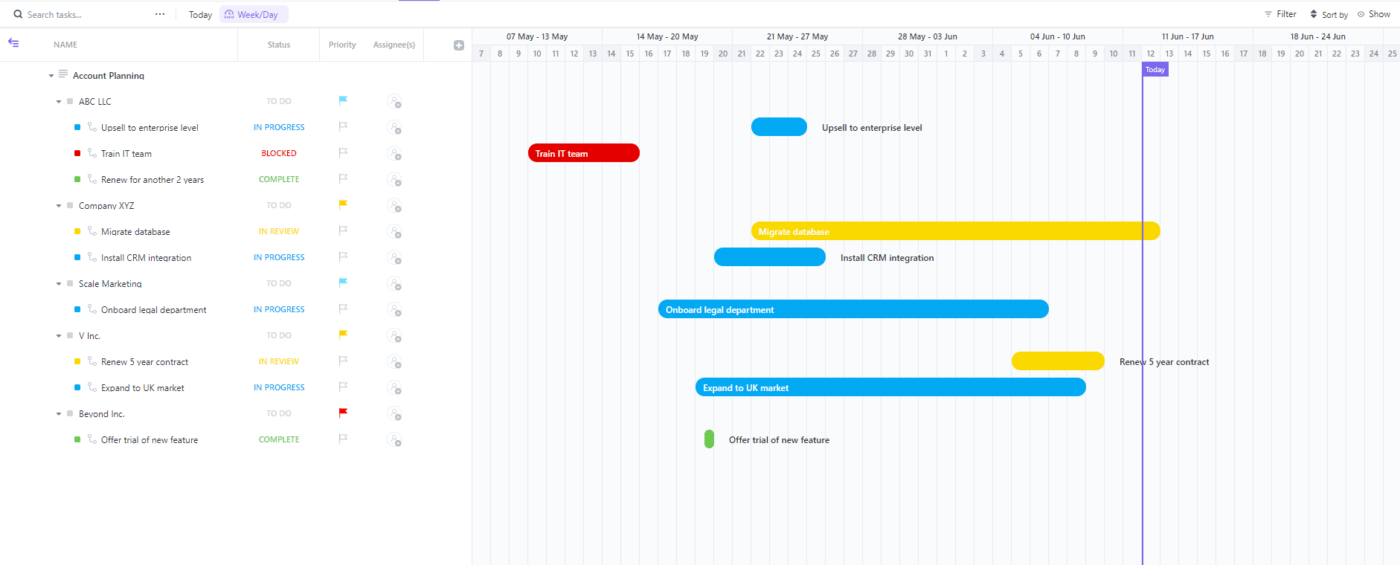
This Gantt chart focuses on managing accounts with multiple clients. Under each client listed on the left side of the image, you’ll see tasks related to them. These tasks are visualized in the bar diagram, where you can easily access their duration, mark milestones, and spot overlaps.
This particular example depicts tasks in an agile environment, so they aren’t organized chronologically. This allows you to set up more flexible schedules and reassign account managers to accommodate any last-minute updates.
A roadmap is a project management tool that helps you create a strategic project plan and establish major goals. It doesn’t care about micro-details like granular schedules and dependencies—roadmaps capture the big-picture strategic thinking and objectives that ultimately guide detailed project planning and execution.
The visual appearance of roadmaps depends on your preference—you can represent them on whiteboards as flowcharts or in spreadsheets.
Besides providing a high-level project overview, roadmaps can serve as broad-scope communication tools. A well-developed roadmap represents your project’s trajectory, so you can use it to keep your stakeholders in the loop about the defining elements of your path forward, especially for complex projects.
You could say that roadmaps focus on the why (what’s the point of the project?), while Gantt charts focus on the what (what is the day-to-day work timeline to complete the project?).
The many advantages of roadmaps include:
📌Also Read: How to Create a Project Roadmap in Excel
Let’s look at two examples of roadmaps in ClickUp to better understand them from a practical viewpoint.
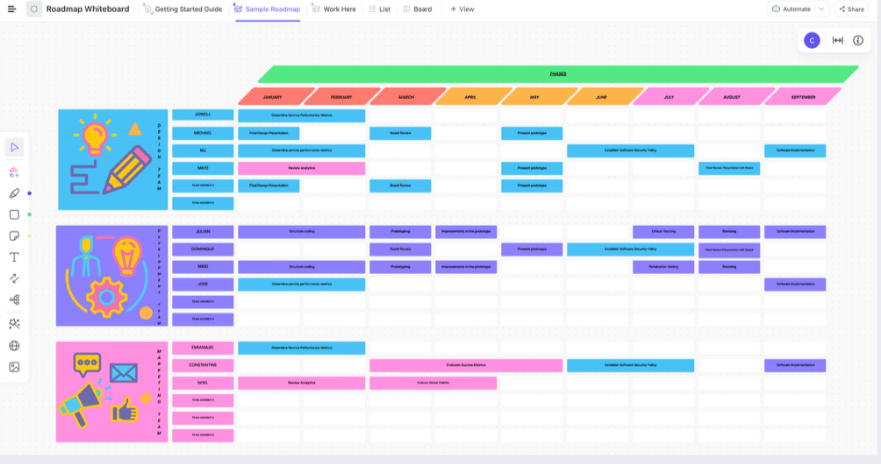
This well-developed roadmap reflects the release timeline of a new product. It divides the project into teams—design, development, and marketing—to track progress easily.
Every activity on the roadmap is color-coded depending on which team is in charge. The activities are also sorted according to the month they’re due—notice how the roadmap doesn’t focus on daily or weekly activities as a Gantt chart does.

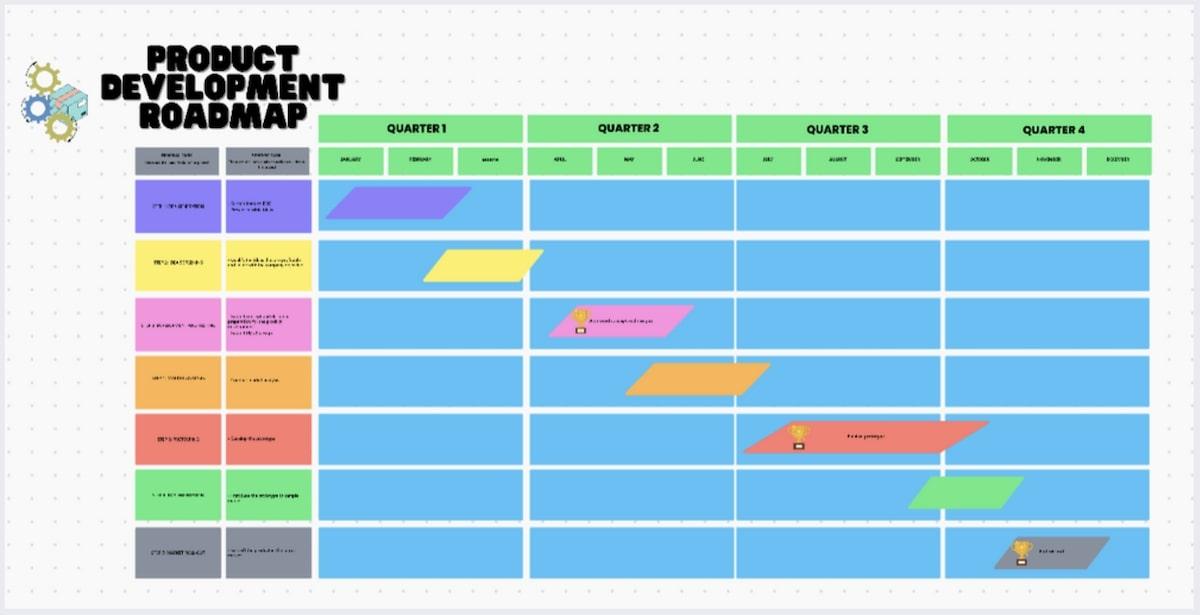
Here’s another example of how you can use ClickUp as your online roadmap tool for visualizing product development. In this case, the project is divided into three broad phases with no time constraints, namely:
The example is the perfect testament to how roadmaps are all about a particular project’s big picture. They don’t zoom in on the exact duration of each task or the assignee—just allow for developing a more intricate product strategy.
By now, you must have gathered the basic idea of Gantt charts and roadmaps. But, to the untrained eye, they may look the same. 👀
So, let’s revisit both concepts from three different perspectives.
As discussed in their individual sections above, Gantt charts and roadmaps differ in their primary function. You use the former to create a detailed game plan for completing a project and outline every relevant task, dependency, and activity across a predetermined timeline alongside deadlines.
Roadmaps, on the other hand, represent the general project goals and range of work on a macro level. For example, a roadmap could be a simple visualization of all the phases of a project, like:
That’s a rough trajectory of your future project plan. Now, when you break down every phase into a detailed schedule to emphasize linear work—you’re making a Gantt chart.
This level of detail leads us to another important difference—the audience. The target group for your Gantt charts is your team—they use it as a compass that guides them in the right direction in terms of what needs to be done and in what order. Your roadmaps’ biggest users include higher-level stakeholders, like senior managers, investors, partners, and executives, who are invested in project profitability.
Another difference between the two project management tools is the time frame. As Gantt charts are more detailed, they typically focus on shorter periods with specific dates. On the other hand, roadmaps have a more relaxed timeline, include no committed dates, and can spread across years.
Roadmaps aren’t concerned with details, so they should be your pick when you want to:
On the other hand, a Gantt chart tool is more suitable when you need to:
Remember that both tools are not mutually exclusive. Quite the opposite—using both leads to well-rounded project management. Your starting point is creating a roadmap in which you’ll define goals and strategies. Then, you’ll get it approved by stakeholders and share it with task managers, who’ll ultimately rely on its info for preparing Gantt charts.
Agile workflows are all about flexibility, adaptability, and collaboration. They accommodate frequent changes on the fly without causing your project to crumble like a house of cards.
We have established that traditional Gantt charts are not agile-friendly as they’re fixated on schedules and nitty-gritty details. They’re not designed to support frequent changes, which goes against the very foundation of an agile framework. However, agile project managers still love the pro-tracking benefits of these visual charts. That’s why modern Gantt charts are typically modified to represent sprint tasks—instead of entire project workflows.
Roadmaps are more agile-friendly because they aren’t as detailed. They focus on the desired outcomes instead of output, giving your team more leeway in adjusting schedules. However, roadmaps aren’t always ideal because they still limit your work. They’re all about long-term planning and may need to be changed frequently to support iterative software development, which is unproductive.
That said, both Gantt charts and roadmaps can be a valuable part of your agile workflows if you’re using the right project management platform—like ClickUp. It doubles as a roadmap and Gantt diagram software, helping agile teams stay on top of long-term strategies as well as daily workflows.
There’s no competition between Gantt charts and roadmaps—both can support and streamline your project management processes. But, you can maximize their benefits only if you use a first-class task and project management tool.
ClickUp rises to the occasion and lets you combine the power of Gantt charts and roadmaps to have complete control over your work. 🤓
Let’s see how ClickUp helps you create and manage Gantt charts and roadmaps.

One of ClickUp’s main appeals is its ability to show your projects from various perspectives, all possible thanks to ClickUp views. You have the classics like the Kanban Board and List view, which helps you organize and categorize tasks, as well as advanced views to zoom in on the specifics.
One of the advanced options is the Gantt chart view. With it, you can visualize and manage all project-related tasks and dependencies, set priorities, and collaborate with your team.
ClickUp’s Gantt charts are dynamic and filtering-friendly—once you create tasks and project milestones with accompanying details, you can customize what you see on the chart. For example, you may want to see what a specific team member is in charge of, so you’ll press the Sort by button at the top of the chart and choose Name. You have other sorting criteria, such as due date, priority, or status.
Checking the progress of a specific task is as easy as hovering your mouse over it—ClickUp will display the exact percentage.
The drag-and-drop design is another perk of ClickUp Gantt charts. Thanks to it, you can quickly adjust your tasks, and you know what that means—the charts can fit into your agile workflows like a glove! 🧤
Besides letting you make quick changes, the drag-and-drop interface is ideal for creating task dependencies. All you need to do is connect tasks, and ClickUp will automatically set blocking or waiting on dependencies. If you enable the critical path option (by selecting Customize and then Critical Path at the chart’s top-right corner), you’ll allow ClickUp to track potential bottlenecks and other potential delivery timelines.
ClickUp has an awesome feature for real-time collaboration and roadmapping called ClickUp Whiteboards. These digital canvases let you and your team brainstorm, strategize, and turn your ideas into concepts in a few clicks.
Once you launch Whiteboards, the small toolbar on the left is everything you need to unleash your creativity—draw and connect, write text, create shapes, attach links and media files, or create notes.
With ClickUp Whiteboards, you can tailor roadmaps for any project you’re in charge of, whether construction or software development. Use the drag-and-drop interface to add shapes and create connections to represent your project’s trajectory via flowcharts, phase-wise maps, or any other format you prefer.
Since ClickUp Whiteboards display every change in real time, you can invite your team members to participate in building the perfect project roadmap together. Likewise, you can share it with relevant stakeholders to showcase your progress, request feedback, and adjust accordingly.
If creating a roadmap from scratch sounds time-consuming, ClickUp has a solution—templates! They have premade infrastructure to set up both roadmaps and Gantt charts.
Our recommendation is the ClickUp Product Roadmap Template. It’s ideal for visualizing the entire development lifecycle, prioritizing, and tracking progress. Besides the Whiteboard view for your roadmap, you also get a Gantt chart view, making the template perfect for those who want to use both tools to navigate processes. 🔥
With a template library of 1,000+ options, ClickUp has your back if you want a shortcut to building your Gantt charts or roadmaps.
The two Gantt chart templates we’d like to recommend are:

If you want to create roadmaps, we recommend these:
Gantt charts focus on details and roadmaps on the big picture—all in all, the choice depends on what you want to observe.
With ClickUp, you can create, organize, and manage both without breaking a sweat. The platform’s easy-to-use features help you create dynamic project visualizations and have complete control over workflows.
Sign up for free today and explore other handy features that streamline project management! 🥰

Manasi Nair
Max 20min read

Praburam Srinivasan
Max 26min read
Praburam Srinivasan
Max 9min read

© 2026 ClickUp


