


Still downloading templates?
There’s an easier way. Try a free AI Agent in ClickUp that actually does the work for you—set up in minutes, save hours every week.
Sorry, there were no results found for “”
Sorry, there were no results found for “”
Sorry, there were no results found for “”

This one Reddit post sums up a pattern almost every project manager has seen: the drop-off between how carefully we plan and how casually we measure what actually happens.
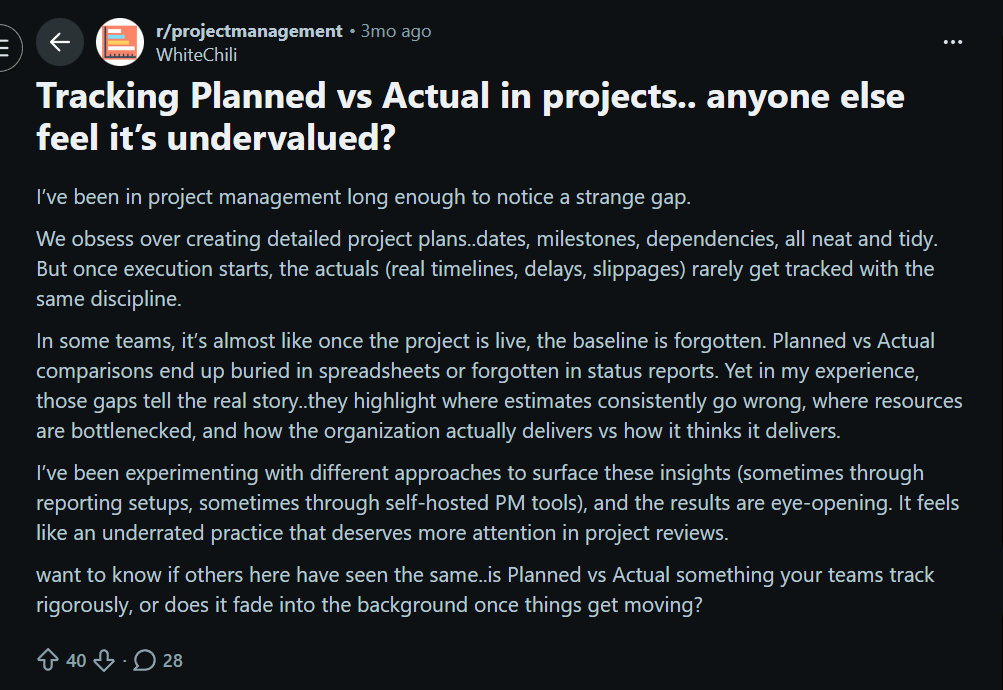
We build airtight plans, forecast every milestone, and call the kickoff a success. Then execution begins, and tracking slips into the background, buried in spreadsheets or forgotten in updates. But those gaps between expectation and reality are where the most useful insights live.
In this blog post, we’ll show you exactly how to track planned vs actual effort and spot where estimates go off. You’ll also see how ClickUp helps you capture real effort and turn insights into smarter planning.
Let’s get started! 💪
Planned vs. actual effort (also known as variance analysis) is a performance indicator that measures the alignment between what was expected to be done and what happened during execution.
It looks at two key components:
Also known as ‘baseline schedule,’ planned effort represents the estimated amount of time and resources a task, sprint, or project is expected to take.
It’s established during the planning phase based on factors like complexity, scope, past project data, and resource availability. This planned value acts as the reference point for evaluating performance and predicting workloads.
Actual effort reflects the true amount of time and effort spent completing a task or project. It captures everything from start to finish, including unplanned or additional work that emerged along the way.
This reflects how the work played out in practice, beyond the assumptions made during planning.
The difference between planned and actual effort is known as effort variance. You calculate it as a percentage or absolute difference to see how far off your estimates were.
A small variance indicates accurate estimation and stable processes, while a large one may point to underestimation, scope creep, or inefficiencies.
Effort variance directly shapes:
🧠 Fun Fact: Archaeologists found thousands of ostraca (pottery shards used like sticky notes) in the village of Deir el-Medina that recorded everything from daily attendance and sick leaves to material quotas and task assignments. Workers were organized into structured teams called gangs and phyles, each with its own leadership hierarchy.
Here’s a direct comparison to make this crystal clear:
| Aspect | Planned effort | Actual effort |
| Purpose | Guiding decisions, allocating capacity, forecasting delivery | Measuring what really happened |
| Source of truth | Project plans, estimation tools, and sprint planning sessions | Timesheets, task updates, and software tracking systems |
| Level of certainty | Predictive and subject to uncertainty | Definitive and evidence-based |
| Adjustability | Can be revised during planning or at key checkpoints | Fixed once the work is done (historical record) |
| Role in performance analysis | Serves as the benchmark for evaluating variance | Serves as the comparison point for validating estimates |
🔍 Did You Know? The human brain uses ‘optimism bias,’ which makes us believe we’re faster, smarter, or more efficient than we are.
Here’s how effort tracking elevates delivery performance:
🔍 Did You Know? Before mechanical clocks existed, medieval monks used candle clocks: candles with marks to estimate work durations.
Understanding why planned effort and actual effort diverge is crucial because, unless you diagnose the root causes, you’ll keep repeating the same estimation errors. ➿
Teams often underestimate complexity or risk because they plan from a best-case mindset rather than reality. Psychology research calls this the planning fallacy, which is a common cognitive bias where planners underweight past delays.
Even small tweaks to requirements during a phase silently add work, stretching effort beyond initial estimates. Scope creep includes all the additional coordination, rework, and testing that come with changes.
Team members get pulled into unplanned tasks, meetings, support, or emergencies. And every disruption adds unplanned hours.
📖 Also Read: Time Tracking Projects With Time Doctor
Unknowns (integration issues, environment setup, dependency delays) often surface only once work begins, increasing actual effort. Plus, ambiguous, incomplete, or frequently changing requirements make it difficult to reliably forecast effort.
Effort is often estimated using rough guesses, incomplete analogies, or inconsistent methods, which introduces systematic error before work even starts.
Teams with poor project time management and standardized estimation processes tend to consistently under or overestimate.
There’s a clear gap if your estimates come from people with limited domain, technical, or project experience. Lack of familiarity with the team’s actual throughput, tooling, or dependencies also skews estimates away from reality.
🧠 Fun Fact: Research shows that teams improve estimation accuracy when more people are involved, but accuracy drops again if too many people participate. That was the basis for Planning Poker in Agile.
The real value comes from tracking metrics that explain why effort drifted, how it affected delivery, and what it changed downstream, across schedules, costs, resources, and business outcomes.
Let’s break down the key metrics to track. ⚒️
These performance metrics compare what you planned to spend in effort vs. what you did. They form the baseline for all variance analysis.
Effort variance is the percentage difference between actual effort and the original estimate. This makes it easy to compare accuracy across tasks, teams, or projects of different sizes.
🧮 Formula: Effort variance (%) = (Actual effort − Planned effort) ÷ Planned effort × 100
👀 How to interpret:
📮 ClickUp Insight: While 40% of employees spend less than an hour weekly on invisible tasks at work, a shocking 15% are losing 5+ hours a week, equivalent to 2.5 days a month!
This seemingly insignificant but invisible time sink could be slowly eating away at your productivity. ⏱️
Put ClickUp’s Time Tracking and AI assistant to work and find out precisely where those unseen hours are disappearing. Pinpoint inefficiencies, let AI automate repetitive tasks, and win back critical time!
This metric compares estimated hours with logged time for tasks, sprints, or projects. It quickly exposes gaps caused by interruptions, rework, meetings, or unclear scope.
Here’s how to calculate it:
Then, compare the two over time or per work type.
💡 Pro Tip: Use ClickUp Timesheets to review planned hours vs. actual time after hours are submitted and locked. When team members submit their timesheets, it seals those entries and routes them for approval, so your comparisons are based on finalized, reviewable data.
These metrics help you connect effort differences to project timeline performance, so you can see how much work was done and how it impacted scheduling and delivery.
Schedule Variance tells you whether the work you’ve completed so far is ahead of or behind where you planned to be at a specific point in time. It’s part of Earned Value Management (EVM), a way to quantify progress against a baseline.
🧮 Formula: SV = Earned Value (EV) − Planned Value (PV)
👀 How to interpret:
SPI takes the idea of SV and turns it into a ratio. Instead of comparing planned and actual progress, it shows how efficiently you’re progressing relative to the plan.
🧮 Formula: SPI = Earned Value (EV) ÷ Planned Value (PV)
👀 How to interpret:
Cycle time measures the actual elapsed time it takes for a work item to go from start to finish once work begins. It shows how fast work moves through your workflow. Shorter cycle times usually mean fewer bottlenecks and more predictable delivery.
Here’s how it works:
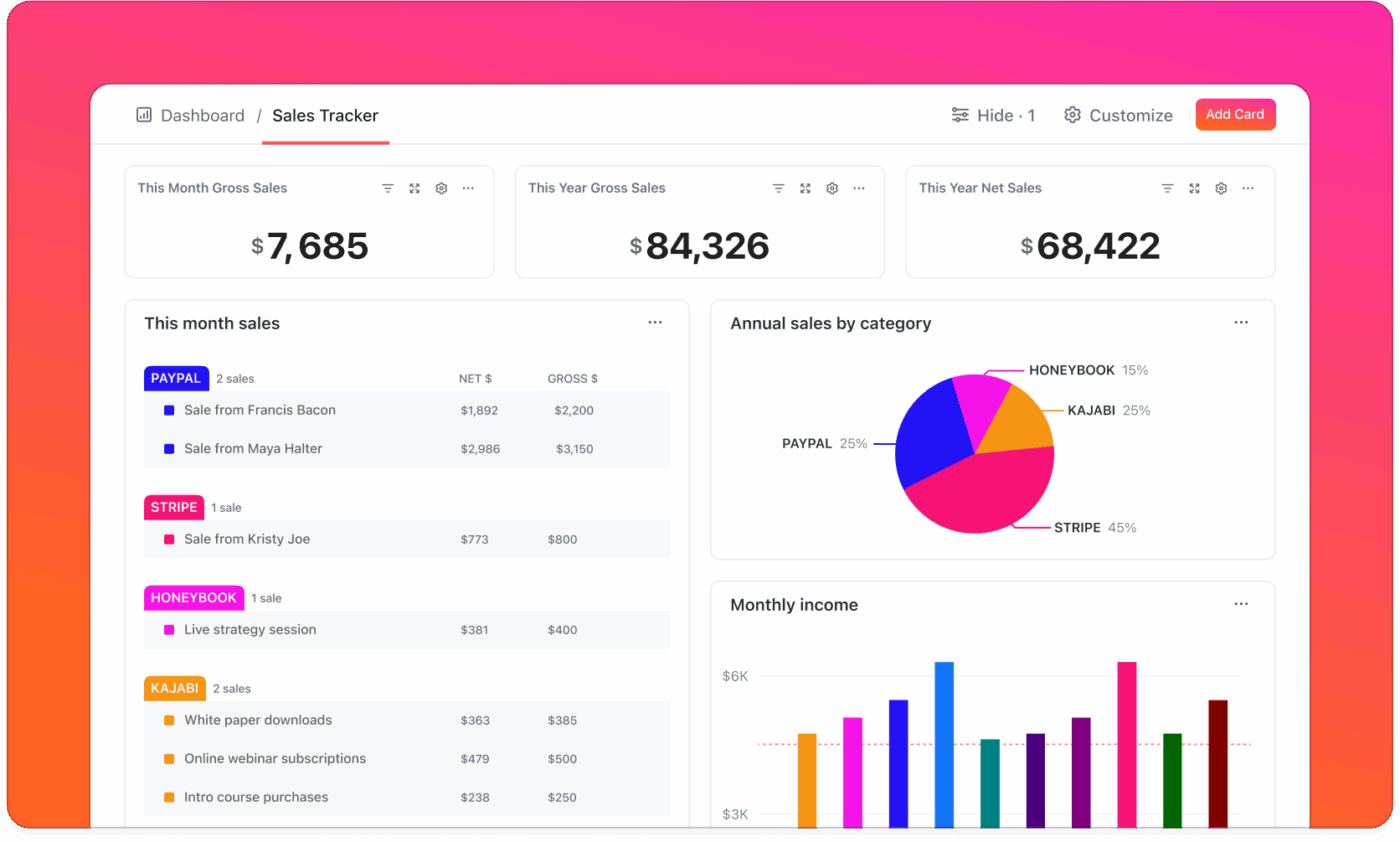
🚀 ClickUp Advantage: Track cycle time alongside effort, progress, and delivery metrics with ClickUp Dashboards.
You can combine multiple views into a single dashboard and see how effort variance impacts flow in real time. This helps leaders spot stalled work, emerging bottlenecks, or slowdowns before they turn into missed commitments.
Throughput and velocity both measure output, but they come from slightly different perspectives:
Feeling overwhelmed by tasks? Learn a simple, seven-step way to stay on top of your work with ClickUp. 👇🏼
When effort exceeds expectations, costs usually follow. These metrics tie effort variance to financial impact.
Cost Variance measures whether the value of completed work justifies the money spent on it.
🧮 Formula: CV = Earned Value (EV) – Actual Cost (AC)
👀 How to interpret:
This index measures how efficiently money is being spent relative to the value delivered. CPI is useful for forecasting the final project cost if current trends continue.
🧮 Formula: CPI = EV/AC
👀 How to interpret:
🧠 Fun Fact: The structured, repeatable process of conducting a ‘lessons learned’ session took shape in the 1980s, inspired heavily by the U.S. Army’s formal After Action Review (AAR) model.
These metrics explain whether effort variance stems from workload imbalance or capacity issues.
How much of the available capacity is actually being used.
🧮 Formula: Utilization = Actual hours worked/Available capacity x 100
👀 How to interpret:
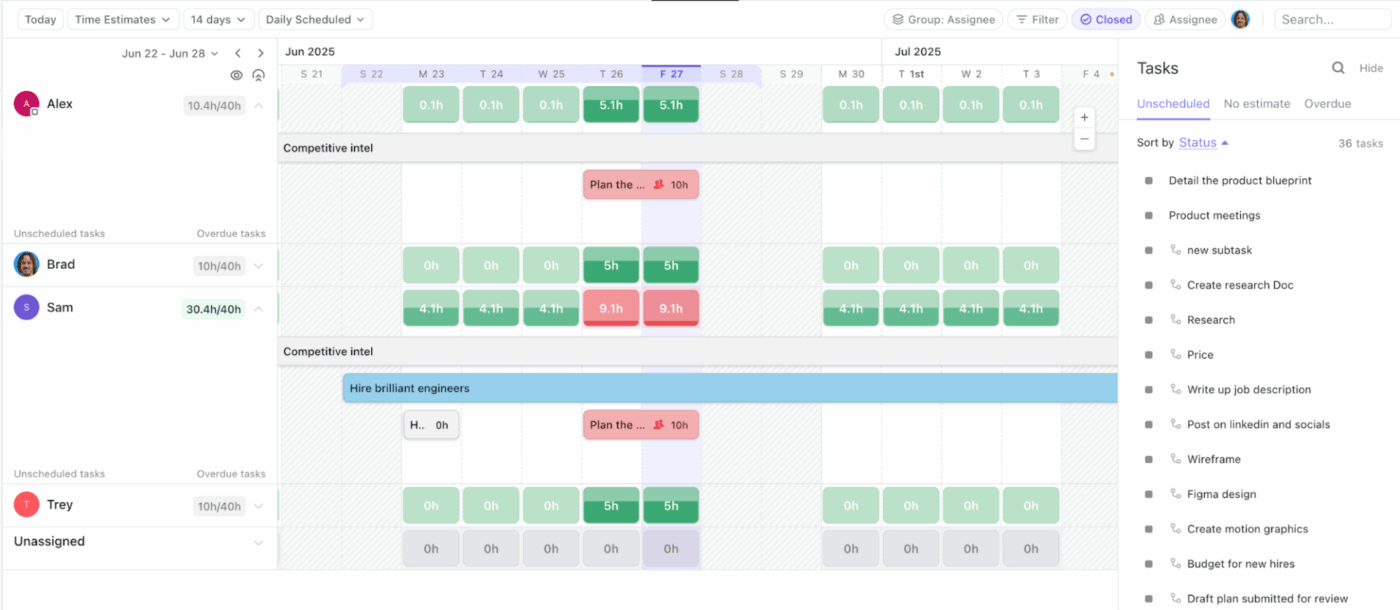
💡 Pro Tip: Add ClickUp Workload View to your workspace and visualize assigned effort against available capacity for individuals or teams. Instead of relying on utilization percentages alone, managers can visually see when people are overcommitted or unevenly loaded.
Now that you understand why effort tracking matters, what causes gaps, and which metrics to monitor, it’s time to put it into action.
This section breaks down a practical, step-by-step approach to tracking planned versus actual effort in real workflows.
Along the way, you’ll also see how ClickUp supports you as the world’s first Converged AI Workspace. Its AI capabilities are built directly into your work so your tasks, documents, chats, and workflows stay connected, helping you avoid context switching. 🤩
Before execution starts, you need an explicit answer to one question: How much effort do we believe this work will take?
Planned effort is a documented commitment, expressed in time, capacity, or relative effort, that can later be compared to reality. So without a defined estimate, overruns look like surprises instead of signals.
Planned effort should be:
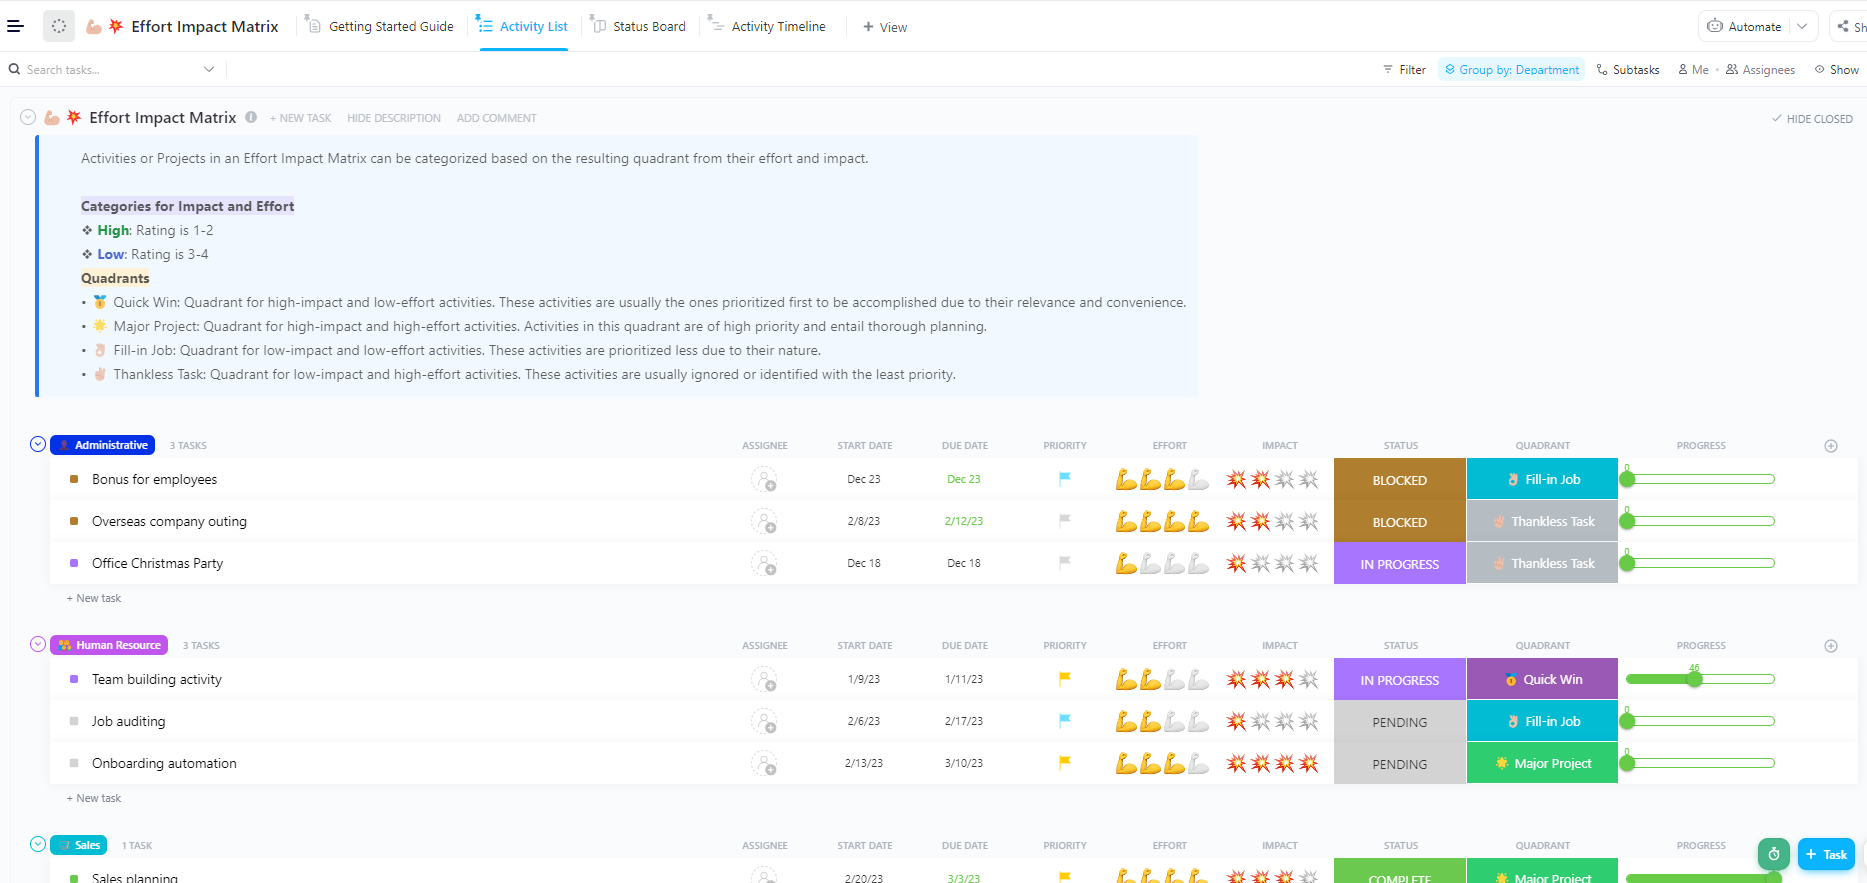
Before assigning time or points, teams often need clarity on which work deserves tighter estimation. The ClickUp Effort Impact Matrix Template helps you visually map upcoming ClickUp Tasks by expected effort and delivery impact.
Use it to identify high-impact, high-effort work that needs a deeper breakdown and tighter estimates. It also helps you avoid over-investing estimation time on low-impact or exploratory tasks
Use it to:
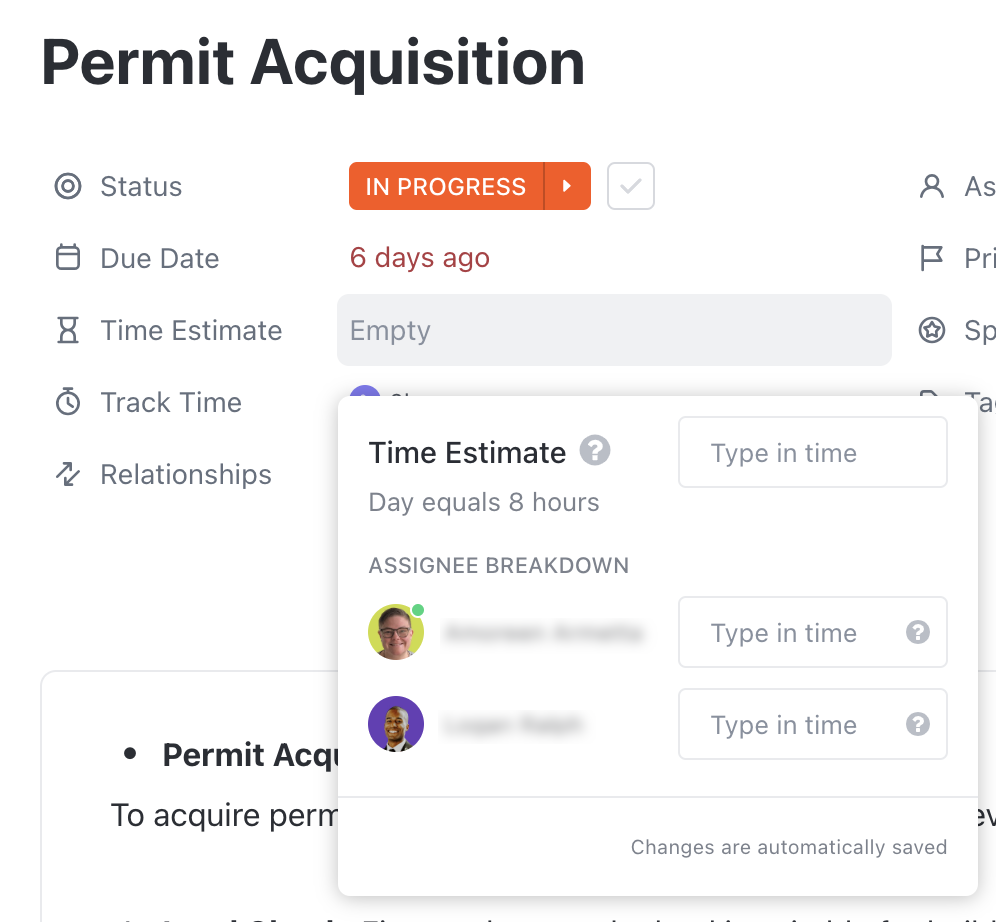
🚀 ClickUp Advantage: Document how long a task is expected to take before work begins with ClickUp Time Estimates. You can add a time estimate directly on each ClickUp Task, define how many working hours make up a day, and choose how estimates are displayed.
Once work begins, the planned effort must remain intact. Changing estimates mid-execution hides variance and removes accountability from the planning process.
Of course, plans can change, but changes should be tracked separately, not overwritten.
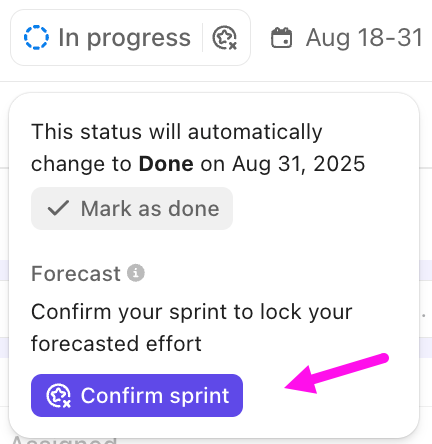
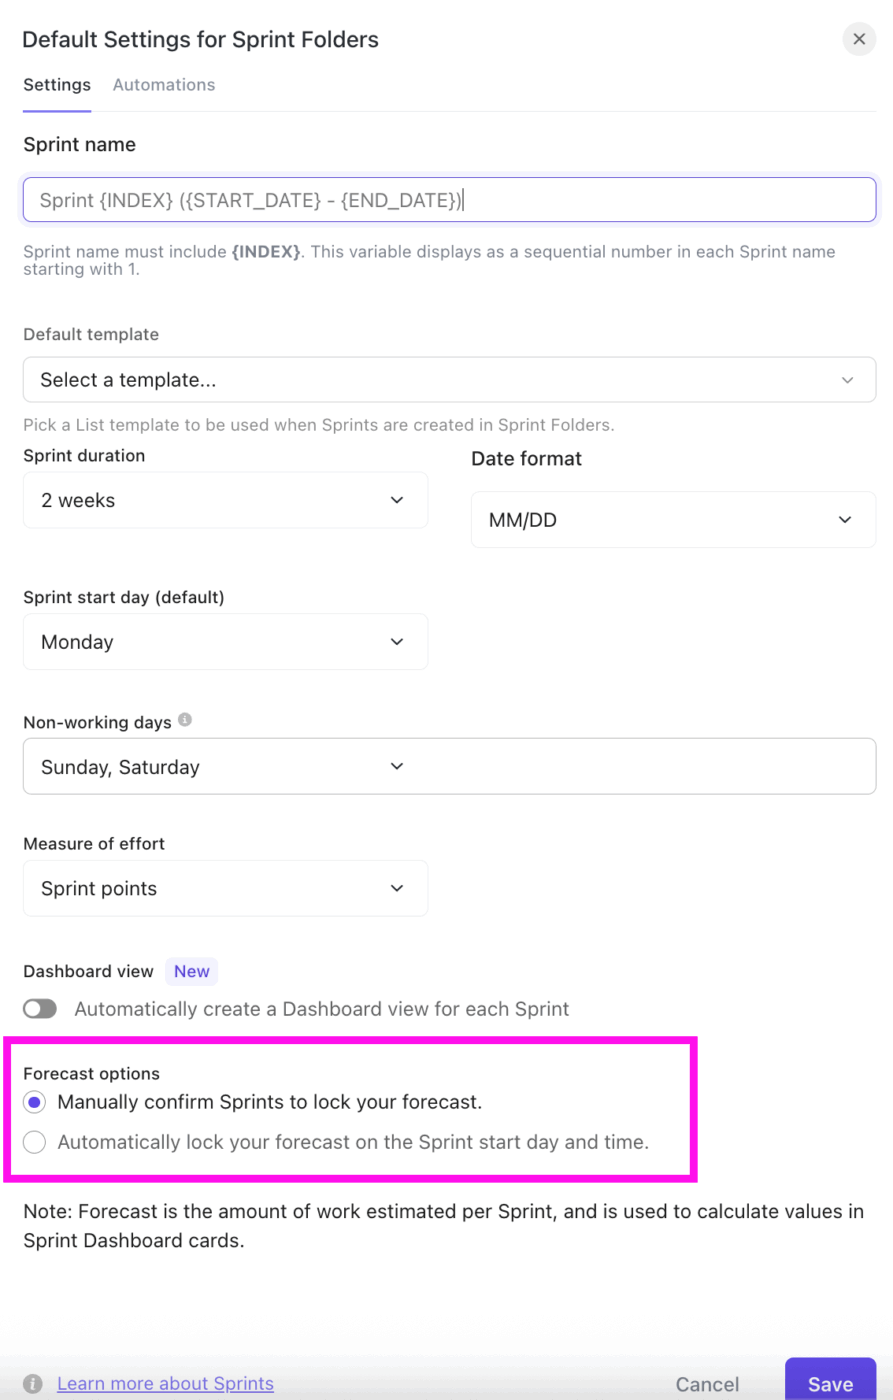
For teams running Agile or even semi-structured delivery cycles, ClickUp Sprints are designed to lock planned effort at the right moment. At the start of a sprint, effort is defined using Sprint Points or Time Estimates.
ClickUp then lets you lock this forecast, using either of these two ways:
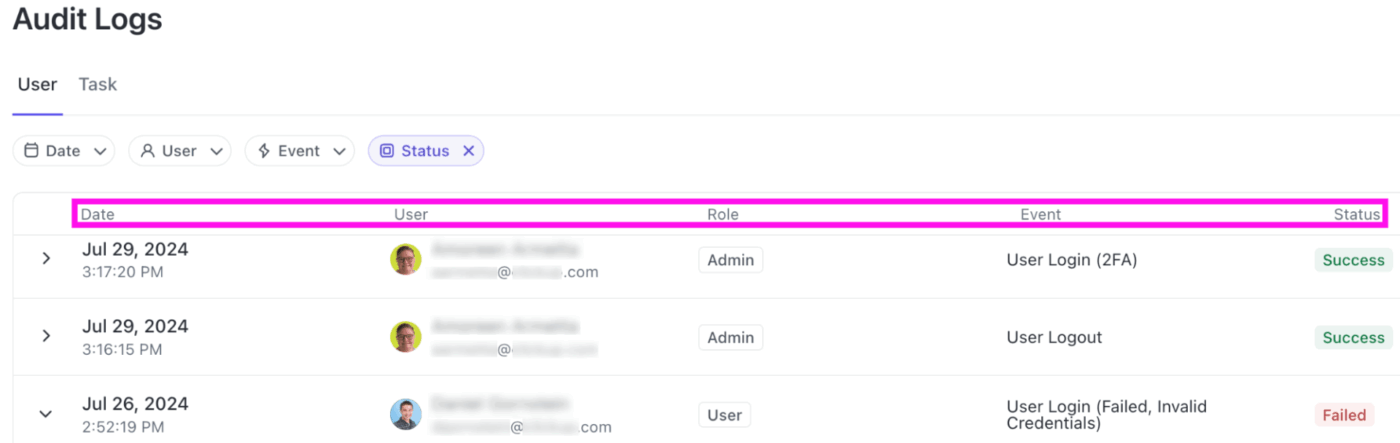
For non-agile teams, ClickUp Audit Logs provide a clear history of what changes and when. It records key changes, including:
One of the fastest ways actual effort gets distorted is when teams rely on end-of-sprint memory instead of live data. Therefore, it’s important that you capture effort as close to real time and low-friction as possible.
Here’s how:
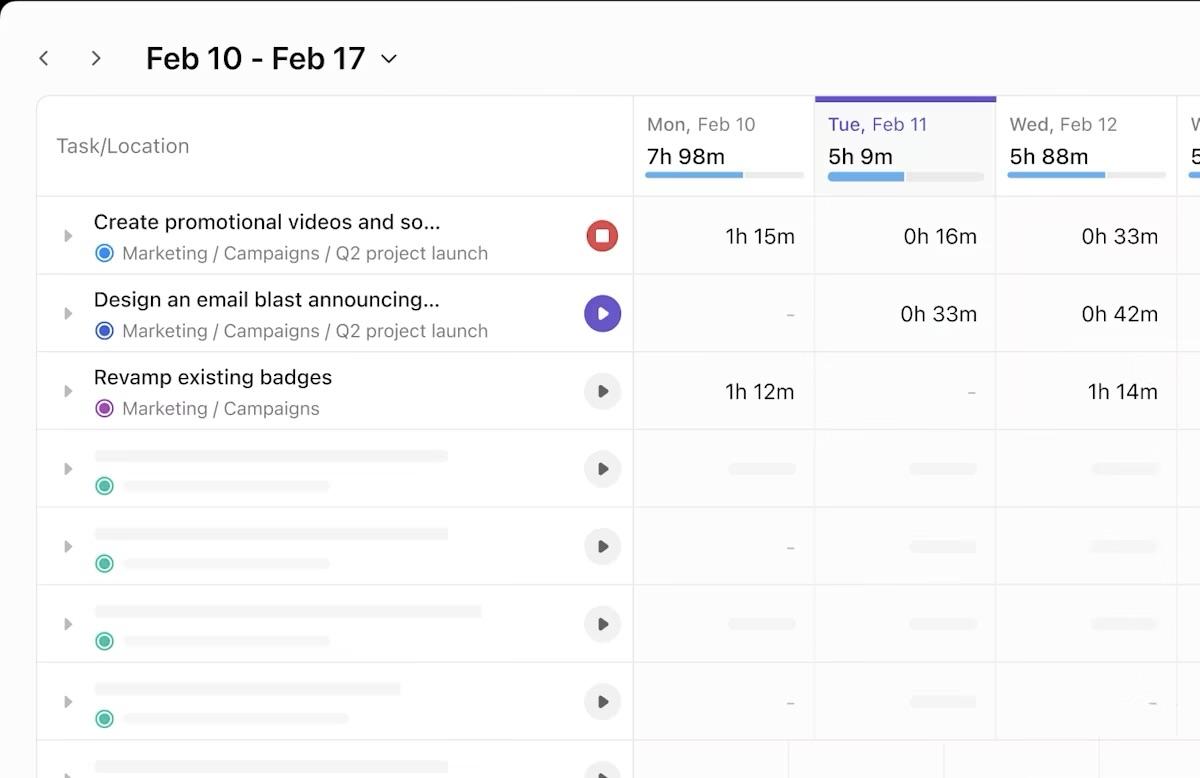
ClickUp Time Tracking is designed specifically for this kind of real-time capture. Team members can start and stop timers from the ClickUp Task itself, use a global timer, or add time retroactively when needed.
Time can be tracked from desktop, mobile, web, or the Chrome extension, so you can calculate hours worked regardless of where you work.
Hear from Alistair Wilson, Digital Transformation Consultant, Compound, on how ClickUp helped them:
We vetted multiple options and felt that overall, ClickUp gave us the right combination of power and flexibility. We also needed to solve the time tracking issue to measure track and measure external contractors’ time logs without needing additional external apps and services. ClickUp’s native time tracking works seamlessly between mobile, tablet, and desktop.
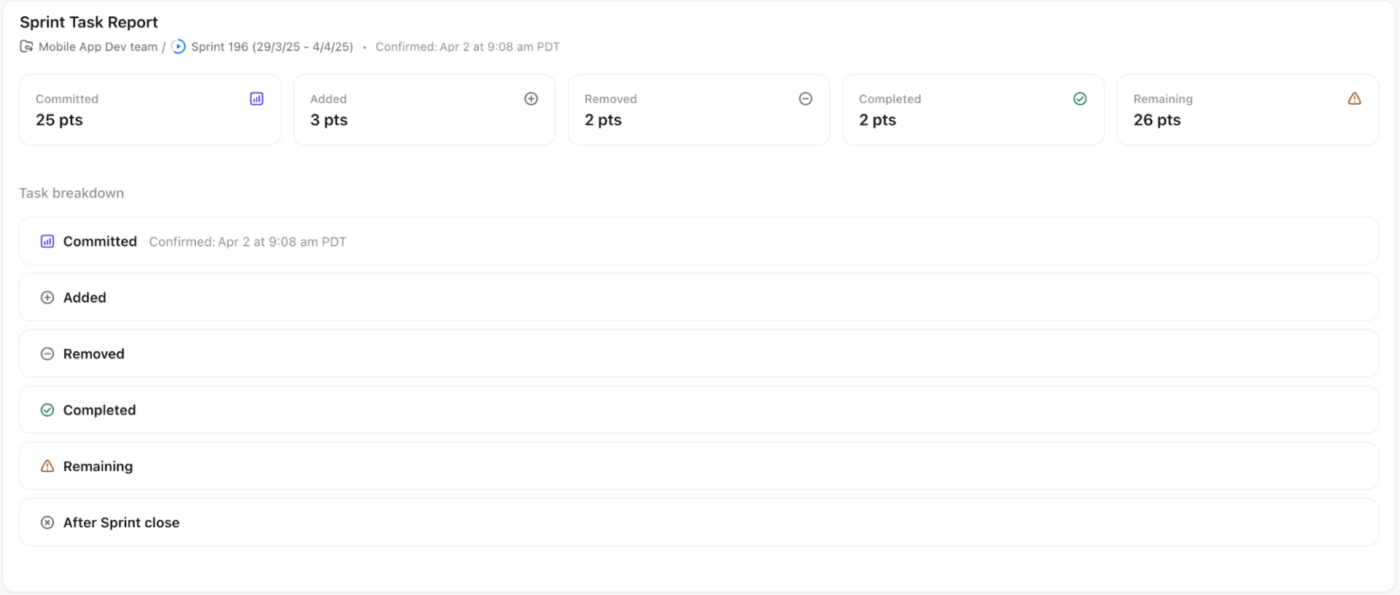
💡 Pro Tip: Capture effort changes as they happen throughout the sprint using the ClickUp Sprint Task Report Card. Sometimes called a say-do report, it shows exactly how your original commitment changed during execution.
Planned vs. actual comparisons only become useful when you analyze them at the right level of effort. Looking at a single project’s total usually hides the real story. Instead, break the effort down so you can identify where the estimates slipped, why, and what to change next time.
Start at the task level, and look for these patterns:
Next, roll task data up to the phase or project level, for example, discovery, design, build, testing, and deployment.
Here, the goal is to uncover structural delivery issues:
When a phase consistently overruns, you can respond with targeted fixes, such as tighter scope, clearer exit criteria, and time-boxed phases, rather than open-ended work.
Finally, compare effort at the team or role level. Aggregate planned vs. actual effort by:
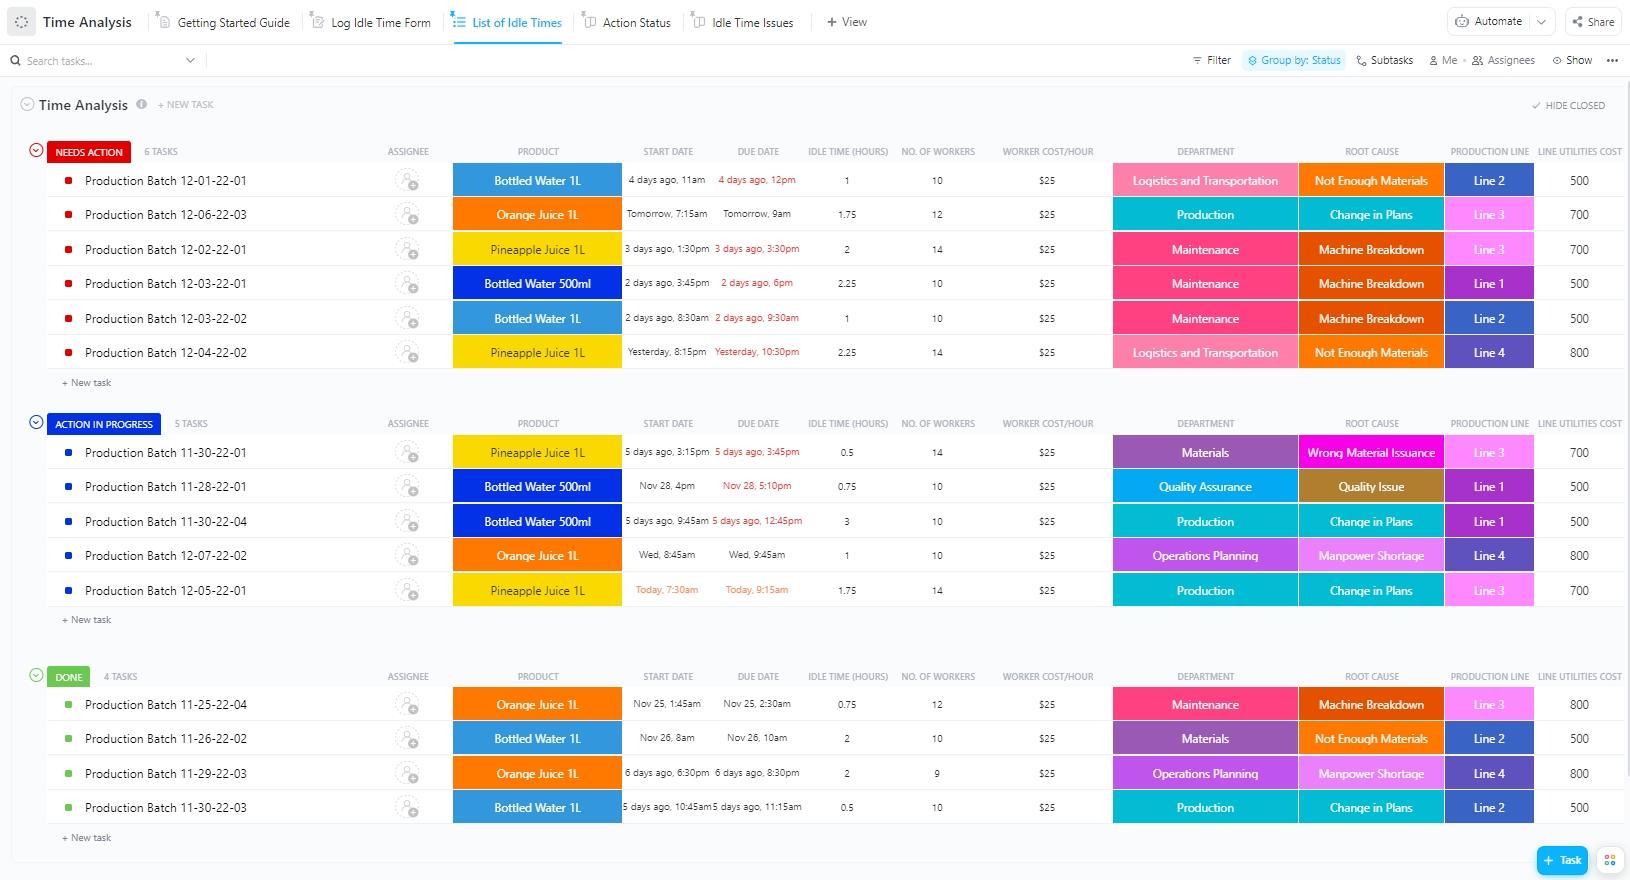
Once you start comparing planned vs. actual effort across tasks, phases, and roles, raw numbers alone can get overwhelming. The ClickUp Time Analysis Template helps you organize that data to surface patterns.
With this template, you can:
🚀 ClickUp Advantage: Once you know how to compare planned vs. actual effort, ClickUp Sprint Cards let you analyze effort at the task, phase, and team level using real-time data that stays connected to the work itself.
For instance, the ClickUp Sprint Burnup Card is ideal for understanding how reality diverges from the original plan every day.

Then, the ClickUp Sprint Burndown Card zooms in on execution discipline, showing how efficiently planned work is actually being completed within the sprint.

At the sprint start, the chart begins with 100% of planned effort remaining. As tasks are completed, the remaining effort line moves downward toward zero.
Effort variance only helps if it changes decisions. When teams wait until the end of a sprint or project to review planned vs. actual effort, they’ve already lost the chance to influence the outcome.
The real advantage comes from reviewing variance while work is still unfolding, when there’s still room to adjust scope, sequencing, or expectations.
Early variance doesn’t always show up as a missed deadline. More often, it appears as subtle execution signals:
Reviewing these variances during mid-execution allows teams to:
💡 Pro Tip: Leverage the ClickUp Velocity Card to determine whether what you’re seeing is a one-off sprint issue or part of a larger delivery pattern. Instead of reacting to variance in isolation, compare the current sprint’s progress against your team’s rolling average velocity from the last 3-10 sprints.
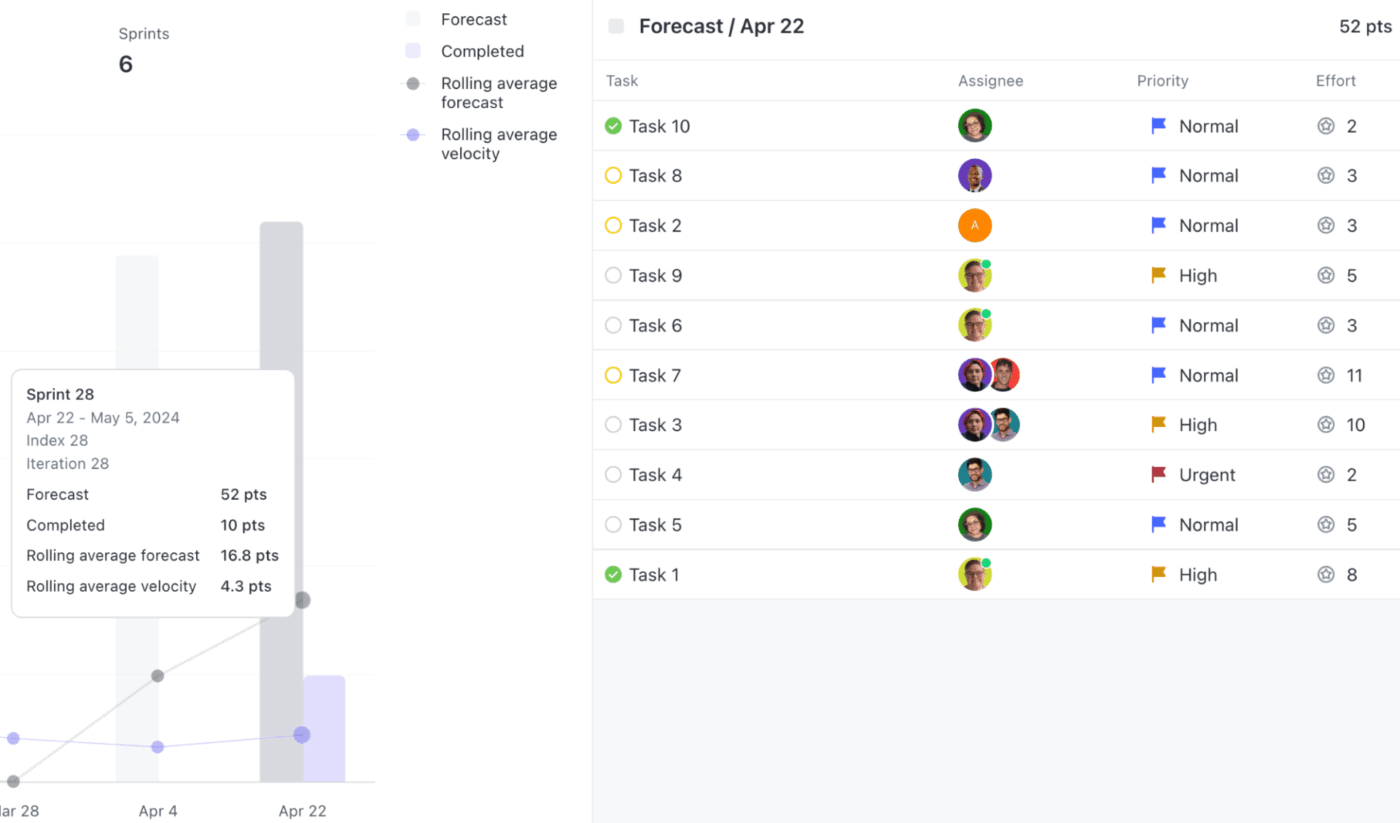
Here’s how this adds clarity during mid-sprint reviews:
This is where tracking planned vs. actual effort finally pays off.
Without a proper feedback loop, teams repeat the same optimistic assumptions and treat missed estimates as isolated incidents rather than signals. When you look across multiple projects or sprints, trends begin to emerge that aren’t visible in single deliveries:
Use this data to recalibrate future performance estimates, set more realistic capacity limits, decide where work needs to be broken down further, and add buffers intentionally.
💡 Pro Tip: Making sense of the historical effort data across sprints, projects, and teams can be challenging. ClickUp Brain adds real value here.
ClickUp’s context-aware AI is built directly into your workspace. Unlike generic AI time management tools, it understands your tasks, time estimates, statuses, sprint data, and activity history.
It helps by:
You can also use ClickUp Docs to document sprint retrospectives, reviews, summaries, and decisions about buffers, scope changes, or task breakdowns. Then, ClickUp Brain can extract key insights from the Doc, summarize historical data, and highlight recurring themes.
Here’s how you can put ClickUp’s AI capabilities to use:
Tracking planned vs. actual effort only becomes meaningful when you see how it plays out in real delivery scenarios.
The following examples show how different teams use effort comparisons to uncover delivery risks, explain missed plans, and improve estimation accuracy over time.
In Agile delivery, story points represent the planned effort or complexity a team estimates for a set of user stories or backlog items. Velocity, on the other hand, measures how many of those story points the team completes within a sprint.
If a team’s planned story points consistently exceed its completed velocity, it indicates that estimates are overly optimistic, introducing schedule risk and unstable commitments.
📌 Example: At the start of an Agile initiative, a team plans 40 story points for a sprint. By the sprint end, they complete 28 points, yielding a velocity of 28. Over the next 3-4 sprints, the team consistently finishes between 26 and 30 points.
This pattern reveals that the initial plan was not grounded in delivering reality. Teams can adjust future trend commitments to a realistic velocity band (e.g., 26-30).
If an initiative is planned in hours, matching those estimates against actual logged time reveals how closely execution matched the plan.
📌 Example: A project plan estimates 120 hours for design, 240 hours for development, and 80 hours for testing.
When the work concludes:
This variance breakdown shows testing as the biggest estimation gap. If actual hours < planned hours, you may be overestimating and compressing capacity unnecessarily. And if actual hours > planned hours, you likely need to revisit your planning process or examine hidden work categories.
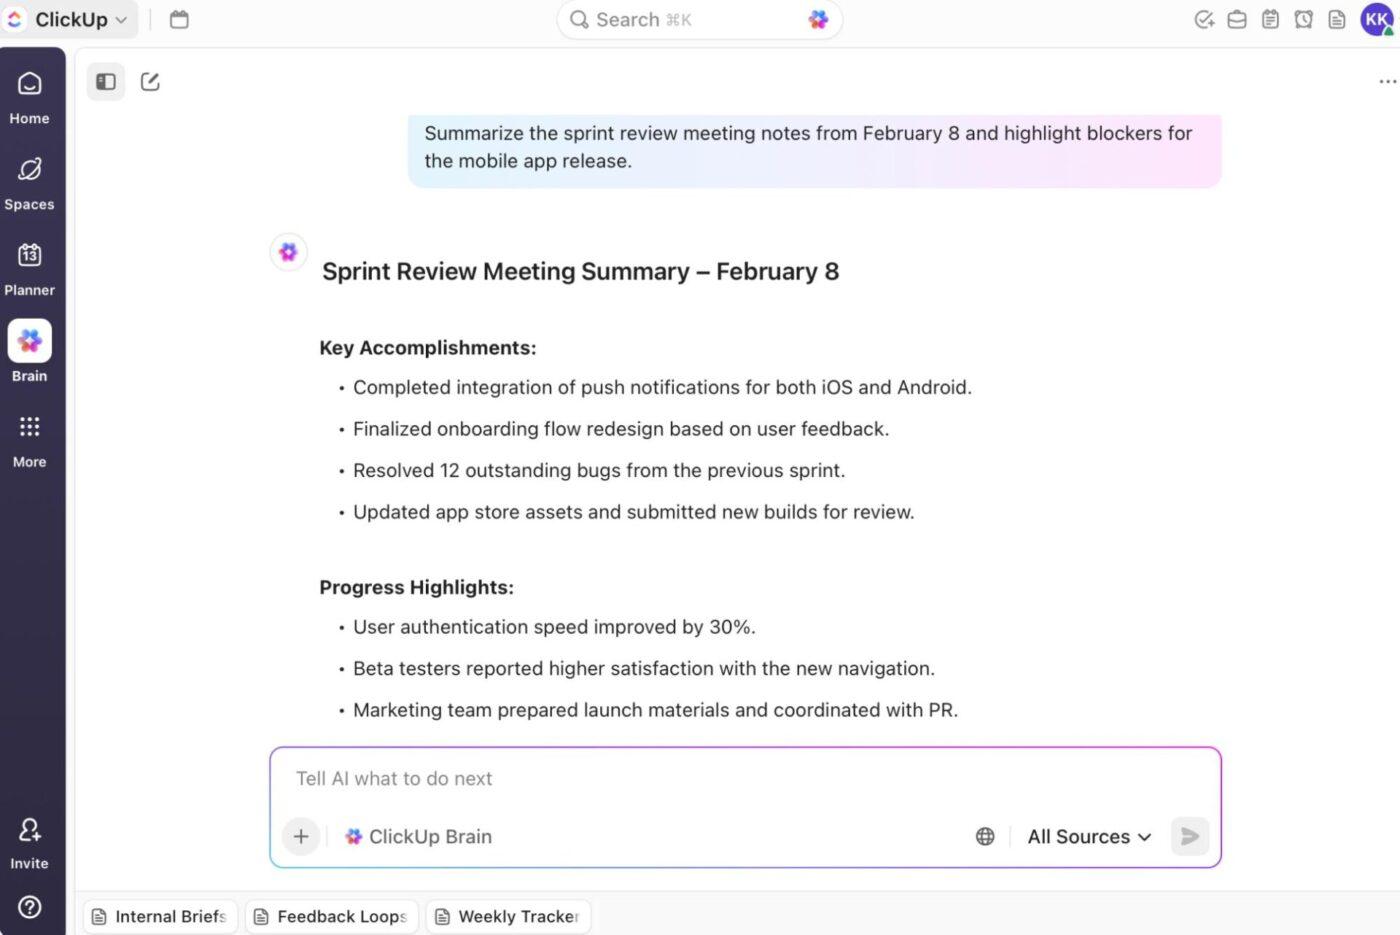
🚀 ClickUp Advantage: Planned vs. actual effort breaks down when real work never gets captured. ClickUp BrainGPT’s Talk to Text helps close that gap by turning spoken updates into structured, trackable inputs right where work happens.
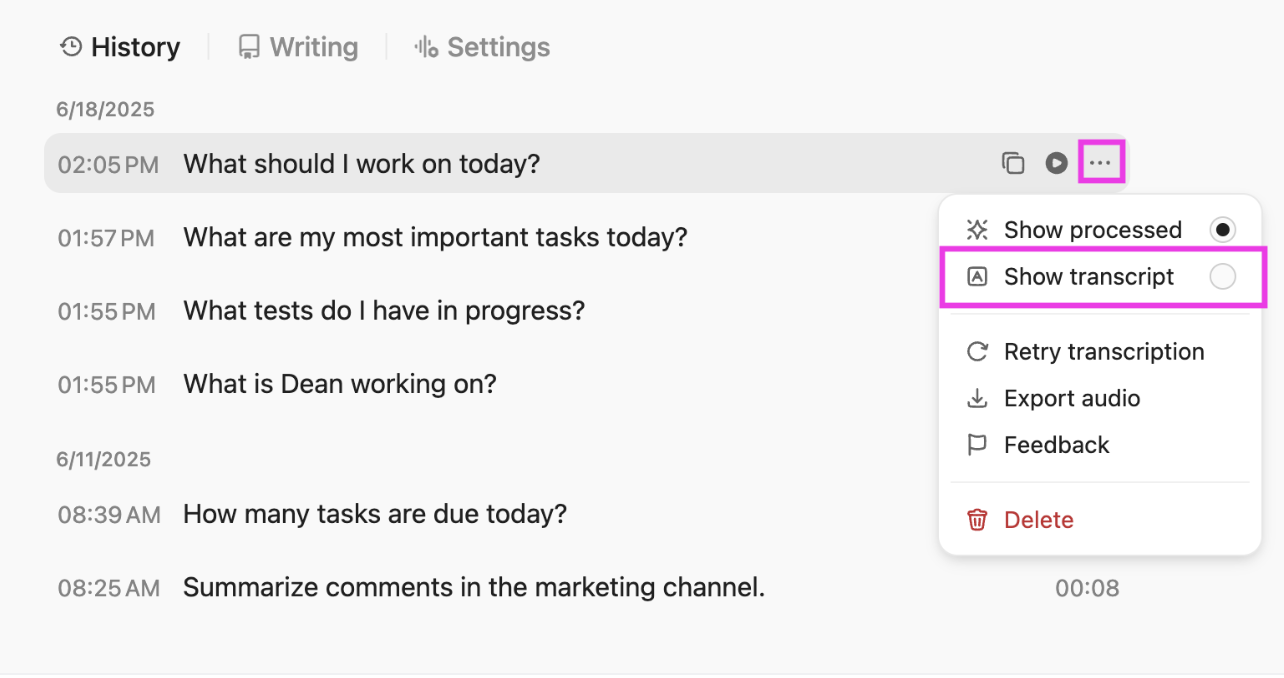
During standups, sprint reviews, or mid-sprint check-ins, team members can simply speak blockers, progress, rework, or scope changes. Talk to Text converts those conversations into clean, contextual text inside ClickUp. It auto-formats notes, links relevant ClickUp Tasks, and adds @mentions or follow-ups as you talk.
For instance, while reviewing sprint progress, a delivery manager can use Talk to Text to narrate what changed mid-sprint like, ‘extra QA cycle’ and ‘vendor delay.’ BrainGPT instantly turns that into structured documentation tied to the sprint. Over time, these transcripts become a rich input for improving future estimates, velocity analysis, and delivery forecasts.
Across multiple teams and cycles, some types of work (for example: integrations, bug fixes, and documentation) can consistently overrun original estimates. When you aggregate effort data over time, these patterns emerge clearly and create opportunities for systemic improvement.
📌 Example: In over five cycles:
Chronic patterns signal estimation bias, and addressing these biases improves future planning accuracy dramatically.
On its own, effort variance explains past performance. But when used consistently over time, it becomes one of the most reliable inputs for resource allocation. Two teams with the same availability can have very different adequate capacity if one routinely overruns estimates or completes work late in the cycle due to various time constraints.
📌 Example: If a team consistently runs at –15% variance (uses 15% more project effort than planned), planners will:
If a team runs with a +10% variance (takes less effort than planned), planners may adjust estimates upward or explain why time was saved (e.g., efficiencies or task simplification).
🔍 Did You Know? Francesco Cirillo invented the Pomodoro Technique in the 1980s, not to improve productivity, but to reduce anxiety about time. Timeboxing accidentally became one of the easiest ways to compare planned vs. actual effort.
Let’s explore practical habits and planning behaviors that help you produce more reliable estimates and reduce delivery surprises for continuous improvement.
🔍 Did You Know? Your brain is better at recalling how long something previously took than guessing how long it will take. That’s why tracking actual effort is indispensable; it retrains your future estimates.
Even well-planned projects fail to track effort accurately.
Here, we’ll break down the mistakes that distort planned vs. actual effort and how to fix them to drive continuous improvement in estimation and delivery confidence.
| Mistake | Solution |
| Failing to capture all actual effort (meetings, reviews, admin, rework often go unlogged) | Include all relevant effort by defining categories (e.g., rework, support, research) in your tracking practice so actuals reflect true effort |
| Ignoring external dependencies and their impact on effort | Map dependencies explicitly in planning and add contingency time based on historical delays with those vendors or processes |
| Letting scope creep hide in effort totals | Baseline scope at the start and separate re-estimate or added work, so planned vs actual comparisons remain meaningful |
| Not updating estimates when the project context changes | Revisit and rebaseline estimates when requirements shift, or unknowns are uncovered; tie estimation updates to milestone checkpoints |
| Ignoring cognitive biases in estimation (anchoring, wishful thinking) | Train teams on common biases and use structured estimation techniques like Planning Poker or data-driven forecasting to counteract subjective judgment |
📖 Also Read: Tips to Improve Time Management Skills at Work
Planned vs. actual effort estimates fail because the data lives in too many places, gets updated too late, or never connects back to the original plan.
ClickUp brings planning, execution, and actual analysis into a connected system. You get ClickUp Sprints to preserve your original commitments, and ClickUp Time Tracking for capturing effort as work happens.
Dashboards turn raw data into live visibility across tasks, teams, and timelines. And ClickUp Brain ties it all together by summarizing trends, surfacing variance patterns, and turning historical effort into guidance.
Sign up to ClickUp for free today! ✅
Some of the most frequently asked questions we get about TOPIC.
Planned vs. actual effort is the comparison between the effort you estimated for work (in hours, story points, or other units) and the effort actually spent when the work was done. It highlights where estimates were accurate and where execution differed from the plan.
Effort accuracy is measured by comparing planned effort to actual effort, often as a percentage variance: ‘(Actual effort – Planned effort) ÷ Planned effort x 100.’ A lower variance indicates closer alignment between estimates and reality.
Project management and time tracking systems such as ClickUp let you record estimates, log actual time, and report on the differences in dashboards or reports.
Estimates often differ due to optimism bias, hidden complexity, interruptions, dependencies, or unknown risks. People tend to imagine ideal conditions and overlook real-world variability, a phenomenon described as the planning fallacy.
Teams improve estimation by leveraging historical delivery data, incorporating cross-functional perspectives, and refining estimation techniques. It’s also best to review past variances to inform future estimates. Continuous learning and retrospective analysis can help refine accuracy.

© 2026 ClickUp

There’s an easier way. Try a free AI Agent in ClickUp that actually does the work for you—set up in minutes, save hours every week.