


Still downloading templates?
There’s an easier way. Try a free AI Agent in ClickUp that actually does the work for you—set up in minutes, save hours every week.
Sorry, there were no results found for “”
Sorry, there were no results found for “”
Sorry, there were no results found for “”

In a high-performing team, everybody knows exactly what they’re responsible for, how they’re doing, and how it all ties in with the organization’s goals.
These teams, who work as one unit and consistently crush targets, have one common habit: they track and know their numbers at all times.
You can’t improve what you don’t measure.
The first step toward improving performance, then, is measurement. This brings us to the concept of KPIs or Key Performance Indicators. KPIs help continuously quantify the performance of individuals, teams, and the entire organization.
However, setting KPIs is only the first step.
You must also monitor your progress regularly to ensure you and your team can achieve your goals. That’s where a KPI dashboard comes in handy! 📈
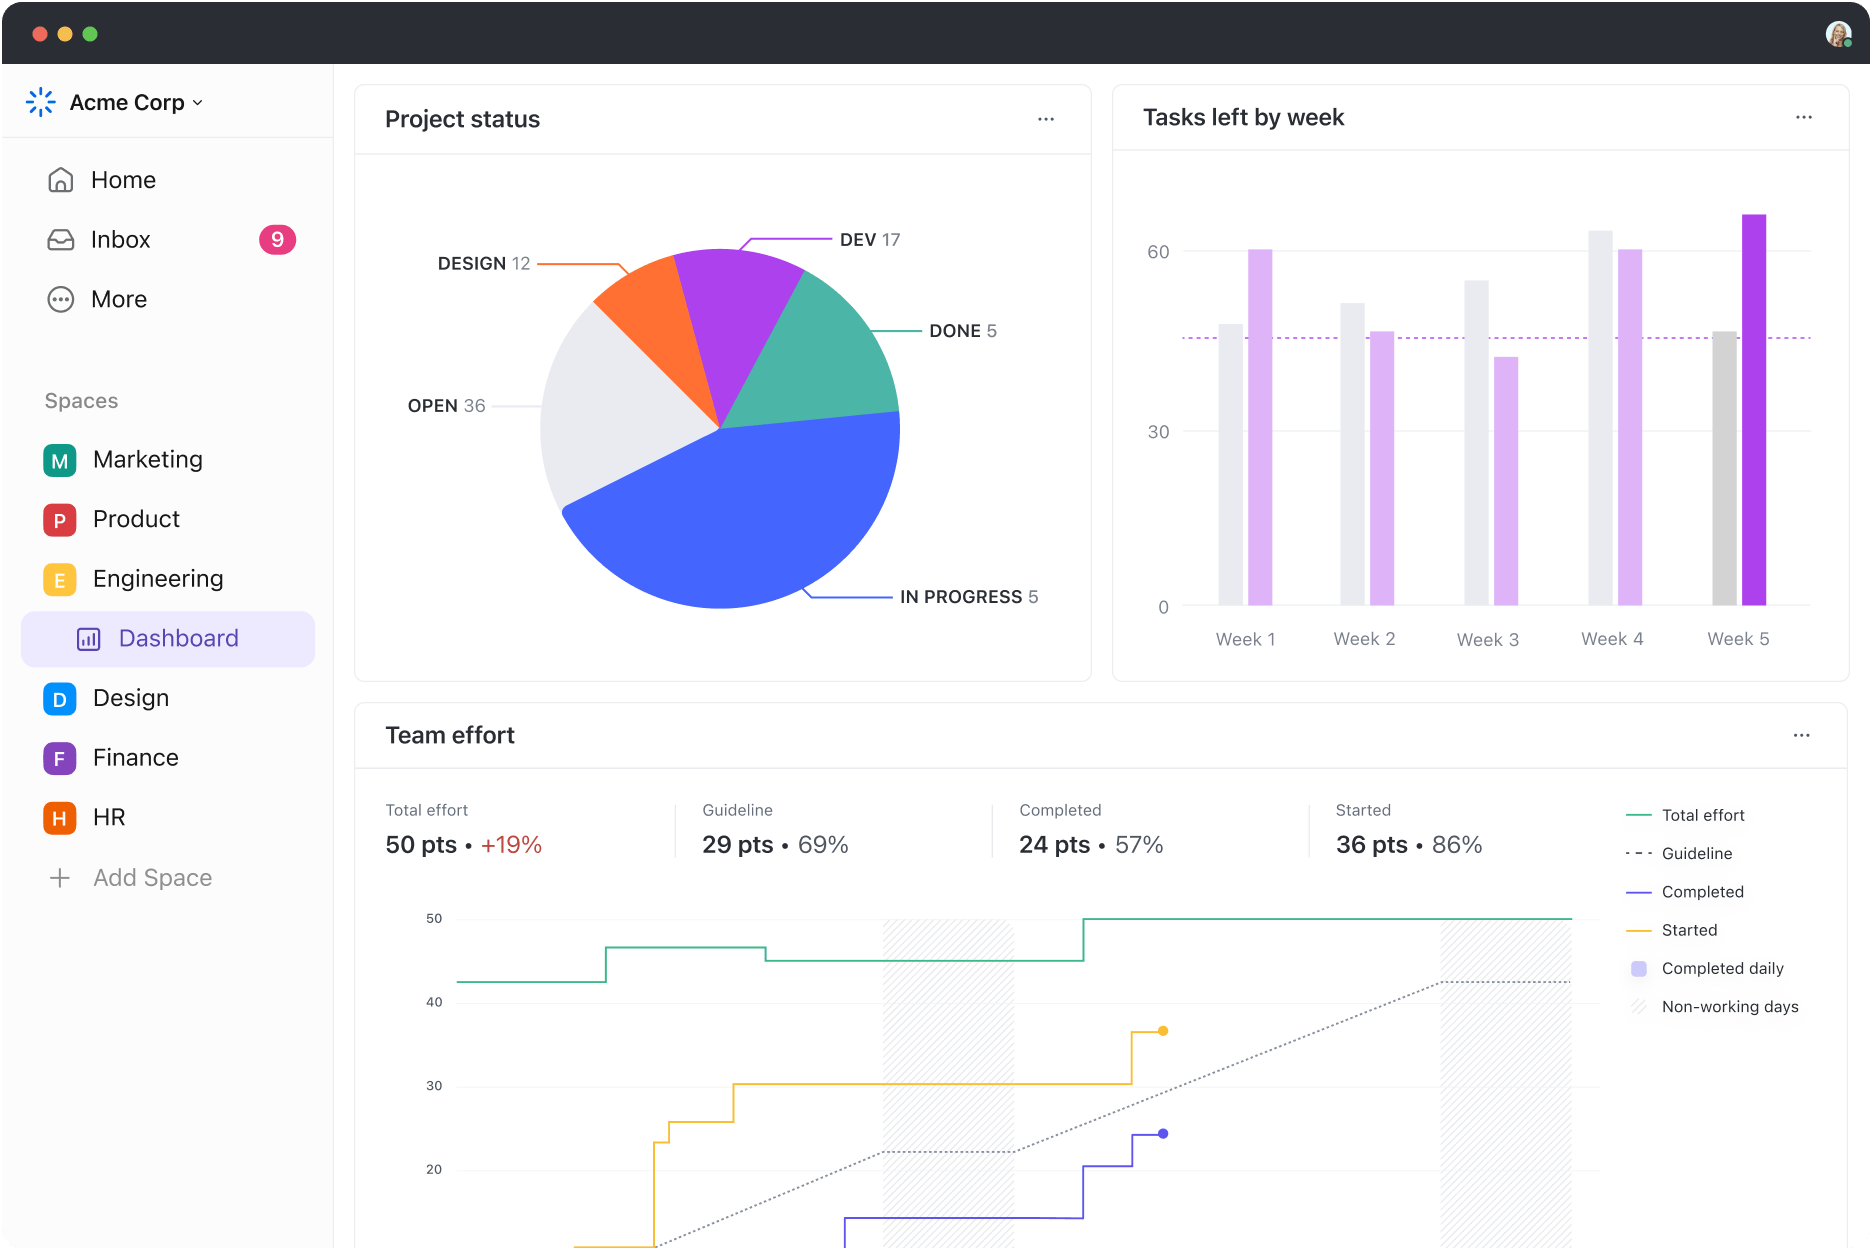
A KPI dashboard visually represents your KPIs (Key Performance Indicators), giving you a detailed view of multiple KPIs in one place. Using graphs, charts, progress bars, etc., the KPI dashboard helps you quickly see where you or your team stand against specific goals. You can instantly gauge how close you are to reaching benchmarks.
KPI dashboards give all stakeholders a clear understanding of the organization’s performance at all times. This helps identify problem areas and take corrective action where needed.
Here is how a KPI dashboard helps a business:
Keep your KPIs in one place and ready to visualize with ClickUp’s free KPI template. Try it out today!
Modern KPI dashboards compile multiple KPIs in one view, saving time you’d otherwise spend analyzing data from multiple sources.
Shared views help teams analyze performance collaboratively and leverage data and metrics to quantify progress.
New to KPIs? Watch our video that demystifies KPIs for you once and for all!
The KPI dashboard is more than just a tracking tool: It offers a snapshot of impending deadlines and tasks that need urgent attention, along with their respective owners. This level of clarity and accountability leads to informed decisions and timely adjustments, so you can maintain momentum toward goals.
A well-designed KPI dashboard will typically have these elements:
A KPI dashboard will showcase the most important metrics relevant to the team and organization. Each of the metrics is typically specific, quantifiable, and measurable. For example, key metrics for a product management team could include feature adoption rate, NPS (Net Promoter Score), user retention rate, customer satisfaction score (CSAT), etc.
Simple pie charts and lists of numbers might not be enough to track your progress accurately. Instead, you should look for an executive dashboard that offers comprehensive insights through visual elements. Elements like graphs, gauges, thermometers, and progress bars make monitoring progress easier.
A KPI dashboard that visualizes data through charts, graphs, scorecards, etc., makes it easier for teams to quickly grasp and analyze the data and decide on the next steps.
You want a dashboard with the most current and reliable data, so you can make informed decisions and take timely action. Ideally, your KPI dashboard should be able to update data automatically in real time or at frequent intervals. This ensures that the information you’re looking at is always current and reliable.
While many teams still create KPI dashboards in Excel, a significant drawback is that they won’t stay updated automatically. Modern tools can do this better by integrating with your data sources.
The more advanced dashboards give you filters and drill-down options to see specific metrics in more granular detail. For example, ClickUp Dashboards have filters and toggle switches to help you find the necessary information.

Setting milestones is important for a team leader to maintain team morale, especially for long-term objectives. They serve as checkpoints that offer encouragement through visible signs of progress.
Timelines, on the other hand, give you and your entire team a clear roadmap for achieving objectives, helping you stay motivated and focused. Your KPI dashboard should be able to incorporate these along with performance metrics.

The KPI dashboard can truly be useful only when users can personalize their dashboard view. For example, a sales leader might only wish to see overall sales KPIs and add filters by teams. On the other hand, a department head may want to see detailed team and individual performance KPIs in a specific layout.
Your dashboard should be customizable so that you don’t have to create multiple KPI dashboards tailored to each team’s unique requirements. You can also create a common dashboard template that can be repurposed as often as required.
💡Pro Tip: ClickUp Dashboards are highly customizable, with over 50 widgets to create your preferred data view.
Some KPI reporting tools allow you to set up alerts and notifications for specific events requiring intervention or quick action. For instance, you could set up an alert for when your website traffic falls by more than 10% in a week.
A KPI dashboard is a tool for everyone in the organization, not just the tech-savvy ones. Its design should be intuitive and user-friendly, allowing easy navigation. All key insights must be readily accessible so team members don’t have to search extensively for important business data. Additionally, making the dashboard mobile-friendly enhances its utility since teams can track crucial updates anywhere and anytime.
As a business analyst, the dashboard feature of ClickUp has made it a lot easier to depict data in a beautiful and purposeful manner. The comparison feature has customization through which data can be displayed in a meaning complete way and can be understood very easily
Now we know what an effective KPI dashboard is composed of, let’s also answer the one question that confuses many—the difference between OKRs and KPIs.
While KPIs and OKRs are used to measure and track performance, their purpose and features differ. While KPIs measure your performance against specific metrics, OKRs set your vision and strategy for achieving your goals. Here’s a quick comparison between the two:
| Aspect | KPI | OKR |
|---|---|---|
| Purpose | To measure and monitor performance on an ongoing basis | To define and track objectives and measurable outcomes |
| Time-frame covered | Ongoing | Usually quarterly or annual |
| Focus | Track individual or team performance against pre-defined targets | Align and move individuals or teams toward achieving specific objectives |
| What they measure | Quantitative data points | Quantifiable key results linked to objectives |
| Structure | Descriptive and involve individual metrics | Prescriptive and drive progress toward goals |
| Flexibility | Static for the duration unless there is a change in targets | Updated and revised as and when required |
| Example | Website traffic Monthly leads Sales revenue Daily transactions CSAT scores Customer acquisition cost (CAC) | Increase website traffic by 50% Grow inbound leads by 20% Increase revenue by 25% Improve conversions by 18% Improve CSAT score by 10% Reduce CAC by 15% |
KPI dashboards differ in design and functionality to cater to the specific needs of each role, from CEOs to managers, team leads, and individual contributors within an organization.
Understanding the distinct features and purposes of each can help you implement the most relevant KPI framework effectively.
Executives and senior management in the organization require a high-level overview of the company’s performance against set targets. A strategic KPI dashboard provides this overview of the organization’s progress toward strategic goals and long-term objectives. It would include an overall view of business health and company-wide data regarding financial performance, customer satisfaction, etc.
This type of executive KPI dashboard provides:
Analytical KPI dashboards are more granular than strategic dashboards and provide in-depth data and insights to help managers make decisions. They usually include historical data and features, such as filters and views, for deeper analysis. Analysts and data scientists in your organization would use such dashboards daily. These are the best KPI dashboards to use for long-term planning and strategy.
Some organizations use an analytical dashboard as the master data source of insights, with various cuts made for specific teams or functions.
The most commonly used kind of KPI dashboard is the operational dashboard. This gives a regular snapshot of your business operations at a point in time. Such dashboards usually lack frills like multiple views and progress bars; instead, they focus on the current performance or condition. Operational KPI dashboards also have a simpler layout that is easy to use.
This kind of KPI dashboard is often used by team leads and middle management; its common features include:
Examples of this kind of dashboard include a daily sales performance tracker, team attendance report, customer support response times tracker, stock inventory level dashboard, company sales KPI dashboard, etc. Various teams within the organization (sales, marketing, customer service, etc. can also create operational dashboards to track functional KPIs.
Individual contributors must understand how their work impacts the organization’s goals. Their dashboard is more tactical and focuses on the following:
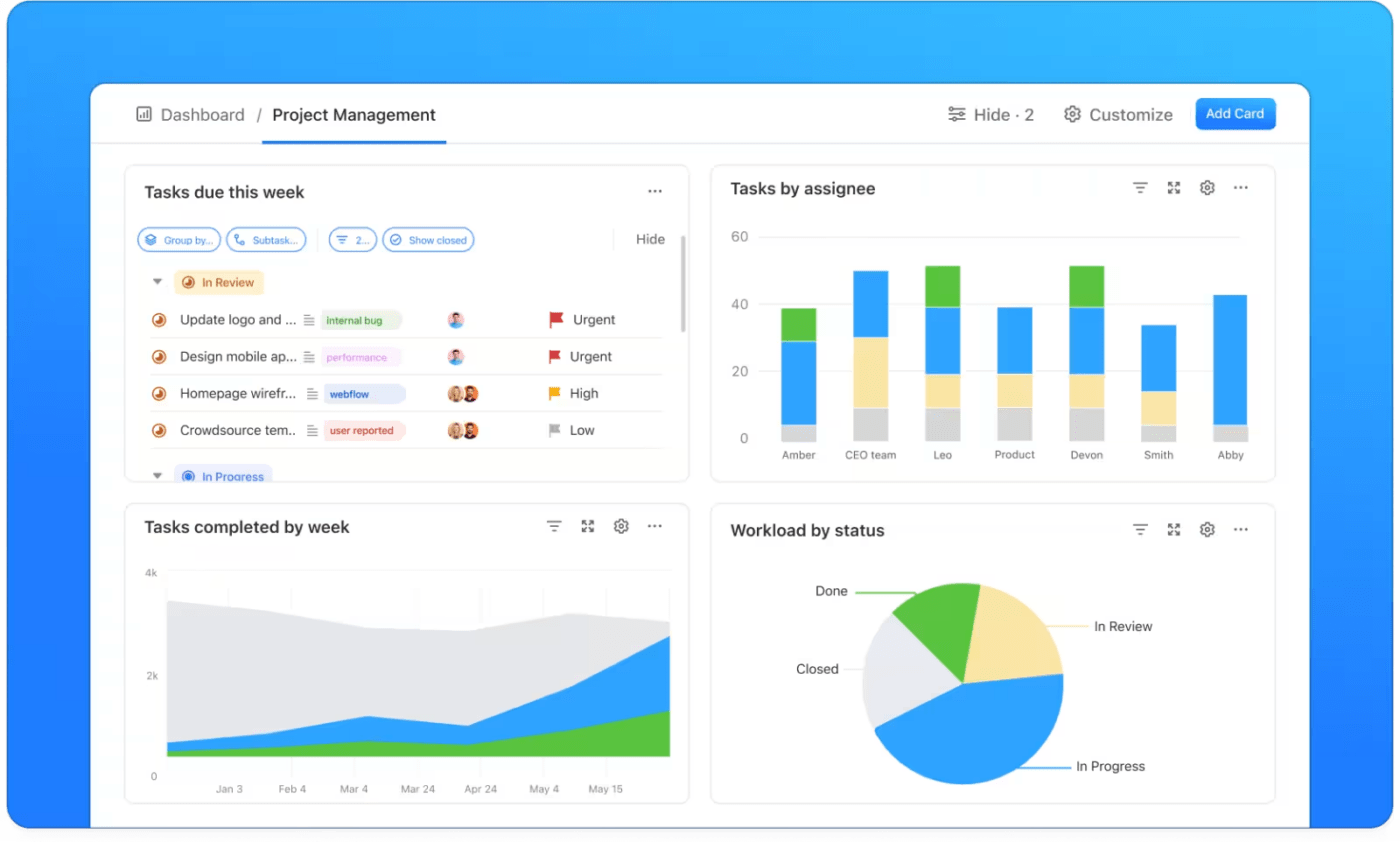
Project managers usually have a separate dashboard for each of their projects. This project management KPI dashboard can visualize how the project is progressing and whether overall performance is up to expectations.
Such a dashboard would include KPIs related to:
It helps project managers stay on top of the project and take corrective action whenever necessary to bring specific KPIs back on track.
Some organizations also create custom KPI dashboards for specific teams or initiatives. These dashboards compile and display the most relevant data for each case.
Each type of KPI dashboard ensures that everyone in the organization, regardless of their role, is aligned with the strategic goals. By providing relevant data and insights to employees at every level, KPI dashboards facilitate effective decision-making, enhance performance management, and promote a culture of transparency and accountability.
Also read: Types of KPI scorecards to track your project
Now, let’s show you how to create a KPI dashboard for yourself or your team. Follow along!
While you can still create this the old way in an Excel sheet, a modern dashboard solution will simplify day-to-day management. Among all the options available, ClickUp stands out as a comprehensive project management solution that simplifies goal and progress tracking.

Before building your KPI dashboard, you must decide on your goals. When setting goals, keep in mind that they must be able to move you toward your long-term objectives.
The best way to set relevant goals is to follow the SMART framework: set goals that are Smart, Measurable, Achievable, Realistic, and Time-bound. If you haven’t done this before or want to save time, you can use the ClickUp Smart Goals Template to decide your goals efficiently.
This customizable template helps you break down complex objectives into smaller, more achievable goals. It helps you define Specific, Measurable, Achievable, Relevant, and Time-Bound objectives.
The SMART Goal Worksheet View will give you a space to brainstorm and store all of your ideas, while the Company Goals View helps you keep track of all the goals that your team is working on.
Once you have zeroed in on the most relevant goals to track in your KPI dashboard, create them in ClickUp.
💡Pro Tip: Setting team goals? Involve team members in goal setting to get early buy-in. ClickUp Whiteboards and mindmaps make collaborative ideation and brainstorming easy.
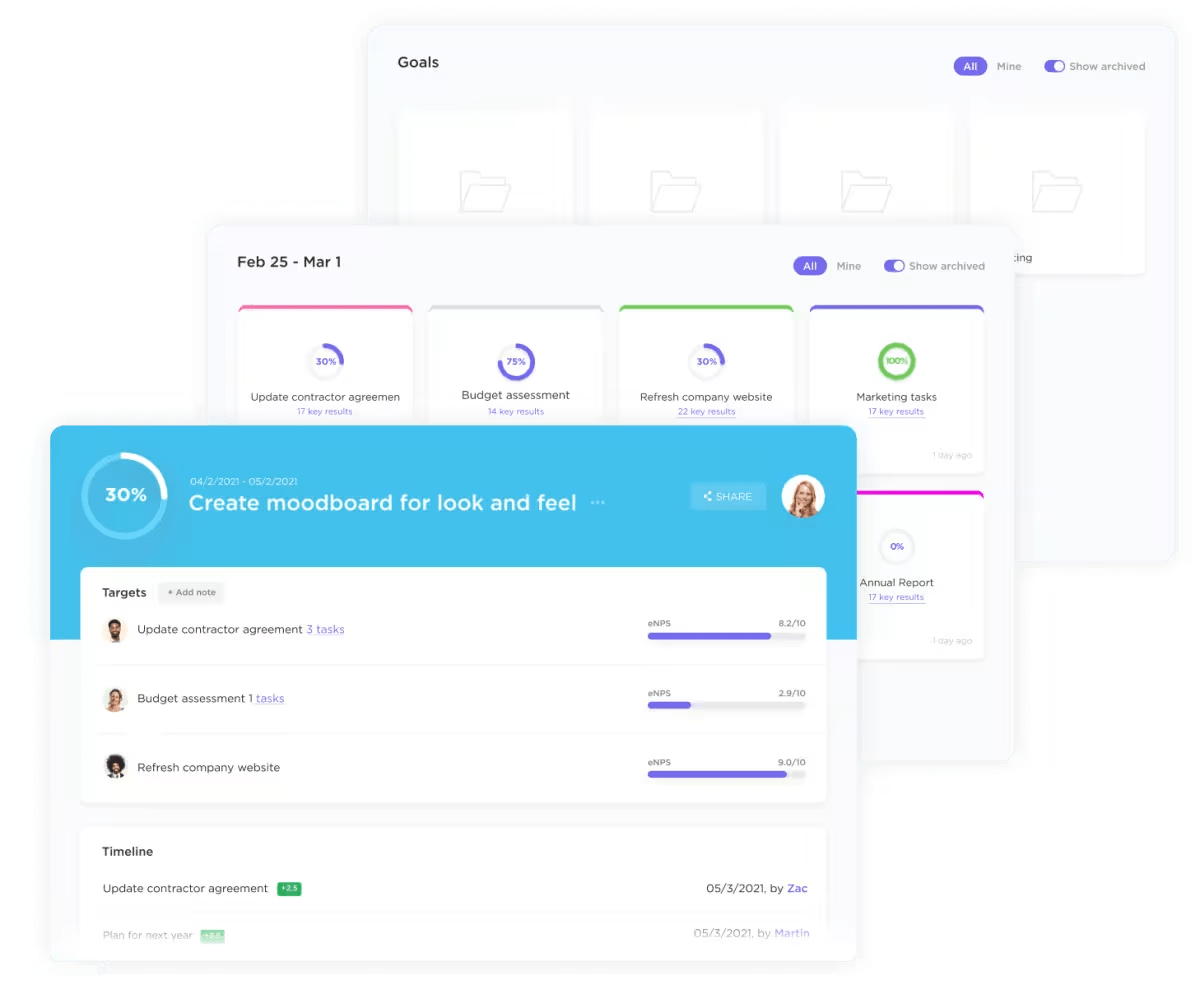
ClickUp Goals lets you create and track your goals and KPIs visually and intuitively.
With ClickUp Goals, you can:
Also read: How to set team goals effectively
Now that you’ve set your goals, let’s decide on the metrics that will best help you measure your progress toward them.
For example, your goal may be to increase revenue by a certain percentage. In that case, you want to track metrics related to leads, conversions, average order value, profit margins, and so on.
You can create a custom dashboard in ClickUp to track these metrics. It updates data in real time, so you never have to worry about how relevant the information is. Moreover, you can track multiple metrics in one dashboard, making analysis much easier.
For each metric you identified earlier, decide on specific (and realistic!) targets you’ll aim for. For example, for the conversions metric, you might set yourself a target of 10% over your current conversions.
Targets help you measure your progress toward the goal at any point in time and keep you on track.
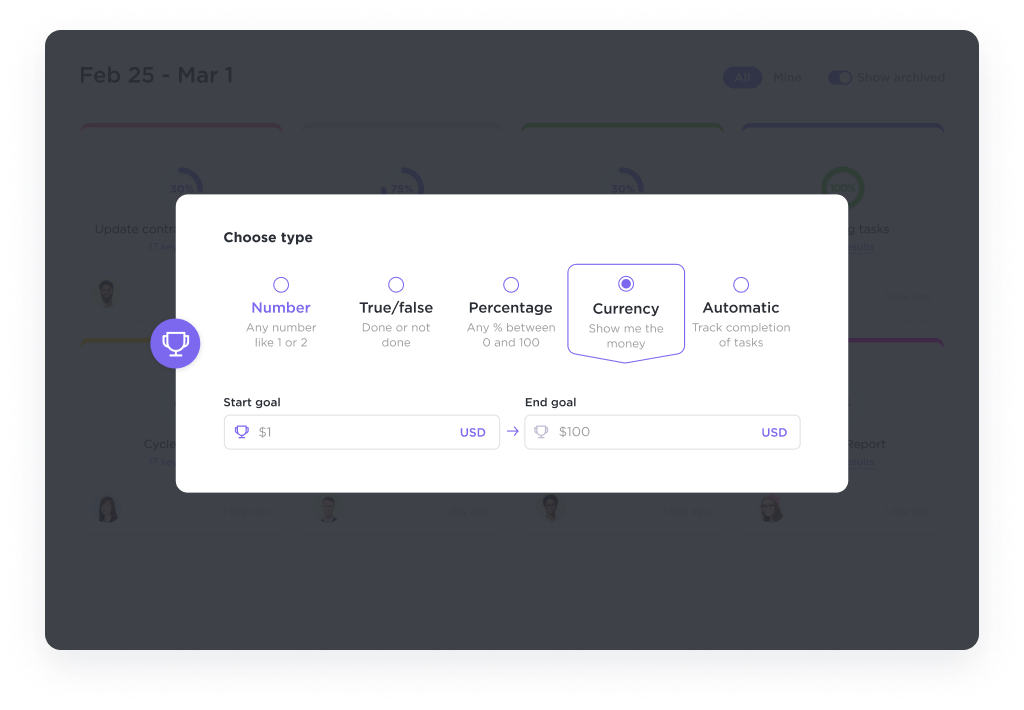
ClickUp Goals lets you set five types of targets for each goal:
💡Pro Tip: You can also use ClickUp Milestones to highlight and track the critical tasks in your project.
Here’s an example of how you’d set up targets in the dashboard for a customer support team’s KPIs.
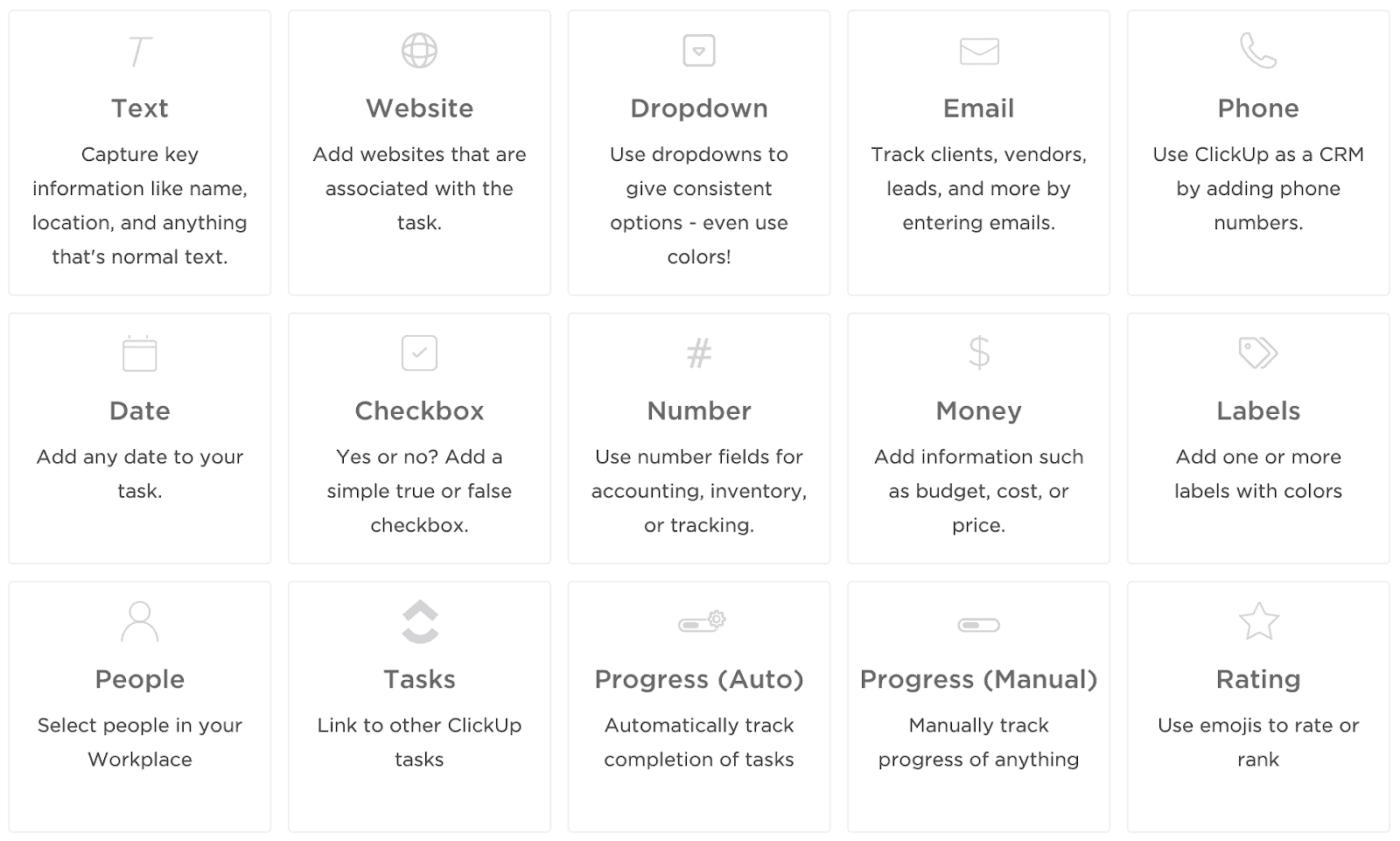
You might want to track metrics such as:
To view these in the KPI dashboard, you would add Number widgets to measure cases handled and escalations on an ongoing basis. Similarly, you’d add a Time Tracking widget for tracking customer support response times and a Progress widget for user engagement metrics like CSAT.
Use ClickUp’s Integrations to automate data collection where possible, such as linking customer support software to track response times automatically. ClickUp supports native integrations with various apps, such as Slack, Everhour, Front, and Hubspot, and lets you connect through Zapier to hundreds more. You can also build custom integrations using the ClickUp API.
Additionally, the dashboard can integrate data from ClickUp’s various other features (such as ClickUp Tasks and ClickUp Goals), allowing you to monitor updates consistently.
As you flesh out your dashboard’s layout, keep it visually appealing and user-friendly. This will guarantee smooth navigation for all team members. Don’t hesitate to try out different layouts to discover the most effective mix of aesthetics and functionality. You can also try different dashboard templates till you find one that suits you perfectly.
ClickUp allows you to customize your dashboard just as you want it. Apart from 50+ widgets to choose from, here are a couple of other ClickUp features that make this super simple for you:
Now that you’ve set your targets, it is time to track your chosen metrics. A KPI software like ClickUp will do this automatically for you, keeping your dashboard data updated.

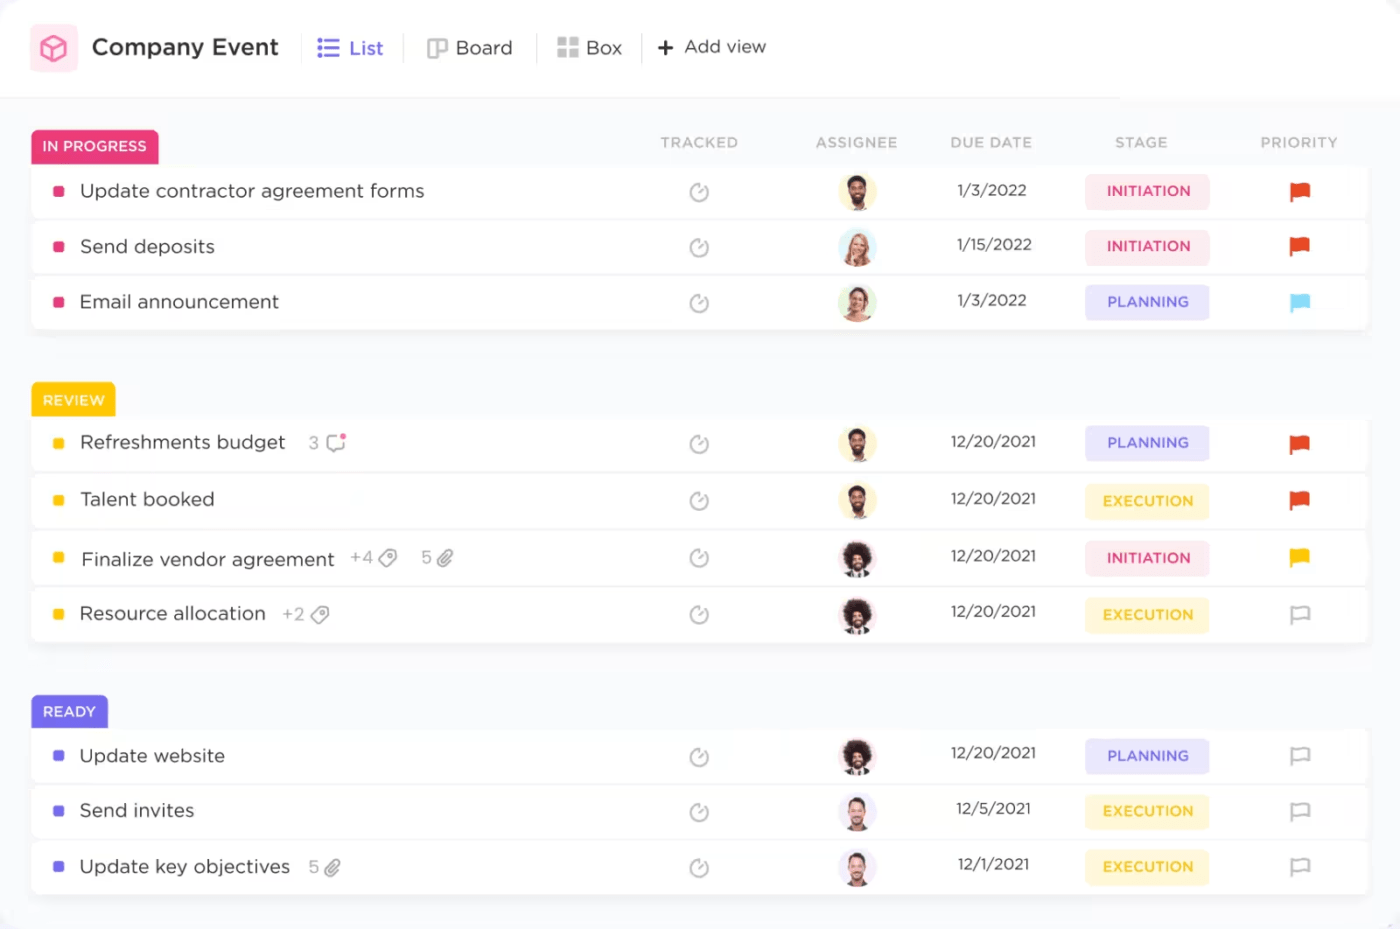
ClickUp Tasks helps you organize and track tasks related to each goal for effective management. The intuitive drag-and-drop interface simplifies task management, providing multiple views for a comprehensive overview of workflows.
Apart from the Dashboard view, ClickUp Views also lets you visualize and study your data in various ways. For example, the List view (great for granular breakdown of each task), Timeline (if you want to view tasks by date and duration), Workload view, Gantt chart, and more.
💡Pro Tip: You can create a task in ClickUp to remind you to track your KPI metrics regularly.
Or, better still, automate this task by outsourcing it to ClickUp Brain, the integrated AI assistant in ClickUp. You can get it to analyze data to track metrics and schedule and send automated progress reports.
You can ask ClickUp Brain questions, and it’ll search every dashboard in your Workspace to generate the insights you need automatically and quickly.
Do ensure that all relevant team members have access to the KPI dashboard. Sharing the dashboard promotes transparency and keeps everyone aligned on the organization’s goals and their role in achieving them.
Worried about security? Don’t be—you can set user permissions to restrict dashboard access only to authorized persons.
After tracking your metrics for a while, analyze the data to see whether you are on track to meeting your goals. If not, you can quickly take a call on the next steps.
ClickUp lets you quickly move from a broad overview to granular insights using filters and drill-down features in the dashboard.
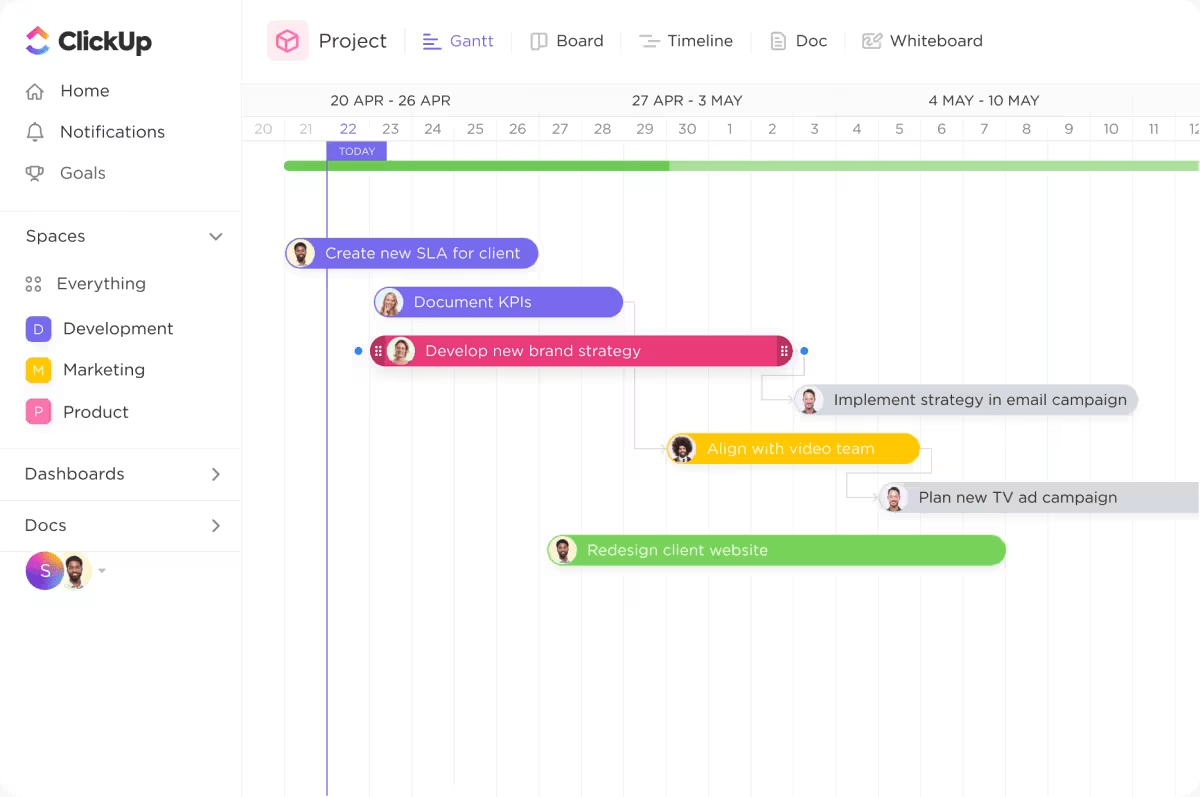
Gantt charts in ClickUp are another excellent way to get an overview of all your project tasks and metrics and see where you need to catch up. You can use the drag-and-drop functionality to adjust timelines where needed. They also help you identify any task dependencies that are holding you up, and find slack time that might be available.
💡Pro Tip: Ask ClickUp Brain a question, and it will search every Dashboard in your Workspace to bring you answers instantly. Now think about how you will use the time saved 🙌
Along with tracking and analyzing individual metrics, it is also essential to pause regularly and evaluate how you’re doing overall. These check-ins help you view achieved milestones and identify areas of improvement.
💡Pro Tip: Set weekly or bi-weekly reviews using ClickUp’s Calendar to assess progress on KPIs and adjust tasks and strategies as needed.
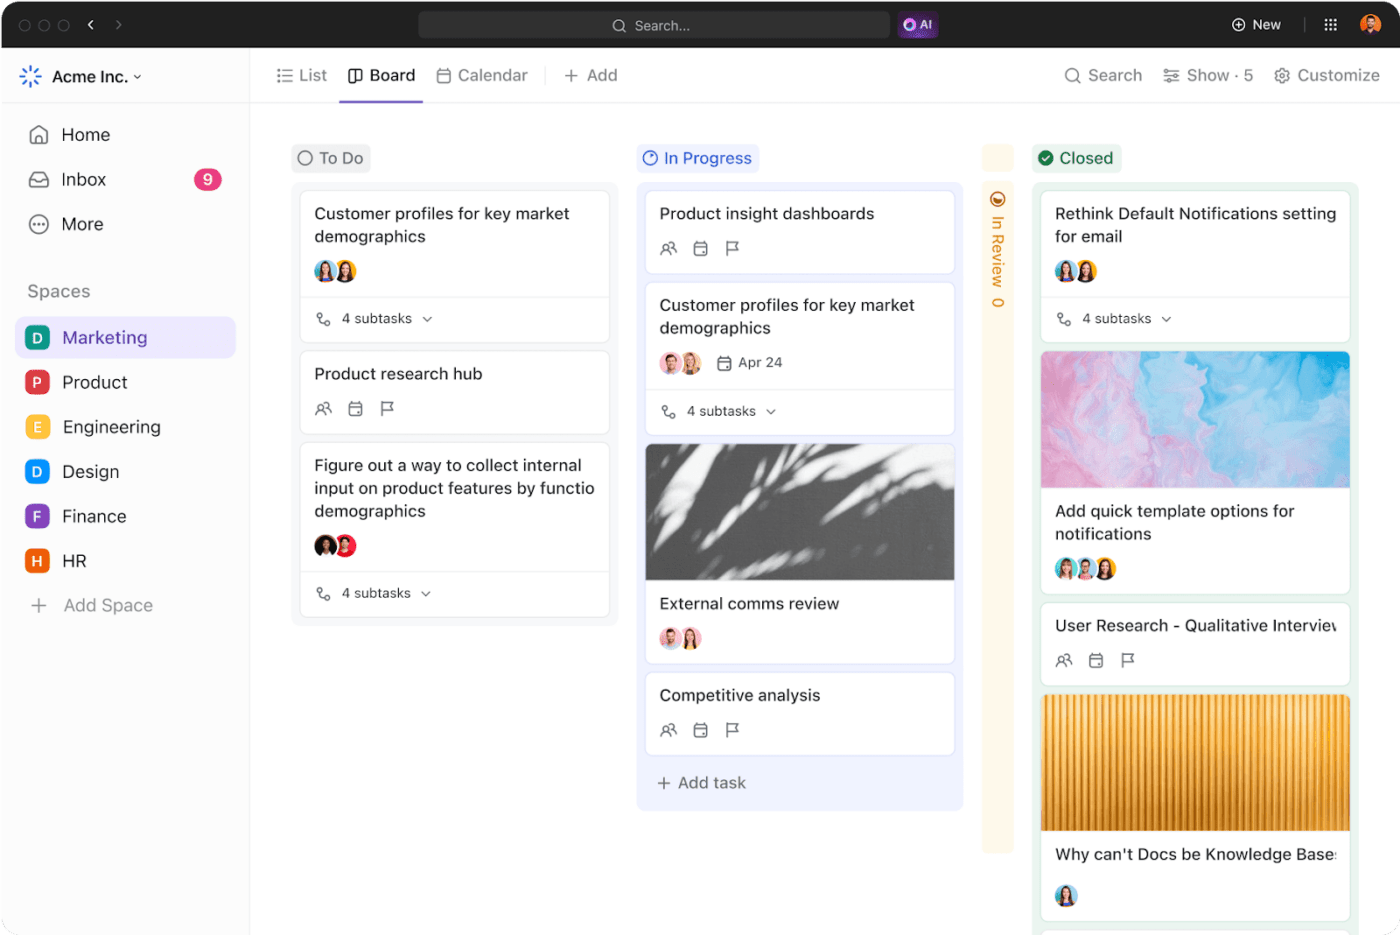
ClickUp’s Board View groups tasks by status to help you quickly track progress and make adjustments. The visual nature of the Kanban board makes it easy to track and manage objectives, so you can shift focus and resources to where they’re most needed.
After an evaluation, you might decide to tweak your targets or timelines or even change your strategy. Given how dynamic our work environment tends to be, such evaluations help teams keep in touch with changes and remain agile.
💡Pro Tip: As you use the KPI dashboard, gather feedback from your team on its effectiveness and usability. Continuously look for ways to improve your organization’s KPI dashboard.
Regularly scheduled reviews ensure the dashboard continues to meet your needs and helps you celebrate achievements to boost morale.
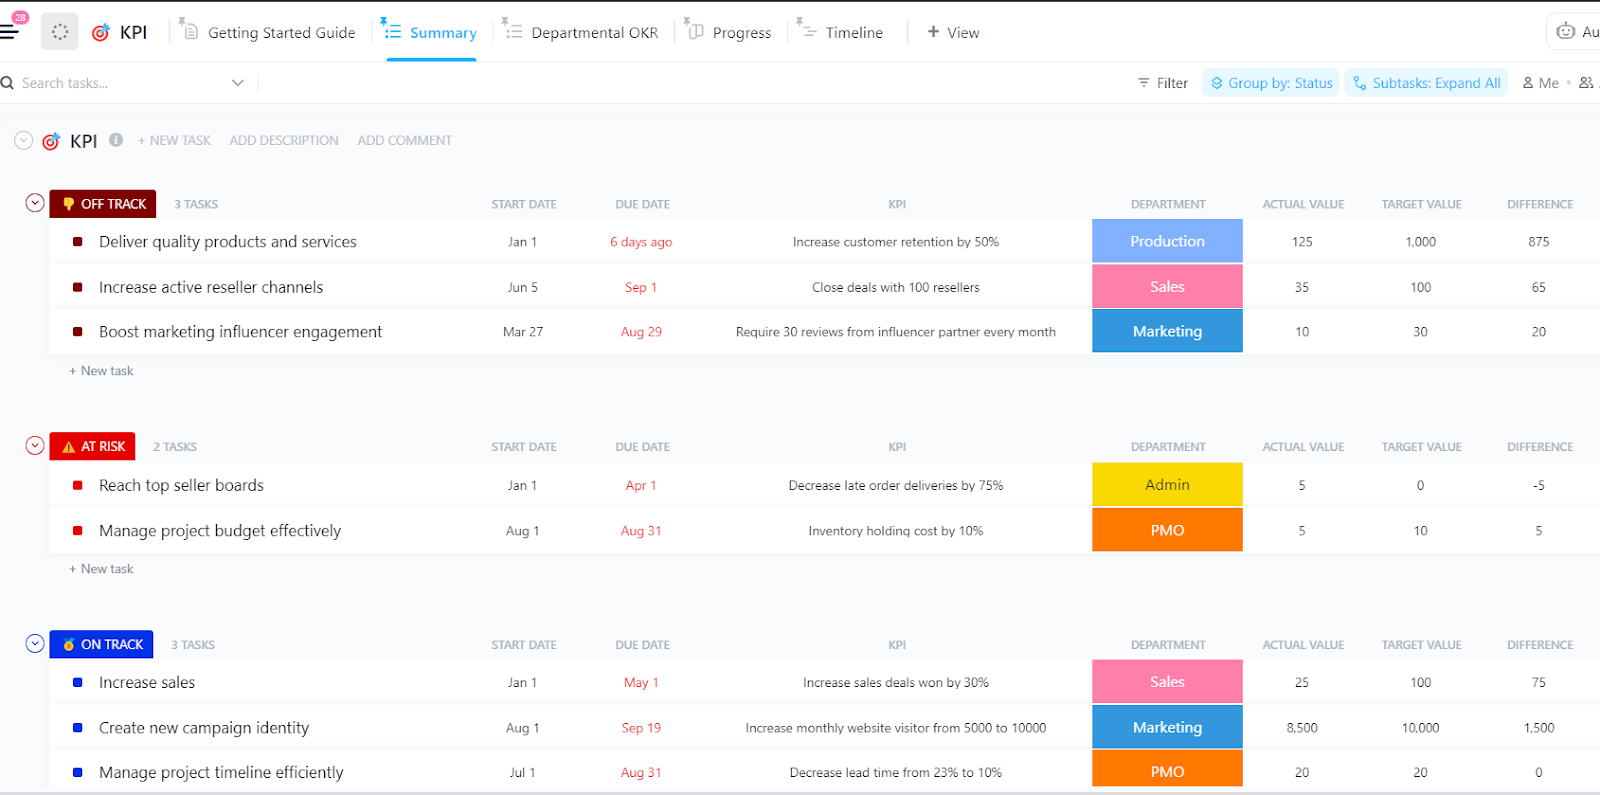
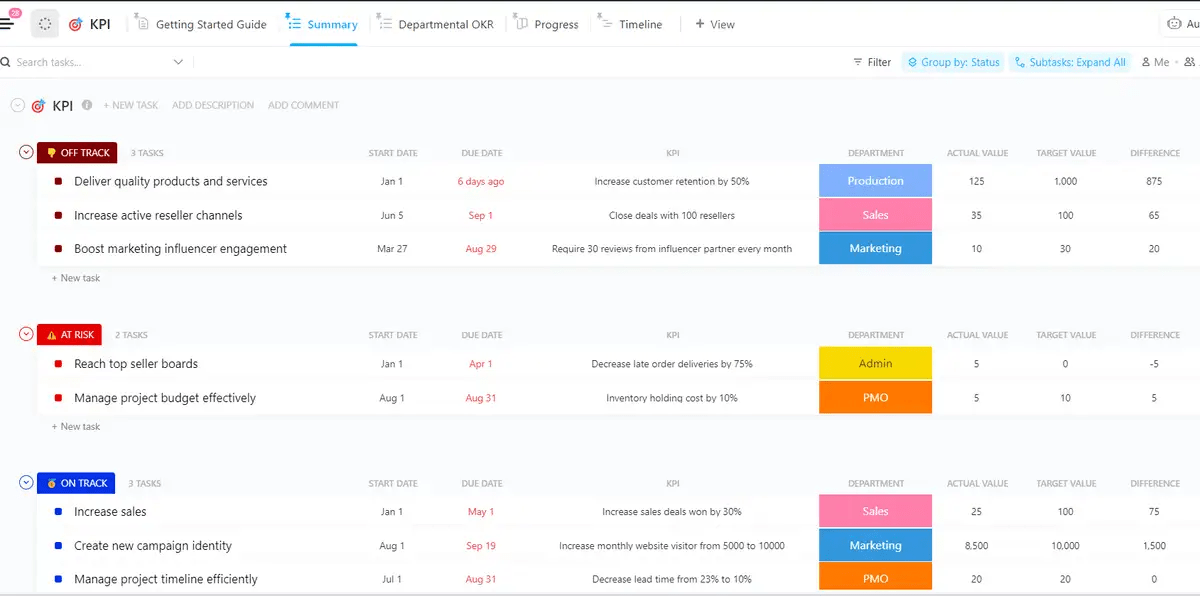
So, this was the dashboard creation process in a nutshell. If you don’t want to spend time creating your own dashboards, you can also use the ClickUp KPI Template to quickly set up and track success metrics for you and your team.
This KPI dashboard template helps you:
After importing the KPI dashboard template, take some time to customize it to fit your organization’s specific objectives and key results. You can use custom statuses (Completed, Off Track, On Track, Not Started, and At-Risk) and custom fields (Progress, Department, Target Value, Actual Value, KPI, etc.) to update it to your liking. It also helps you track KPIs better with native time-tracking, tags, and automation.
While leaders can use the Summary View to get an overview of all KPIs and how they are trending, department managers can track the progress of individual departments with the Departmental OKR View. Additionally, the Progress View can show an in-depth evaluation of each individual KPI, while the Timeline View is great for tracking milestones and deadlines.
Let’s quickly look at a few KPI dashboard examples to see how they can be used for different metrics and functions.

With the ClickUp Marketing Campaigns Dashboard, teams can have an overview of their major marketing initiatives in one go.
Let’s consider the case of a social media marketing campaign in which you identified goals such as increasing reach, engagement, and followers.
To track the campaign’s performance, you can build a marketing KPI dashboard to track metrics such as:

You can create and customize a Sales Overview Dashboard in ClickUp to help your sales team track the key metrics of your business.
For example, you could use different widgets to to create a visual representation of:
Tracking these critical metrics helps sales managers stay on top of sales numbers, take data-driven decisions, and keep everybody aligned on the way forward.
With ClickUp, each salesperson has their own custom dashboard. They can see so much important information around the progression of their client projects and revenue impact that they couldn’t see before.

Dashboards are not just for tracking team progress. You can also use a KPI dashboard to measure your own performance.
Create your dashboard ClickUp Personal Productivity Dashboard your way—add the widgets and data that are most important to you. For example, a customer support representative may wish to track specific metrics such as:
This is a great way for any individual to see where they spend their time and whether this is in line with their goals. If not, they can quickly course-correct and reprioritize and get back on track.
Implementing a KPI dashboard that tracks key metrics can enhance overall organizational performance. By strategically leveraging KPI dashboards, teams can work smarter, ensuring that every effort contributes directly to the organization’s objectives.
Here are the most significant advantages of utilizing a KPI dashboard effectively:
Organizational and team goals often require coordination across various teams. Without a unified platform for presenting goals and performance metrics, you run the risk of miscommunication and the formation of data silos.
A KPI dashboard clarifies individual and team achievements and progress toward goals in an easily understandable format. This visibility helps your team members see their contributions to the larger organizational goals; this context motivates them and drives performance.
Moreover, many dashboard platforms include collaboration tools, minimizing the need for external productivity applications and simplifying your day-to-day work.
Intelligent dashboard software with real-time task tracking makes those weekly update meetings a thing of the ancient past.
Dashboards like ClickUp’s update in real time to show you the extent of work completed at any moment. No more tracking work across a dozen spreadsheets or waiting on different teams to send you their data so you can compile it into one view!
To make the best use of your data, select a dashboard solution that fits seamlessly into your existing workflow. This could mean choosing a compatible app that integrates with your primary data sources or opting for a comprehensive platform that offers detailed KPI reporting, data visualizations, and automated workflows.
Besides data analysis, KPI dashboards can introduce fun elements into the workflow, engaging your employees through gamification.
A TalentLMS survey indicated that gamification can significantly boost productivity and workplace happiness, with 89% of employees feeling more productive and 88% experiencing increased happiness.
A KPI dashboard can help you set up a rewards system based on achieving specific business milestones and targets. You can also incorporate points systems, leaderboards, and other competitive elements to create healthy competition, as long as it doesn’t undermine collaboration.
KPI dashboards address common teamwork challenges, such as unclear tasks, communication bottlenecks, and a lack of visibility into the broader organizational goals.
By displaying your KPIs alongside related goals, dashboards clarify individual responsibilities, alleviate confusion, and quickly identify inefficiencies. They also ensure transparency and build trust within your organization.
Additionally, when your team members can view each other’s tasks, it encourages knowledge sharing and mutual support, further enhancing teamwork and accountability.
KPIs help teams clarify and focus on their daily, weekly, and monthly targets and performance. They also help individuals see how their effort impacts the team. Conversely, they also highlight initiatives and actions that don’t support company goals and should be deprioritized.
However, KPIs effective for one team or even organization may not suit another. Therefore, we recommend identifying your priorities and selecting appropriate KPIs to measure progress.
Leveraging well-designed KPI software can simplify this process, eliminating much of the guesswork and accelerating progress toward objectives.
ClickUp is one of the most user-friendly and cost-effective solutions for crafting high-quality KPI dashboards. It upgrades your reporting capabilities with real-time data whenever needed, so you can stop chasing after data and get down to strategic work.
Sign up to ClickUp to take the Dashboard for a spin today!

© 2026 ClickUp

There’s an easier way. Try a free AI Agent in ClickUp that actually does the work for you—set up in minutes, save hours every week.