Sorry, there were no results found for “”
Sorry, there were no results found for “”
Sorry, there were no results found for “”
Executives seeking real-time visibility and operational clarity will benefit from ClickUp’s powerful dashboard features. The blog outlines how ClickUp enables leaders to consolidate KPIs, monitor key metrics, and maintain alignment across teams. With customizable views and collaborative updates, ClickUp ensures that executive oversight becomes proactive, not reactive.
An effective executive dashboard is like a control room of your company.
It shows you what’s going on at any given point through actionable data but doesn’t burden you with unnecessary details. You get a clear, visual overview of your company’s financial health, key performance indicators (KPIs), customer relationship management, and other information you need to make big moves with confidence. 💯
The only issue is—creating a high-level dashboard is no easy feat. You need to bring a lot of business systems and critical metrics together, which may seem daunting.
To give you a leg up, we’ll show you what a robust executive dashboard should look like and how to create one from scratch without tedious work.
An executive dashboard is a visual representation of data and KPIs that C-level executives use to track business processes and activities. It pulls information from various sources to provide actionable information on the company’s performance.
Depending on the purpose, the dashboard can be an executive summary of reports and KPIs across several business functions or a high-level overview of a specific sector. Either way, the point is to turn heaps of raw data into a concise, dynamic run-through that will help an executive make fact-based decisions.
In order to fulfill this purpose effectively, an executive dashboard must rely on (near) real time data and preferably update itself without manual work. This allows executives to stay updated on project progress and overall performance at all times. 📈
If you’re a decision-maker, you should implement executive dashboards for five key reasons:
There are several types of executive dashboards catering to different purposes and target users. Let’s go over the most common ones to give you a general idea of what each should include. 📊
Financial dashboards are used by CFOs and shareholders who need a bird’s-eye view of a company’s financial well-being. They typically consolidate reports related to the following:
A crucial aspect of financial dashboards is trend analysis, which uses historical data to identify financial patterns and anomalies (e.g., seasonal revenue drops or cost spikes). These trends are used for financial forecasting and help the business organize its budget more effectively.
Financial dashboards can also be used for risk analysis. For example, you can use cash flow data from the dashboard to mitigate liquidity risks and ensure you don’t run out of accessible funds. 💸
Regular financial reporting is crucial for monitoring a company’s performance, and a dashboard helps you stay on top of key metrics without digging through individual reports. It lets you stay on budget and avoid unnecessary cost overruns.
A strategic dashboard offers valuable insight into your company’s performance according to its long-term objectives. It can encompass various KPIs, from your market share and ROI on major projects to employee engagement and satisfaction. The specifics depend on your company’s goals, so no two dashboards are identical.
Strategic dashboards can be used for several purposes, most notably:
You can also use a strategic dashboard for comparative analysis by weighing your performance against a competitor’s. This will give you a better idea of your market position and help you determine the path forward. ↗️
Unlike a strategic dashboard, an operational dashboard is granular and focuses on day-to-day activities. Besides giving the COO a deeper insight into specific functions and processes, it helps managers and team leaders combat inefficiencies and optimize workflows.
The most important aspect of an operational dashboard is real-time data, as it enables swift problem-solving. The dashboard tracks lots of essential metrics, such as:
If built well, operational dashboards are highly dynamic and interactive, allowing you to track your key processes ongoingly and identify bottlenecks. You can use the provided data to turn your company into a well-oiled machine and ensure everything moves smoothly. 🏭
A project management dashboard is often used to track the company’s entire portfolio of projects. However, it can also be used for individual projects that require special attention or extensive resources.
The dashboard should include critical information about a project, such as:
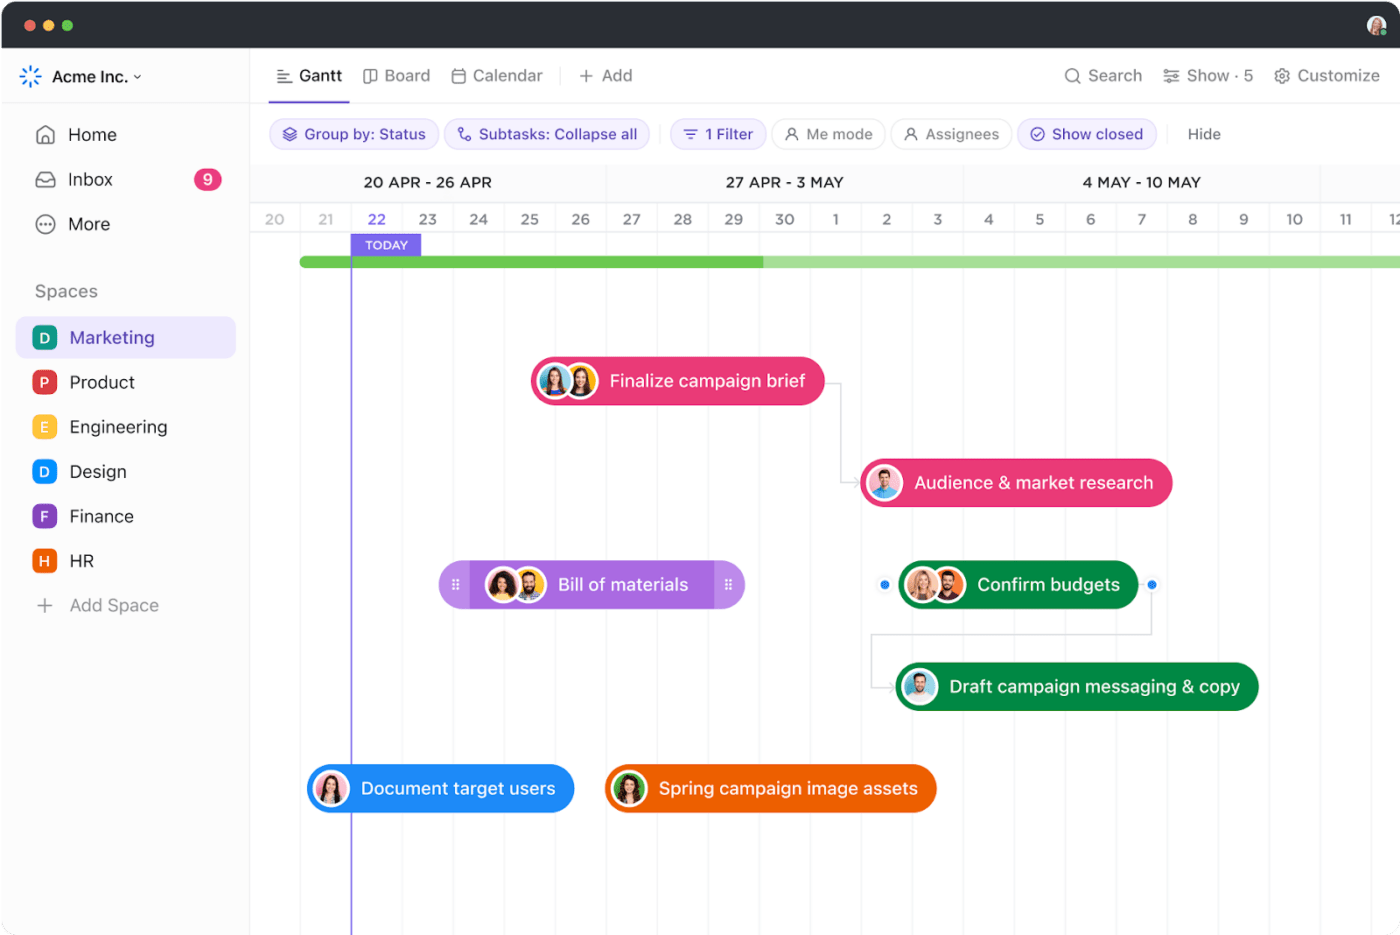
Many project management dashboards use Gantt charts to present in-depth timelines that let decision-makers track progress and make adjustments if necessary. These dashboards are particularly useful for communicating with project stakeholders and keeping them in the loop on the latest updates.❗
CMOs need to make lots of decisions quickly to stay on top of new trends and execute effective marketing strategies. That’s why a comprehensive marketing dashboard is essential to maintaining your business’s competitive edge.
The dashboard should provide an overview of the company’s key marketing channels (paid ads, social media, traditional channels, etc.) to let you quickly assess their effectiveness. You can use this data to decide what works best to double down on it and prune the less effective tactics.
A marketing dashboard also houses important information on your target audience, which lets you personalize your marketing efforts to boost their effectiveness. 🎯
The most notable KPIs commonly found in marketing dashboards include:
Once you’ve chosen the executive dashboard you want to make, follow these steps to build it from the ground up:
Your chosen dashboard software needs to check lots of boxes, most notably:
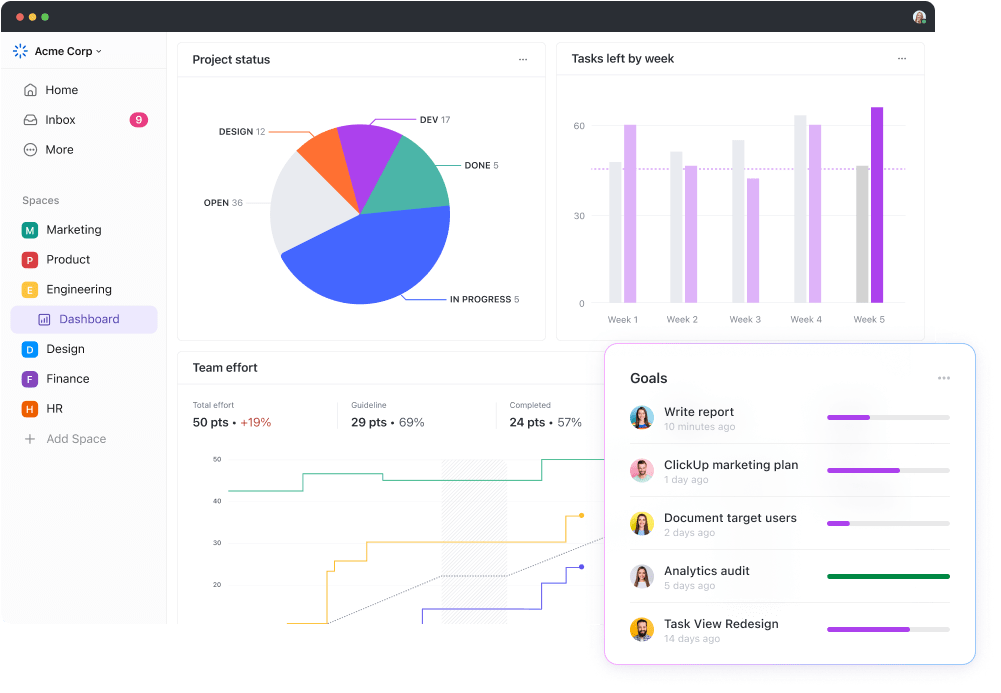
If you need a visual project management platform that covers all of this and much more, ClickUp can be an excellent option. With ClickUp Dashboards, you can visualize key metrics and analyze data to make decisions more effortlessly.
You get over 50 widgets you can customize to your liking, which ensures complete flexibility. The platform also offers various data visualization options, from simple pie charts and progress roll-ups to comprehensive Gantt charts for tracking project timelines.
You can set up a dynamic dashboard that will evolve along with your data by connecting it to numerous data sources (which we’ll cover in more detail a bit later in this guide). Thanks to ClickUp’s intuitive interface, you can build an elaborate overview of all your key metrics effortlessly.
ClickUp comes with numerous built-in dashboard templates you can use to reduce manual work, such as:
Each executive dashboard template can be adapted to your workflow, data sources, and other specifics so that you can tweak everything down to the smallest details. 🔧
Defining your goal(s) is a vital step to creating your dashboard, as it will determine everything that it will show, including your KPIs, projects and tasks, and so on. 🗓️
Within each executive dashboard type, there are various specific goals you can set. For example, if you’re creating a strategic dashboard, some of the main goals can include:
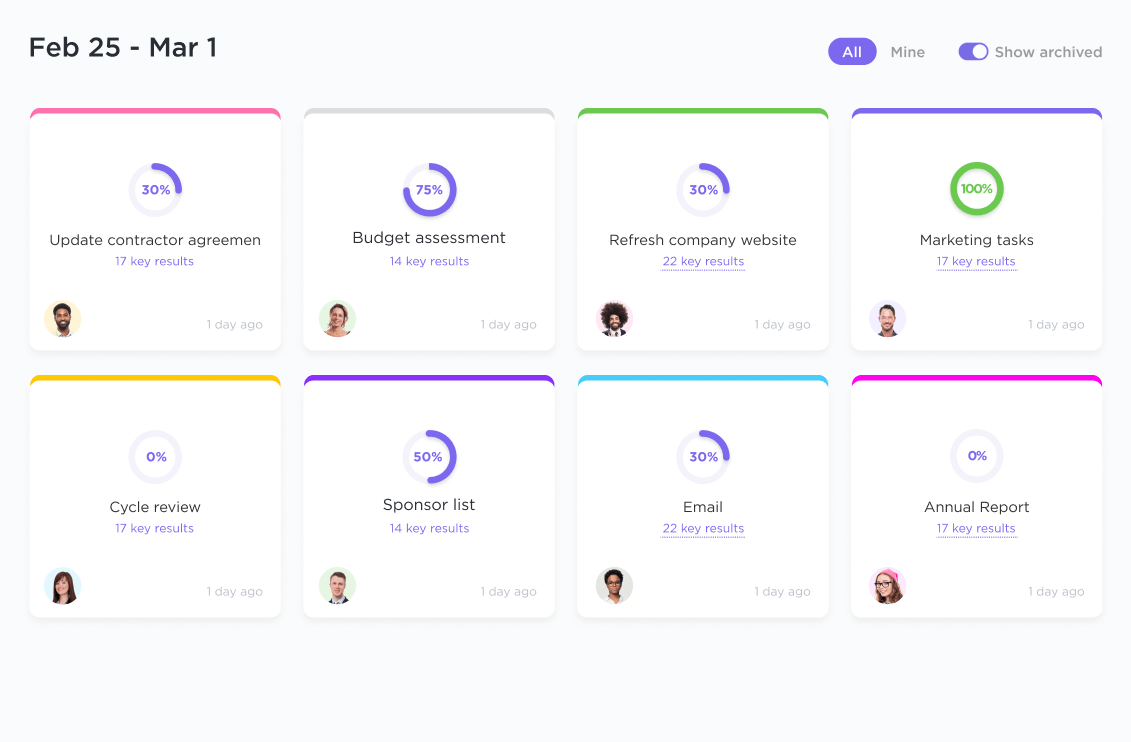
Whichever goal you set, ClickUp Goals can help you track it effortlessly. There are various graphs and charts to choose from depending on your goal (monetary targets, progress roll-ups, percentages, etc.).
You can also set deadlines for goals and related tasks to define a clear timeline. Share the goals with everyone involved to keep them on the same page, and you’ll foster transparency and accountability.
Another important consideration is the dashboard’s user group, which may not be as obvious as it seems at first glance. For instance, creating a marketing dashboard doesn’t necessarily mean the CMO will be the only user. The CFO might also want access to it, as it lets them make important decisions about budget allocation. 💰
In this case, the dashboard should contain financial data like the ROI on specific campaigns and cost breakdowns. Consider all the executives who may benefit from the dashboard and ensure they all get relevant data.
The most important data you’ll see on an executive dashboard relates to your KPIs. You’ll track them to ensure you’re moving towards the chosen goal and take corrective action if needed.
Your dashboard should include both the KPIs you’re trying to improve and those you’re overseeing for maintenance. The specific metrics depend on your goal, so focus on the most impactful ones.
If we go back to the market share example, some KPIs you can track include:
It might be a good idea to consult your teams and other stakeholders when deciding on the KPIs you’ll track, as they might give you valuable insight you couldn’t get otherwise. 🤓
When choosing your KPIs, remember that you’re creating a high-view dashboard. There’s no room for vanity metrics and granular KPIs that don’t directly impact executive decisions.
For example, the number of annual sales is a high-level KPI that can branch into many low-level KPIs (website traffic and conversions, average conversion time, quote-to-close ratio, etc.). Instead of including all those low-level indicators, focus on the big picture and let the head of the corresponding department go into more detail.
There’s not much point in having a dashboard that doesn’t sync either frequently or in real time, depending on your goals and KPIs. To ensure there’s no manual data entry that can lead to costly errors, you should integrate the dashboard with different data sources and platforms your teams use.
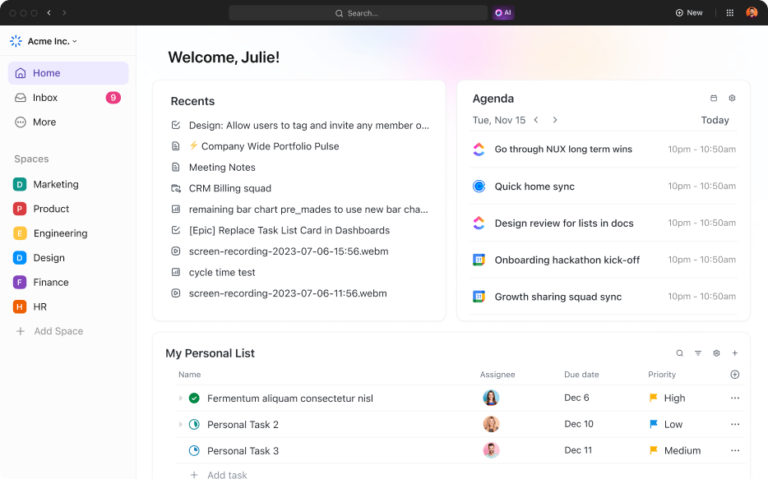
If you create a dashboard with ClickUp, you can develop a cohesive ecosystem without hassle or complex technical processes. For example, you can delegate work using ClickUp Tasks and enrich your dashboard with widgets that pull all the necessary project data in real time. 🕛
ClickUp also offers over 1,000 integrations with third-party apps so that you can connect numerous apps to it at no cost! This makes the platform highly adaptable to various workflows, allowing you to create high-level and granular dashboards in no time.
If you don’t find your current platforms among ClickUp’s native integrations, you can use the ClickUp API to create custom ones.
With all of the above in mind, ClickUp offers complete freedom to create robust, dynamic dashboards that minimize manual work and tell your company’s story in as much or as little detail as you want. If you need some inspiration, you can check out these ClickUp dashboard examples.
Once your dashboard is up and running, ask its users for feedback so that you can tweak the design, data relevance, and overall functionality if necessary. It’s best to have a continuous feedback loop so that the dashboard presents your company’s standing with pinpoint accuracy. 📍
You should also update the dashboard if the circumstances of your business change. Maybe you’re launching a new product, restructuring some departments, or making other major changes that can cause a significant ripple effect throughout your organization. In this case, make sure that the dashboard reflects these changes so that you can track their impact.
It might be a good idea to review the dashboard with managers and employees of different levels to get holistic feedback on its effectiveness. Include all relevant parties in the process, and your dashboard will support your company’s evolution.
A well-made dashboard can make life significantly easier for your executive team. Follow the above steps to build one, and you’ll save yourself many headaches while making important decisions. You’ll also stay in complete control over every important thing happening in your business, which brings clarity and peace of mind.
ClickUp can help you reap these benefits without breaking the bank or requiring an entire team of tech experts. All of its key features are laid out intuitively, and you’ll get valuable tips for getting the most out of them. To create a robust executive dashboard effortlessly, create a ClickUp account today!

Sudarshan Somanathan
Max 25min read

Manasi Nair
Max 25min read
Manasi Nair
Max 12min read

© 2026 ClickUp