
Whether you manage day-to-day tasks or agile projects, you have to monitor their performance to ensure everything goes according to plan.
Fortunately, with the right dashboard software, you can identify trends, detect bottlenecks, and make predictions based on data without spending a fortune.
In this article, we’ll cover what dashboard software is and highlight ten dashboard tools that’ll make managing your projects a breeze.
What Is Dashboard Software?
Dashboard software provides teams and agent handlers with essential business information, compressing big data into smaller and easier-to-understand information.
Your agents can use this new information to complete missions without any slip-ups.
Since a BI dashboard (business intelligence dashboard) displays up-to-date information and trends, business users can use the data to monitor and measure performance and make informed business decisions.
How?
For example, managers can use a project dashboard to monitor business health and identify areas that harm their growth. You won’t have to bring in a data scientist for the job. ?
Operational teams can use operational dashboards to respond to bottlenecks before they disrupt productivity.
Similarly, financial teams can use the data to predict sales and revenue.
And, of course, spy agencies can use the data to keep track of all their assignments!
What to Look for in a Dashboard Tool?
- Data blending: combine data from multiple data sources to see the most crucial info. For example, the progress you’ve made towards achieving your key performance indicators (KPI)
- Data drill-downs: go from a high-level overview to a more detailed view of that data using charts and other visuals
- Customizations: make your dashboard your own by using tons of fonts, colors, backgrounds, widgets, and more ?
- Collaboration tools: work together on dashboards by commenting and sharing data with teammates and clients
- Mobile availability: monitor your performance and be up to date with your data on the go
- Data security: lock your business information by using role-based permissions, password protection, and two-factor authentication
Remember, having a well-rounded dashboard tool means that you’ll get well-rounded, actionable insights!
Top 10 Dashboard Software
Here are ten dashboard software that’ll help you collect data and analyze it like a secret agent:
1. ClickUp
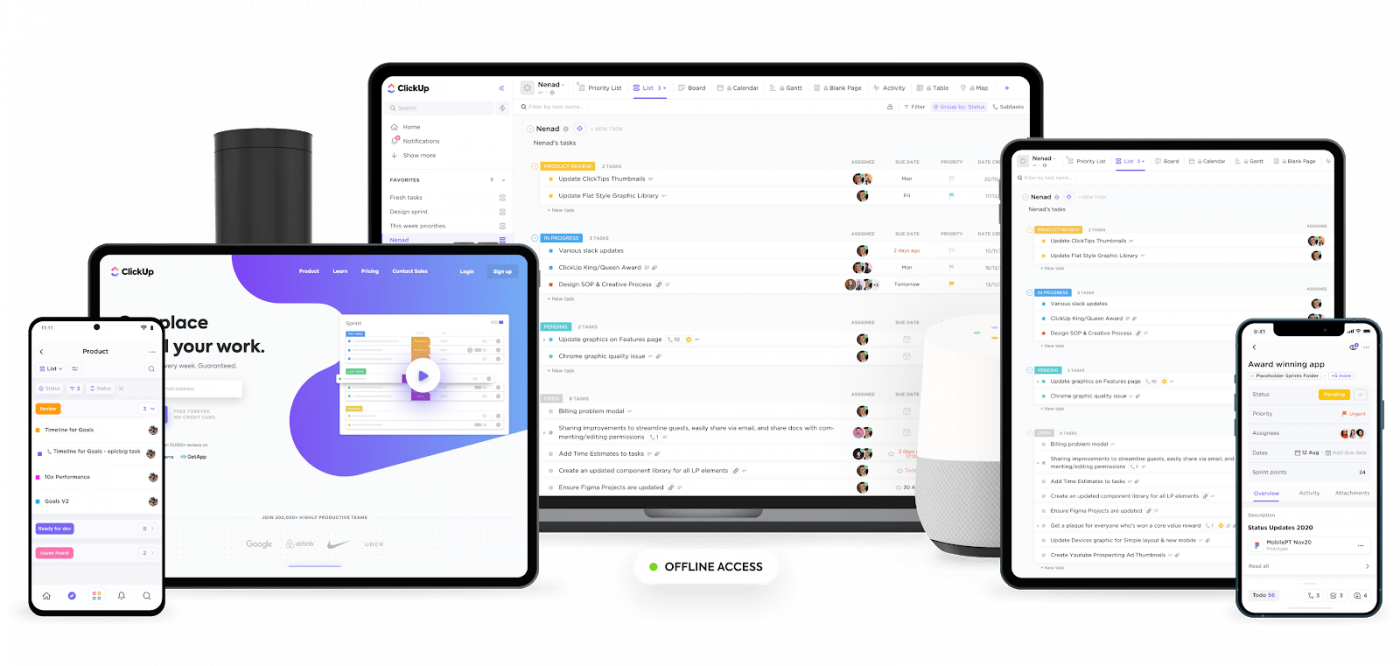
ClickUp is the world’s highest-rated productivity and project management software used by super-productive teams in small and large companies.
It’s also the best dashboard software in 2024 and lets you build Dashboards for any business scenario.
With 50+ Widget customizations to help you get insights into the most critical business analytics, you can monitor the performance of any business process with ease.
From resource management to client reporting, these Dashboards have got you covered.

You can use ClickUp Dashboards to help you assess your quarterly goals, see the time tracked on projects, spot potential bottlenecks, and more. ?
Dashboards in ClickUp also help you understand your KPIs and business metrics better.
How?
A KPI Dashboard breaks down complex data into simple graphs and charts. This way, Dashboards make data analysis more accessible to you and your agents.
ClickUp also lets you customize your Dashboard with custom charts like:
- Line chart: create a custom line chart to identify trends in your intel
- Bar chart: use bar charts to see changes in crime rates over time
- Pie chart: use a custom pie chart to map out your intelligence agency’s expenses
ClickUp lets you secure your Dashboards by setting permissions.
By default, Dashboards are classified (private) and only visible to you. But you can share them with anyone on your team or opt to display your Dashboard at the office in full-screen mode!
Other key ClickUp features
- Views: view your business performance in Workload, Box, Board, and Gantt view
- Task statuses: add different stages to your work for accurate progress tracking
- Assign tasks: assign tasks to teammates to track your team’s workload
- Native time tracking: start and stop time from any device and generate reports from all your time entries, including billable hours
- ClickUp Goals: set a KPI for your team and track progress towards your business metrics
- Automations: use pre-built automation or customize them based on your needs, so your team can focus on the important stuff
- Custom Notifications: choose how and when you’re notified about ClickUp tasks and projects
- Calculation Widget: need to do some calculations? Don’t worry, you can ac-count on us! Get all the numerical data that your finance team needs with this Widget
- Table Widgets: see how your team is performing, who’s completed the most tasks, and who’s falling behind
- Templates: Use ClickUp’s Project Management Dashboard Template for your next project
ClickUp pros
- Powerful free version with unlimited users
- Easy-to-use user interface with online and offline mode
- Create roadmaps and outline processes for new teammates using Docs
- Collaboration detection informs you when a teammate is viewing or editing the same Doc as you in real-time
- Task Dependencies to help teams complete tasks in the correct order
- Integrates with several third-party software like Slack, Google Drive, Zoom, and more
- Add and manage tasks using our powerful iOS and Android mobile apps
- Supports Apple, Windows, and Linux platforms
ClickUp limitations
- No Timeline view in the mobile app (yet)
Take a look at ClickUp’s roadmap to see how we’re fixing such minor drawbacks.
ClickUp pricing
- Free Forever
- Unlimited: $7/month per user
- Business: $12/month per user
- Business Plus: $19/month per user
- Enterprise: Contact for pricing
ClickUp user ratings
- G2: 4.7/5 (2000+ reviews)
- Capterra: 4.7/5 (2000+ reviews)
2. Klipfolio
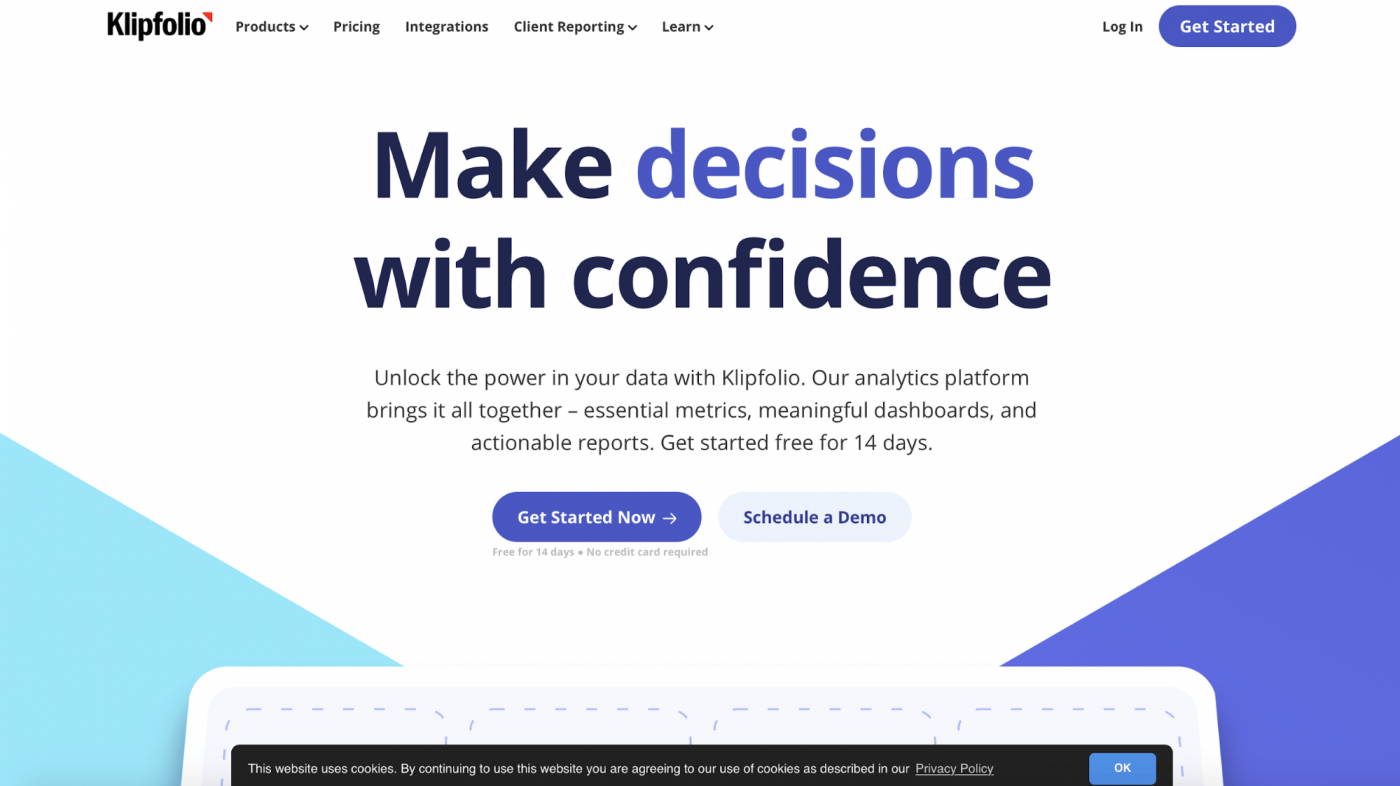
Klipfolio is a data analytics platform with a gallery of dashboard templates. You can also show off your technical skills by using its formulas, data modeling, and machine learning functionalities.
Unfortunately, Klipfolio’s basic plan only offers a data refresh rate of one hour, leaving your team feeling like this:
Klipfolio key features
- Build custom dashboards for client and team reporting
- Pre-built dashboards for content effectiveness, social media performance, and more
- Supports dashboard themes, pre-built data visualization tools, and more
- Automate data analytics to save time
Klipfolio pros
- Can track data over time to identify historical data trends with ease
- Robust data filtering options to help you view the data you want
- Integrates with popular tools like Basecamp 3, Asana, and more
Klipfolio limitations
- The free plan has a limit of 10 dashboards
- Charts can be challenging to create and sometimes require programming skills
- Can’t display timeline data in a quarterly increment
Klipfolio pricing
Klipfolio has four pricing plans for businesses. Plans start at $99/month.
Klipfolio user ratings
- G2: 4.6/5 (100+ reviews)
- Capterra: 4.7/5 (100+ reviews)
3. TruOI
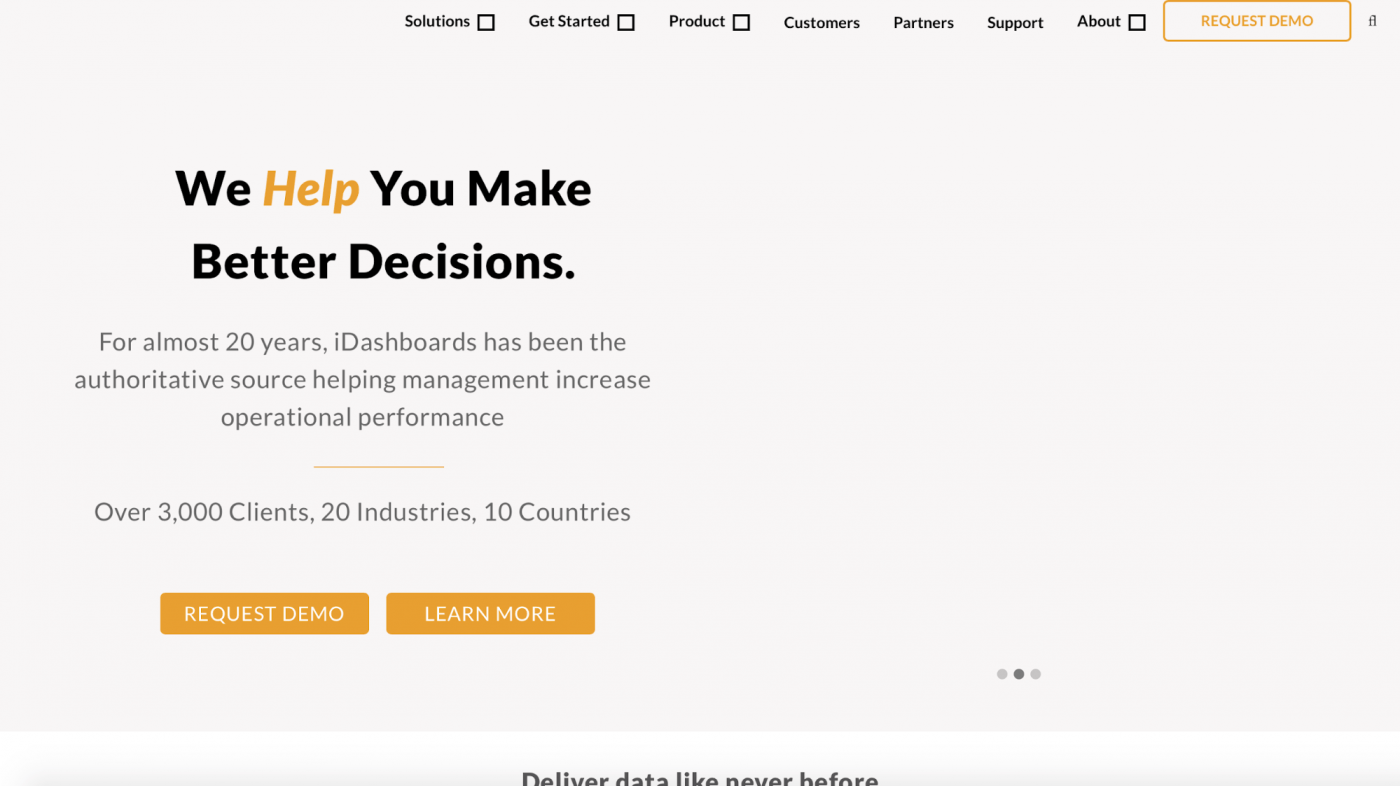
TruOI, formerly iDashboards is a data visualization tool that lets you create operational dashboards. The app enables you to combine data from popular sources like Airtable, Google Search, Instagram, and more.
However, essential features like the public access license are only available as premium add-ons.
So here’s how frustrated your team will be when trying to share dashboards with clients:
iDashboards key features
- Custom dashboards with drag-and-drop functionality
- Supports several chart and graph templates
- Drilldowns let you switch from an overview of your data to the granular details
- Role-based permissions control which individuals and groups can access, edit or view dashboards
iDashboards pros
- Can create healthcare, human resources, or marketing dashboard
- Available on a mobile device (iOS and Android)
- Add colors, backgrounds, alerts, and more to your charts and dashboards
iDashboards limitations
- The form builder is only available as a premium add-on
- Configuring the charts require some coding experience
- Lacks task management features like assigning tasks and task priorities
iDashboards pricing
iDashboards has both a cloud and on-premises option. For pricing, request a custom quote from iDashboards.
iDashboards user ratings
- G2: 4.5/5 (60+ reviews)
- Capterra: 4.6/5 (20+ reviews)
4. Zoho Analytics
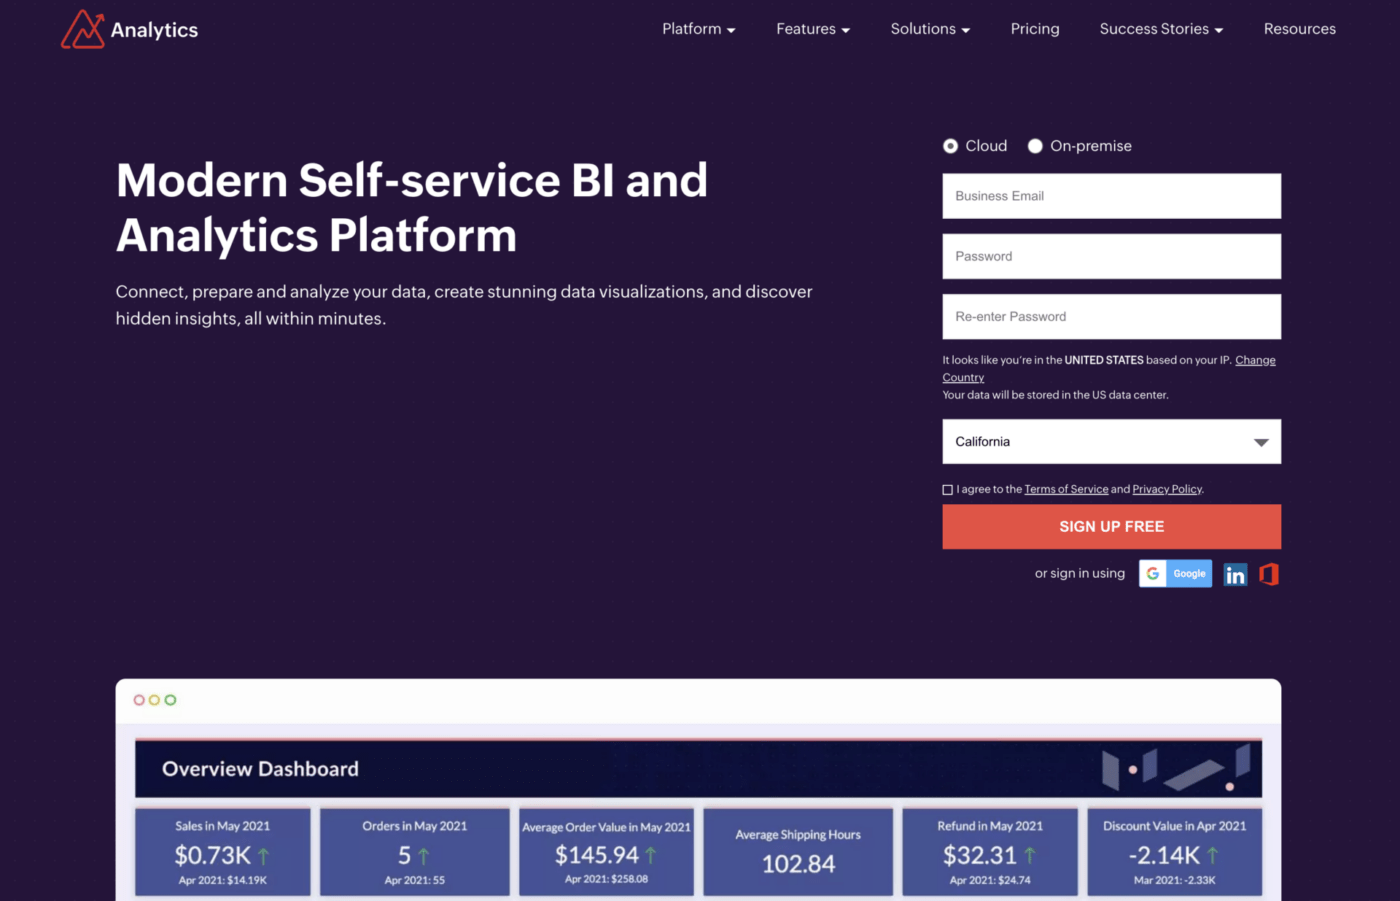
Zoho Analytics is a business intelligence and analytics tool. This dashboard application has a cool, intelligent assistant called Zia. Ask her questions, and you’ll get answers in the form of a report. ?
However, some of the app’s advanced reporting features require technical skills.
And no, Zia can’t help you there.
Zoho Analytics key features
- Customize your business dashboard with charts, widgets, pivot tables, and tabular views
- Data alerts notify you when there are spikes or other changes in your data
- Compare and analyze key metrics across countries with map charts
- Import data from cloud databases with ease
Zoho Analytics pros
- Supports analytics for your sales, finance, and marketing functions
- Can add real-time comments to shared views like summary view, pivot view, dashboards, and more
- Integrates with Salesforce CRM, Google Analytics, Quickbooks, and more
Zoho Analytics limitations
- Only supports a limited number of graphs that you can add to your reports
- The free plan has a limit of two users
- Essential data management features like data backup and data screenshots are only available in the standard plan
Zoho Analytics pricing
Zoho Analytics has four pricing plans. Paid plans start at $24/month.
Zoho Analytics user ratings
- G2: 4.2/5 (100+ reviews)
- Capterra: 4.3/5 (200+ reviews)
5. DashThis
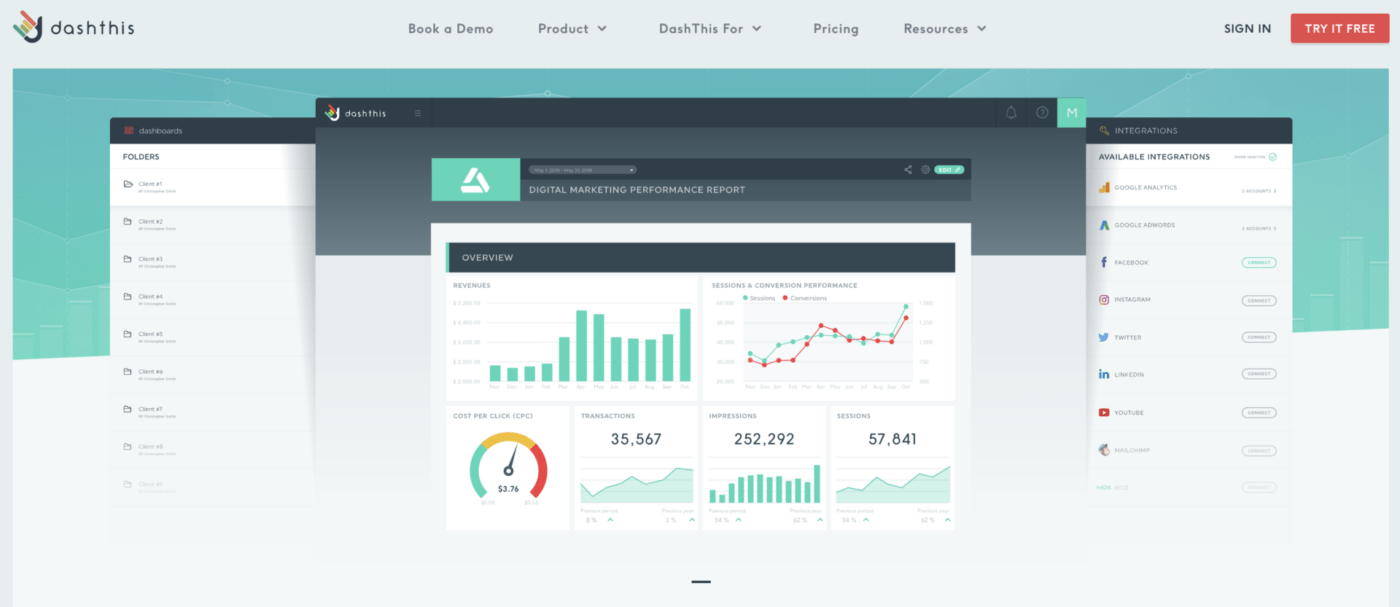
DashThis is a tool for consolidating & sharing marketing data all in one place. You can connect all marketing tools that you use across channels like SEO, PPC, social media & email to centralize your reports.
Using their drag-and-drop dashboard builder, you can pull in the KPIs & metrics that your team wants to see, & use reporting templates to speed things up.
DashThis key features
- Connects with 36+ marketing tools
- Generate shareable URLs for dashboards
- Reporting templates for different channels, industries, & use cases
- Unlimited data sources and users on all plans
DashThis pros
- Intuitive drag-and-drop UI is very easy to use
- Covers marketing data for several channels, including SEO, PPC, social media & more
- Integrates with popular tools like Google Analytics, Search Console, Semrush, Facebook Ads, Mailchimp & more
DashThis limitations
- May not integrate with less popular tools
- Minimum of 3 dashboards may not be ideal for solo users
- No free version
DashThis pricing
DashThis has four pricing plans for businesses. Individual plans start at $33/month.
DashThis user ratings
- G2: 4.9/5 (60+ reviews)
- Capterra: 4.5/5 (20+ reviews)
6. Smartsheet
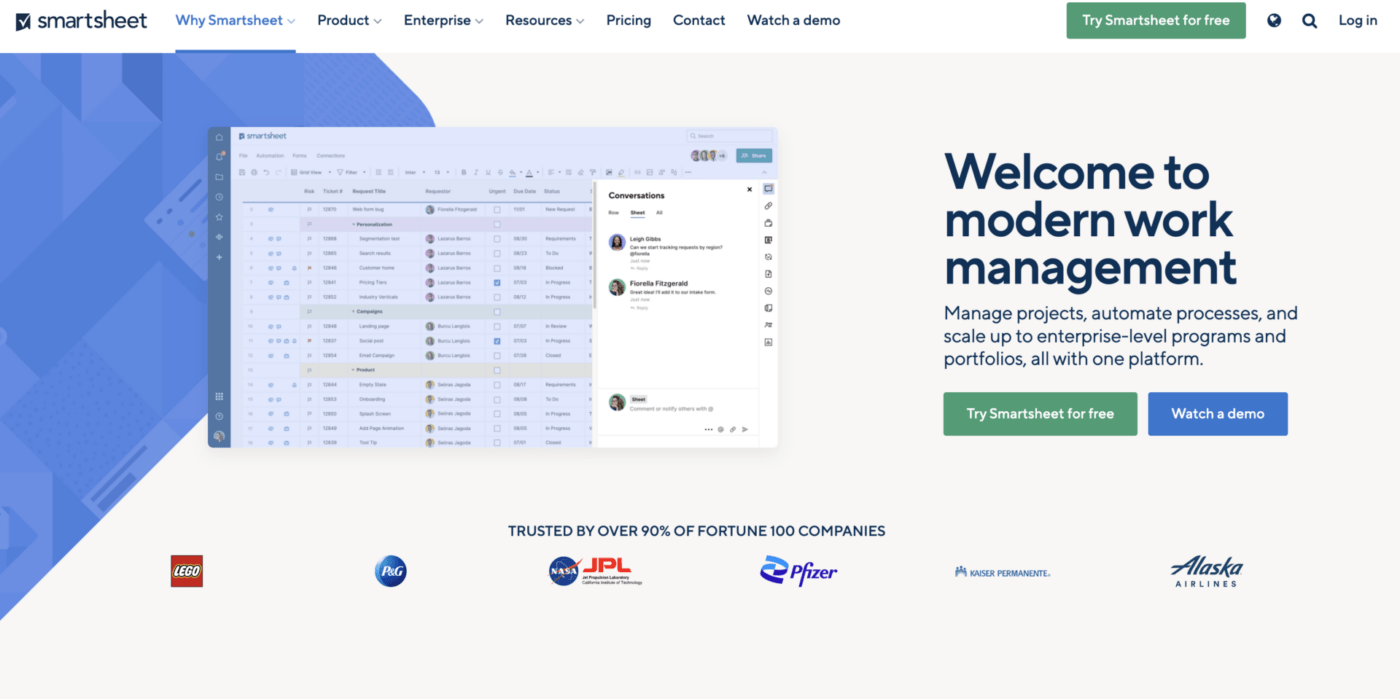
Smartsheet is a data visualization tool with dashboards, automation, collaboration tools, and more.
And while this dashboard creation tool looks like Excel, some of Excel’s most popular formulas don’t work in Smartsheet.
So how Excel-lent is this data visualization tool?
Let’s be smart and find out ?:
Smartsheet key features
- Create dashboards that show live data from your sheets and reports
- Customize dashboards with custom colors and backgrounds
- View your work the way you want to with multiple project views, including grid, card, Gantt, and calendar views
- Share, send, and publish reports to keep teams in the loop
Smartsheet pros
- View new data when you want by choosing how often you want your dashboards to refresh
- View and update data on the go with your iOS or Android device and tablet
- Supports project management features like document collaboration and activity logs
Smartsheet limitations
- No user management controls are available in the base plan
- No auto-save function
- Outdated UI
Smartsheet pricing
Smartsheet has two pricing plans. The Business plan starts at $25/month.
Smartsheet user ratings
- G2: 4.3/5 (2,000+ reviews)
- Capterra: 4.4/5 (1,000+ reviews)
Check out these top Smartsheet alternatives.
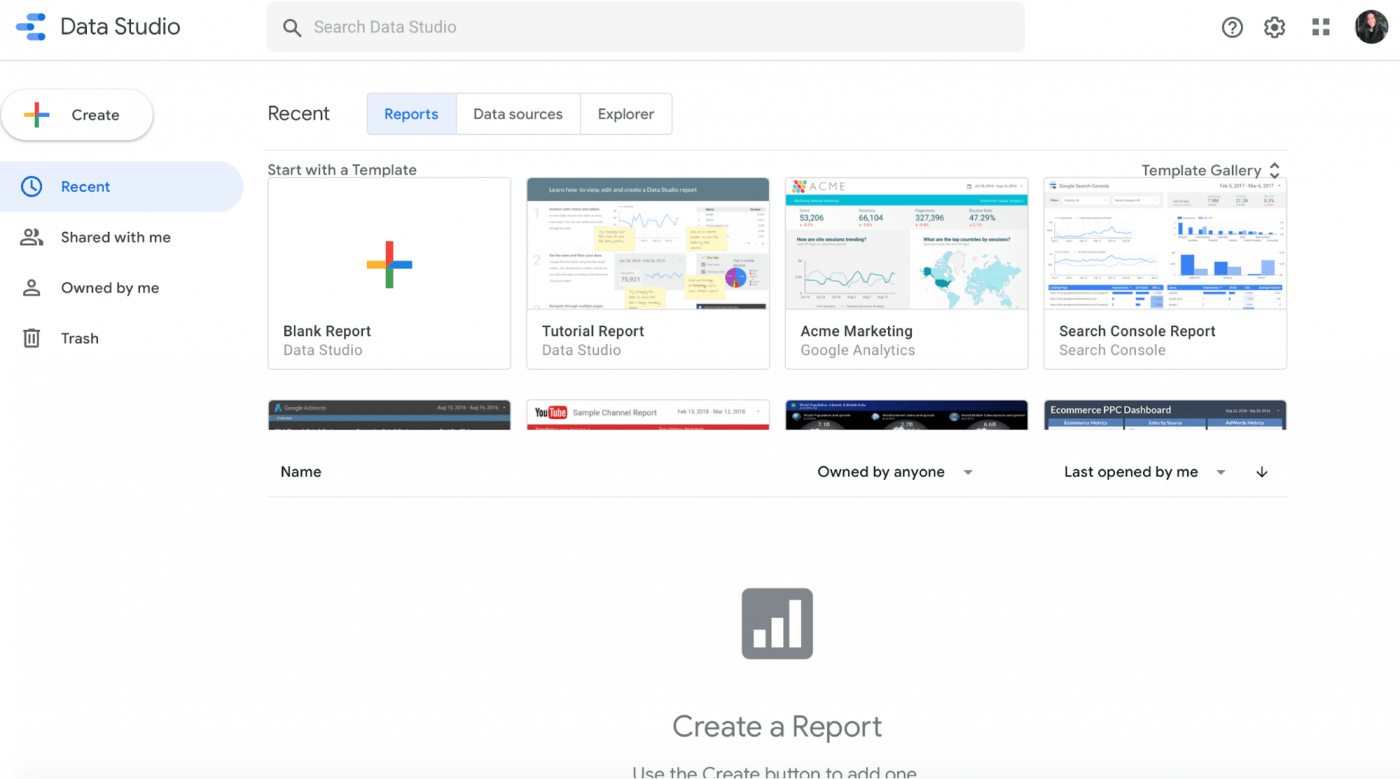
7. Google Data Studio (Looker Studio)
Looker Studio, formerly Google Data Studio lets you create custom analytic dashboards. You can work on a single report with teammates or people outside your company in real time.
However, the app lacks advanced dashboard reporting features needed for complex analytics. For example, there’s no built-in feature to keep a dashboard or report view auto-refreshed.
Guess you’ll just have to refresh things manually:
Google Data Studio key features
- Templates for YouTube channel reports, Google Ads overview, and more
- Turns your data’s dimensions and metrics into powerful building blocks for charts and graphs
- Share and collaborate on all your Data Studio reports and dashboards
- Customizable dashboards that let you add logos, icons, change the background, and more
Google Data Studio pros
- Easy to use
- Perform calculations where formulas can include fields from the data source, literal text, and numeric values
- Supports bar charts, pie charts, tables, heat maps, and more
Google Data Studio limitations
- Relies on integrations for time tracking
- Not suitable for complex task management
- Need paid connectors to pull in non-Google data sources
Google Data Studio pricing
Google Data Studio is completely free.
Google Data Studio user ratings
- G2: 4.3/5 (200+ reviews)
- Capterra: 4.4/5 (90+ reviews)
Domo
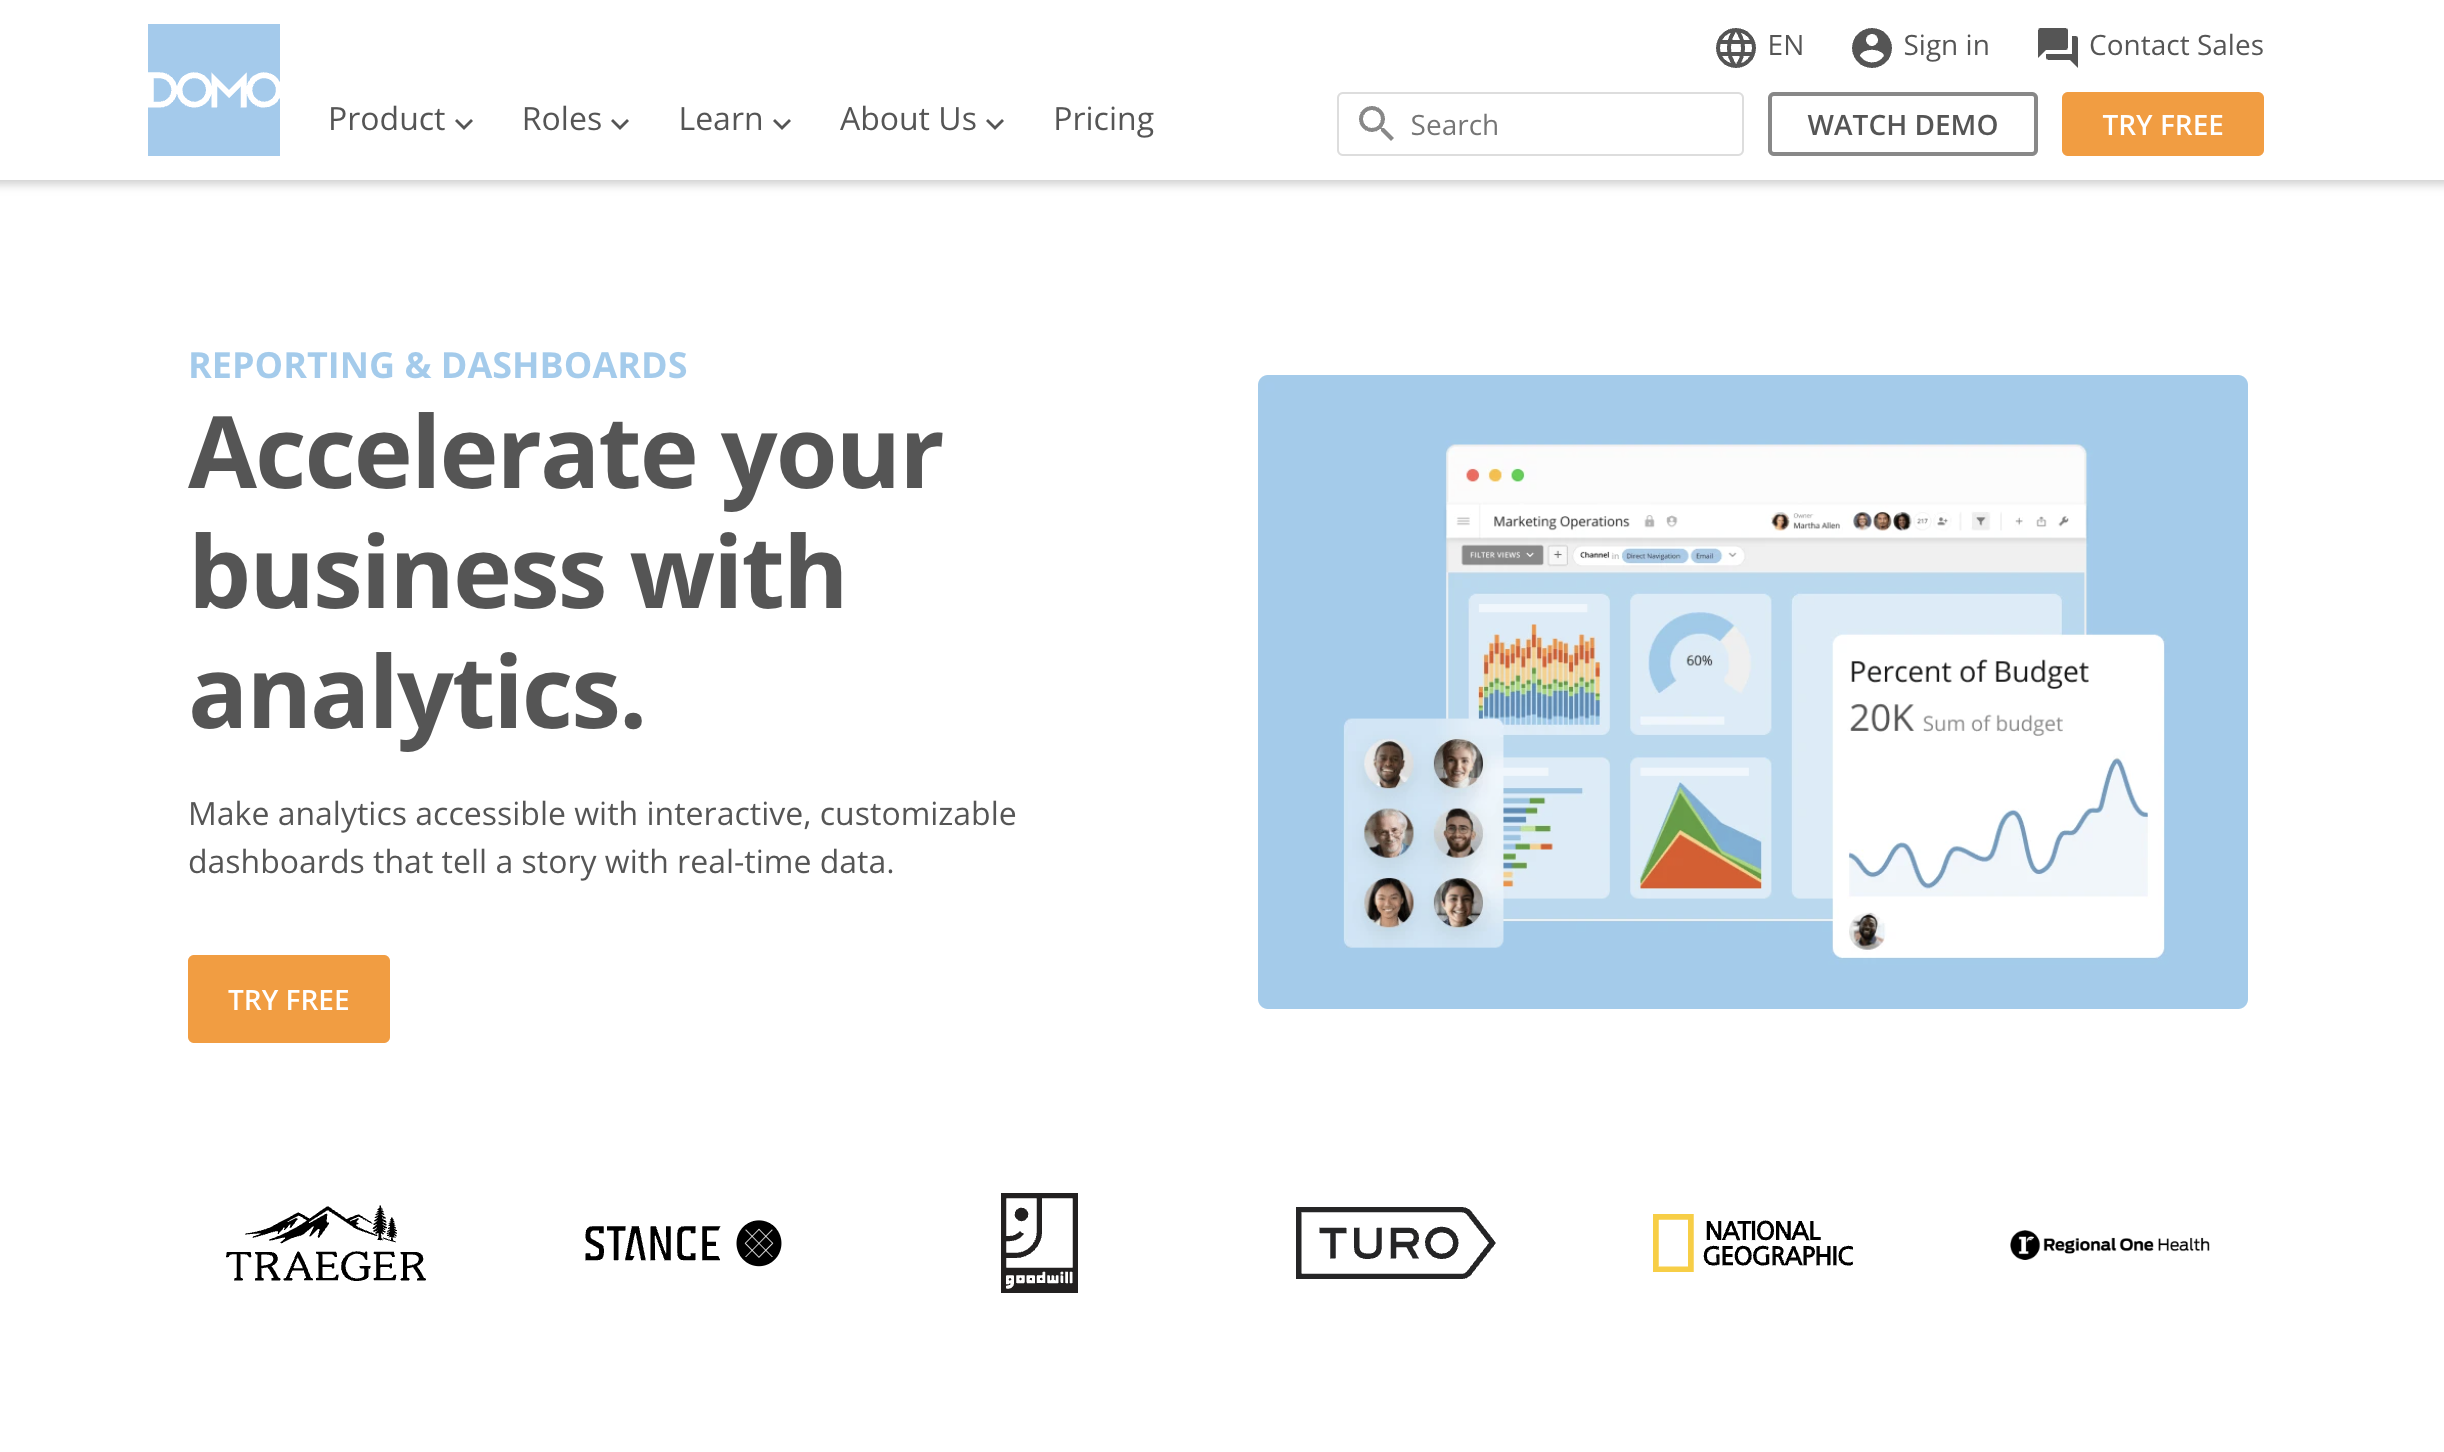
Next on the list is Domo. This app is a low-code data platform that lets users integrate data from anywhere and create personalized dashboards. Domo simplifies the reporting process by connecting your data together and giving you access to real-time insights, all in a simple interface.
Domo key features
- Integrates with over 1,000 pre-built connectors and offers hundreds of other ways to connect to your data
- Choose from over 150 chart types for data visualizations
- Use the drag-and-drop interface to easily create a custom dashboard
- Explore 7,000+ custom maps or upload your own maps in a few clicks
Domo pros
- Real-time reporting
- Available in the mobile app
- Drill down paths allow users to dive deeper when dealing with complex, hierarchical data
Domo limitations
- The user interface could be improved; navigating the software can be confusing for some users
- Pricing plans are expensive
Domo pricing
- Domo offers a free trial. For paid plans, visit the website to get a quote
Yellowfin
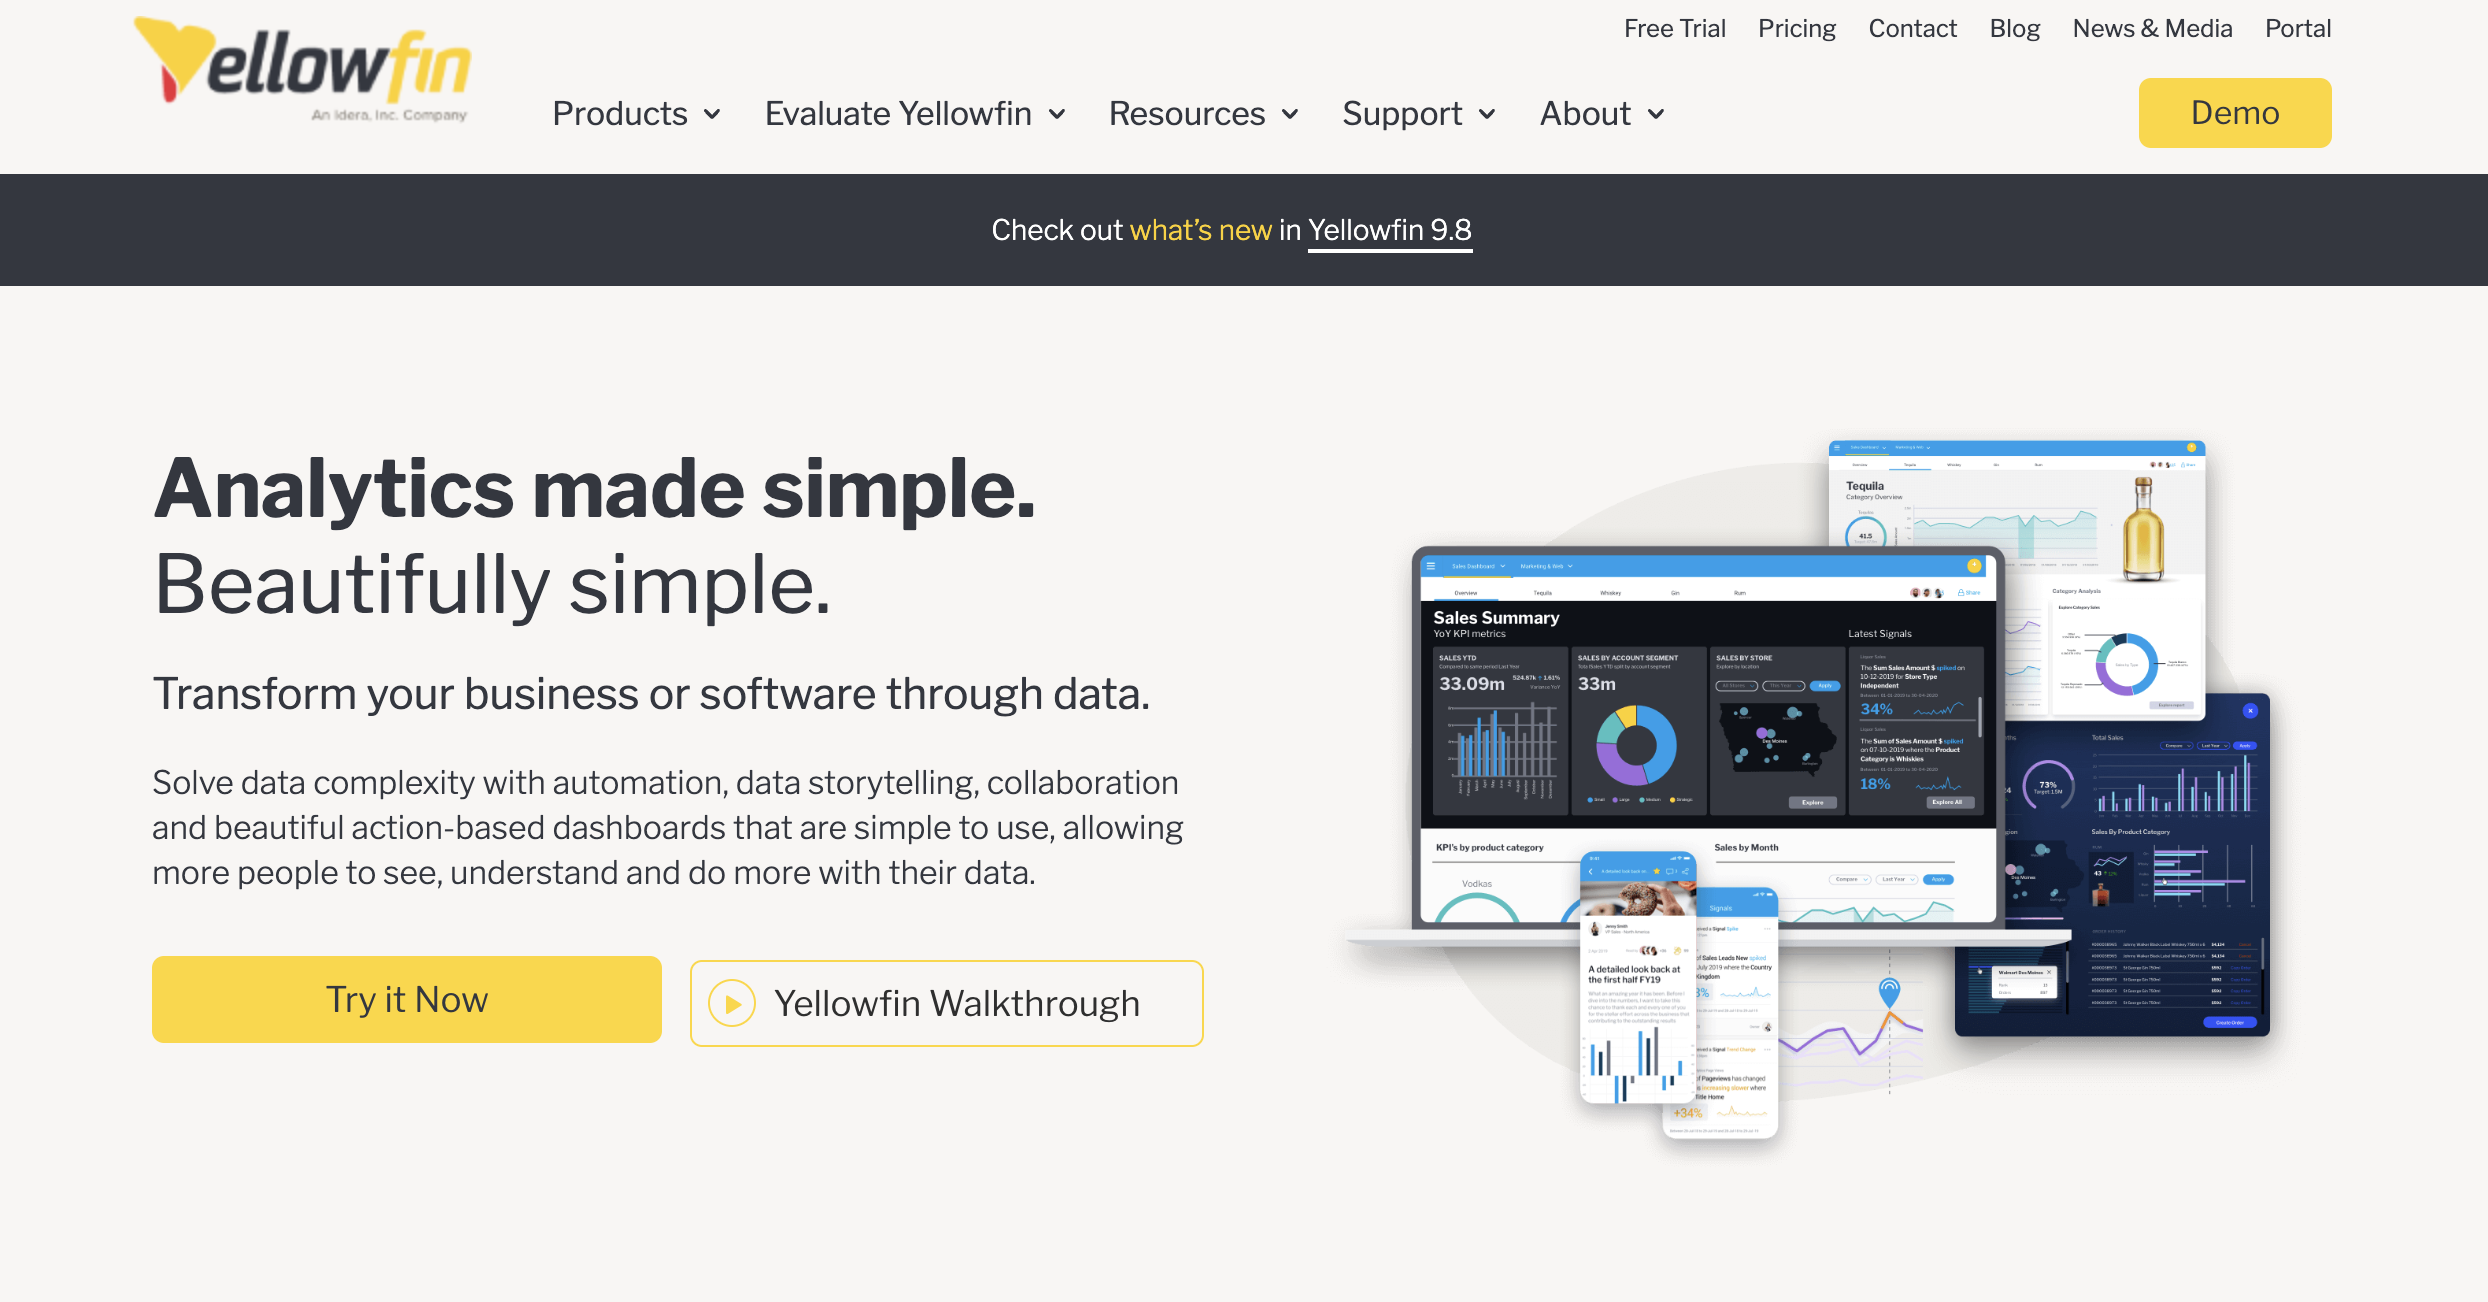
Yellowfin is another Business Intelligence (BI) tool that lets users communicate and track Key Performance Indicators (KPIs) and bring multiple visualization and tables from various data sources together to create a high-level overview of their business performance. This tool offers pre-built dashboards and user-friendly service reporting features to help businesses easily add analytics to their products.
Yellowfin key features
- Automated analysis automatically analyzes your customers’ data and notifies them about changes
- Data stories and presentations allow you to combine charts and tables with narrative in easy-to-consume formats your end users
- Communicate data effectively with custom JavaScript visualizations
Yellowfin pros
- Plug-in dashboards allow you to deliver integrated pre-built dashboards into your application
- Self Service BI enables customers to create their own ad-hoc reports
- Use Yellowfin’s simple API to add reports, charts, and dashboards to your software with minimal code
Yellowfin limitations
- Steep learning curve for those who are not familiar with SQL
- Building and editing dashboards can be complicated for some users
- Plans can be costly
Yellowfin pricing
- Contact Yellowfin to request a quote for Enterprise Analytics and Embedded Analytics
DataBox
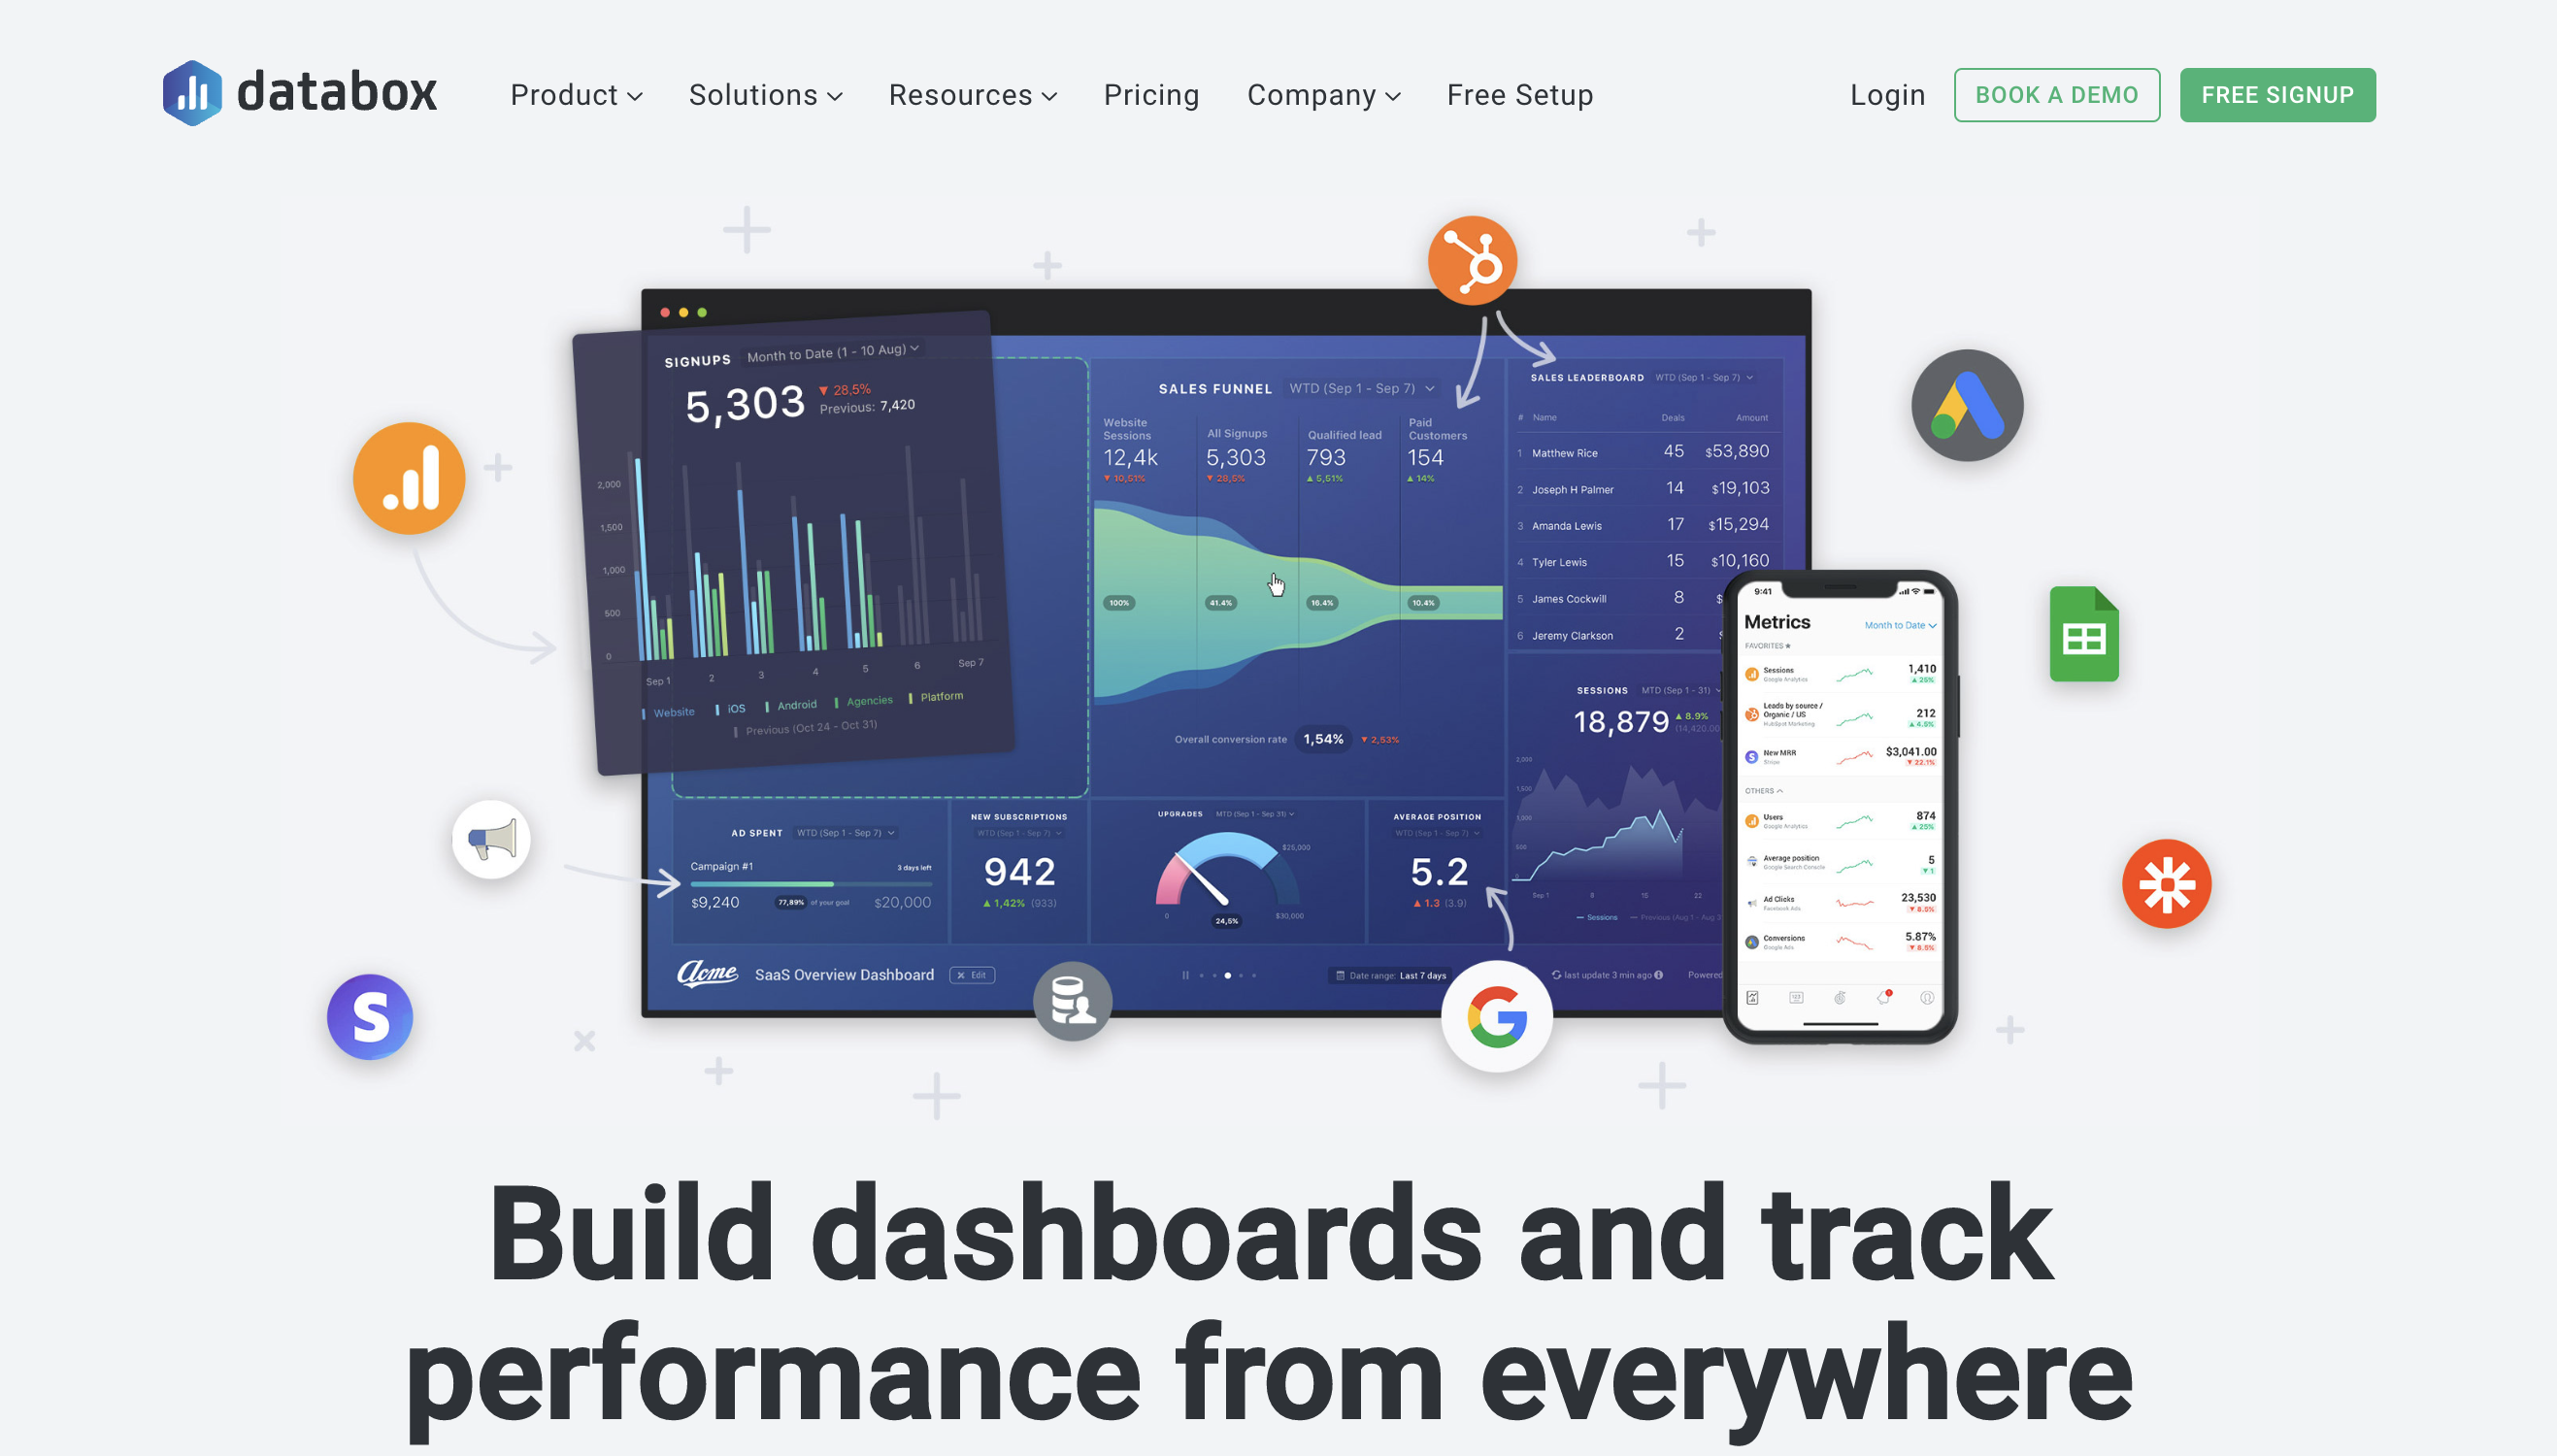
DataBox is a business analytics platform that allows users to create KPI dashboards and connect all of their performance data in one place. It offers features for reports, metric tracking, business goal tracking, TV dashboards, data calculations, and more to help you easily connect your data, build and share reports, monitor trends, and discover insights all within DataBox.
DataBox key features
- Build meaningful and custom dashboards with the Dashboard Designer
- Use the Dashboard Reports Editor to create quick and customized deck-like reports
- Stay up to date with your data by using Data Story slides
DataBox pros
- DataBox offers 75+ native integrations to help you connect and consolidate all your data in one place
- Browse over 200 pre-built reports and dashboard examples created by experts and agency partners
- The drag-and-drop formula builder makes it easy to calculate new metrics from any data source
DataBox limitations
- Its user interface could be improved; some of its users have reported it to be clunky
- There is no pricing plan for individual users, only for small teams, which is expensive for one user
- Reporting options have been found limited by some of its users
DataBox pricing
- DataBox offers a Free-forever plan, and paid plans start at $72/ month
Choose the Best Project Dashboard Software for Your Team
Dashboard software gives teams and project managers an overview of how the business is doing.
Using the data from your dashboard, you’ll be able to fix problems before they happen, improve workflows, and accurately track your progress.
But would James Bond trust any ol’ intelligence tool, or would he rely on an excellent source?
The same goes for what dashboard software you choose to bring into your company.
Are you going to rely on some subpar tool or use a powerful dashboard software like ClickUp?
From helping you monitor sprints to helping you plan, view, track, and assess your quarterly goals, ClickUp is the ultimate dashboard software.
Get started with ClickUp for free to know anything and everything about your company.
Related readings:
- Learn how to create a dashboard in Excel
- Learn how to create a dashboard in Google Sheets


