

It’s no secret that every company shooting for the stars needs some kind of business intelligence. By this, we don’t mean an extremely high IQ or an uncanny business instinct. It’s all about gathering and analyzing information to make smart decisions that can supercharge your organization’s success and resolve issues.
This is where dashboards come into play. They let you visualize all kinds of data, zoom in on specific aspects, track KPIs, and get a clear idea of your company’s health and progress.
There are various types of dashboards, but if you want to keep an eye on day-to-day operations and spot issues before they become big deals, an operations dashboard is your best bet. 🎛️
In this article, we’ll introduce you to operations dashboards, dig into their benefits, and help you create one to monitor every critical process related to a specific business area in your company.
Operations Dashboard 101: Keep a Watchful Eye on Your Processes
- What Is an Operations Dashboard?
- Key Features of an Operations Dashboard
- Benefits of an Operations Dashboard
- How to Create the Best Operations Dashboard: Eight Easy Steps
- Step 1: Choose your dashboard tool
- Step 2: Think about who will use the dashboard
- Step 3: Determine your objectives
- Step 4: Choose the right metrics
- Step 5: Determine data sources
- Step 6: Plan your dashboard’s layout and create visualizations
- Step 7: Update your data regularly
- Step 8: Refine your dashboard as needed
What Is an Operations Dashboard?
An operations dashboard (also called an operational dashboard) is a tool that tracks operational processes and gives you detailed insight into the performance of ongoing activities within your company.
Unlike analytical dashboards that dig into the past to predict the future, operational dashboards are more concerned about the present. They deal with current intelligence to uncover your operations’ performance and pinpoint weaknesses. This enables you to take adequate action and get your processes back on track.
Think of operations dashboards as eye-openers. Instead of wondering what’s wrong with your ongoing processes, experimenting with solutions, and crossing your fingers hoping they’ll work, you can make informed decisions based on operational KPIs displayed in your dashboards.
As they’re primarily concerned with ongoing processes, operations dashboards have a relatively short vision of reality, so they aren’t suitable for long-term planning.
Note that operations dashboards typically tackle specific business areas—you can’t use a single dashboard to track every process in your company. You should have separate dashboards for sales, marketing, manufacturing, distribution, and other areas, depending on your company’s line of work.
Key Features of an Operations Dashboard
Why is an operational dashboard so helpful in monitoring your day-to-day processes? Let’s check out some of its primary features:
- Data visualization: These dashboards don’t throw a bunch of raw data at you. Instead, they visualize it through charts, graphs, and other elements to save time and ensure easy comprehension 📊
- Real-time visibility: Operations dashboards display real and historical data, allowing you to get precise insights into the current performance of your processes
- Customizable notifications: The dashboards let you create notifications that warn you about potential issues so that you can act fast
- KPIs: These dashboards let you track the path to your goals by outlining relevant key performance indicators
- Ease of use: Using operations dashboards doesn’t require extensive training. They feature an intuitive interface you’ll pick up on in a jiff
- Tracking data trends: Some operations dashboards have advanced features that let you dig into history to understand current trends. Keep in mind that this isn’t common in regular operations dashboards
Benefits of an Operations Dashboard
An operations dashboard can be the tool you need to keep track of ongoing operational processes within a specific business area and nip every issue in the bud. Here’s how you can benefit from it:
Straightforward issue identification
One of the most significant benefits of operations dashboards is that they give you complete visibility over your ongoing processes. Thanks to this, you can spot even the slightest deviations from the usual operational performance and pinpoint them as potential issues.
Simply put, operations dashboards allow you to spot an inefficiency or a problem in its early stages before it causes more significant damage and disrupts your processes.
Easy employee productivity tracking
As operations dashboards let you track your day-to-day operations, they can be excellent tools for monitoring the productivity of your employees. For example, if you have an operations dashboard revolving around customer support, KPIs like the number of received and resolved tickets can help you understand how successful and fast your employees are at any given moment.
Improved decision-making
Having detailed metrics related to your operational processes allows you to make informed decisions instead of relying on your gut or obsolete performance reports.
In this sense, operations dashboards are vital for proper resource allocation, budget planning, and improved performance.
Goal tracking
Every organization has a goal it’s marching towards. Operations dashboards let you determine and monitor KPIs to complete that goal while ensuring every stakeholder is on the same page. They streamline the goal-tracking process and help you make small but confident steps toward the finish line with minimal hiccups.
Cost optimization
Observing your operational process through dashboards helps you pinpoint areas for improvement and adjust your resource allocation game to reduce costs and eliminate inefficiencies.
Easier planning
Since operations dashboards give real-time insight into your processes, they’re integral to successful planning. Use the info displayed on your dashboards to develop strategic plans based on the current situation and strive for continuous improvement.
Streamlined communication and collaboration
You can skyrocket team collaboration and communication with operational dashboards. Share the dashboards with relevant team members and allow them access to relevant data to boost transparency.
The data displayed on the dashboard can be the basis for constructive discussions and meetings where you’ll brainstorm how to improve operations management within your organization.
How to Create the Best Operations Dashboard: Eight Easy Steps
Want to create a comprehensive operations dashboard but have no idea where to start? We’ve got you covered!
We’ll walk you through the process in detail and help you assemble a first-class dashboard that serves your needs perfectly. For that purpose, we’ll rely on ClickUp, one of the finest project management platforms that makes building dashboards a breeze. 😍
Step 1: Choose your dashboard tool
To make the process of creating an operations dashboard as easy as possible, it’s crucial to choose a tool capable of visualizing and arranging your data. As you’ll find dozens of dashboard platforms, here are some criteria to focus on when selecting the right one:
- Flexibility: The platform should have diverse options to help you build an operations dashboard that aligns with your team’s needs and overall goals. These options can be anything from easy sharing and collaboration to unmatched visibility and various customization features
- Multiple widgets: The right dashboard tool should offer a wide selection of widgets. It should let you visualize workloads and progress and use multiple chart and graph types to represent your data
- Ease of use: The platform should have an intuitive interface and be easy to use for you and your team. Many dashboard tools have a drag-and-drop design that allows you to organize and adjust your layout effortlessly
- Integrations: The dashboard platform should be able to integrate with data management tools your organization typically uses
- Scalability: The tool should be able to handle larger and more complex historical data as your company grows
- Collaboration options: The right platform should support teamwork and let you and your collaborators work in real time, leave comments, and add notes

ClickUp is, first and foremost, a task and project management tool with loads of options for improving productivity, organization, and team collaboration. As such, ClickUp can be your go-to software for managing operations and creating dashboards.
When it comes to visualizing data, the platform offers a feature you’ll fall in love with at first sight—ClickUp Dashboards. It lets you create comprehensive, easy-to-understand, and aesthetically pleasing operational dashboards in only a few clicks.
You can choose from 50+ widgets to create custom charts, visualize progress and workloads, do calculations, or track time. You can also connect external apps to ClickUp Dashboards, skyrocketing its functionality.
Another reason why creating an operations dashboard in ClickUp is simple is because of Dashboard cards. Think of these cards as building blocks for the final dashboard. You add the cards one by one to paint a unique picture and visualize the desired info. 🎨
ClickUp templates
Don’t want or don’t have time to build your business intelligence dashboards from scratch? ClickUp has a solution for you! Use an operational plan or an operations dashboard template to save time and create dashboards for various use cases.
ClickUp’s library offers 1,000+ templates for various purposes, from project management and marketing to strategic planning and sales. Browse the library and find a perfect match for your organization’s needs.
Step 2: Think about who will use the dashboard
Before creating your operations dashboard, consider who will use it and why. Do you need a dashboard for an entire department or a specific project within that department? Will everyone on the team have access to it, or only the senior members?
Answering such questions will help you envision a dashboard everyone can understand and navigate.
Once you identify your dashboard’s users, ask them for opinions on how it should look. ClickUp offers an excellent feature that allows everyone to pitch in their two cents and communicate in real time—ClickUp Whiteboards.

Whiteboards are digital canvases ideal for brainstorming and team collaboration. They’re the perfect spot for discussing strategies, mapping out the process of creating an operations dashboard, and turning actions into ideas.
Step 3: Determine your objectives
The next step is defining clear and realistic business objectives, i.e., the purpose of your dashboard, which you can do in ClickUp Goals. Consider the metrics and KPIs you’re most interested in, depending on the specific business area the dashboard revolves around.
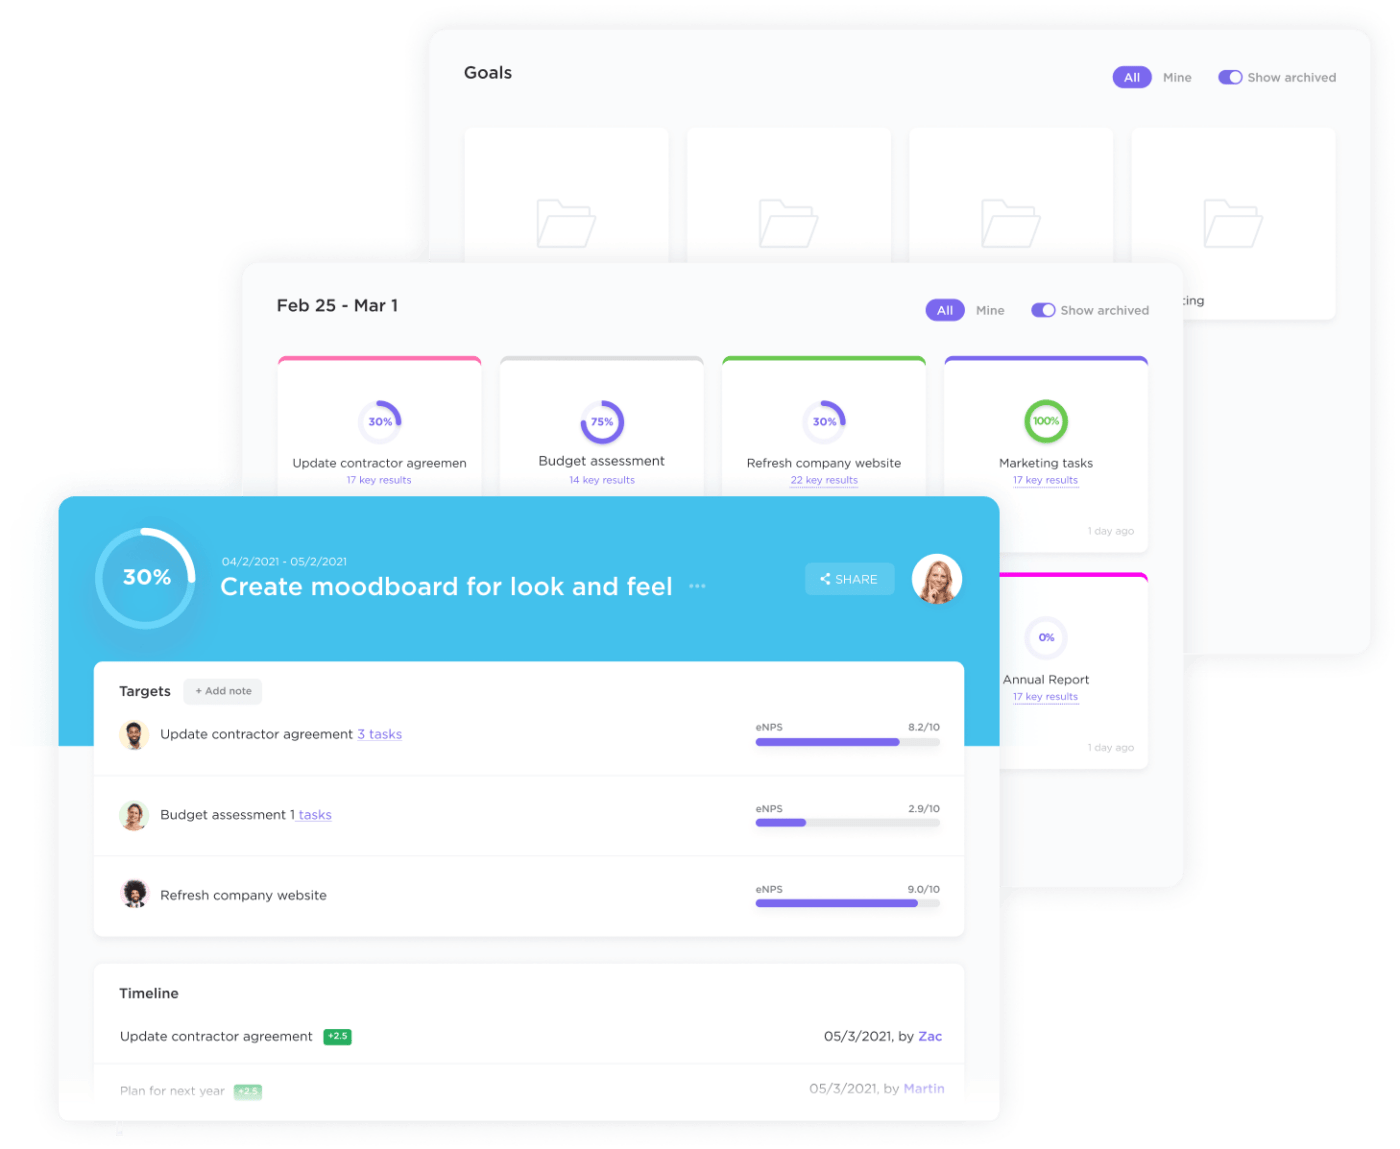
For example, if you’re building an operations dashboard for sales, you may consider metrics like sales performance, client satisfaction, or employee productivity.
If you need your team’s input on this, use ClickUp Forms. It’s an easy-to-use way to collect information from relevant team members in a jiff. All you need to do is create a Form (which is super easy and intuitive) and share it with your team. They’ll provide their answers, and voilà—ClickUp will gather and display the submitted info to make it easier to analyze.
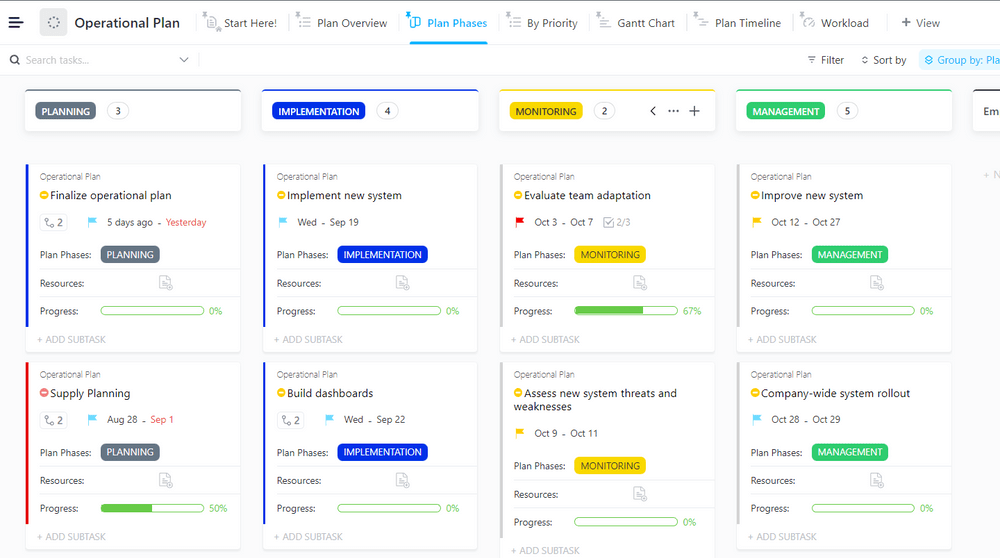
You can fast-track this step with the ClickUp Operational Plan Template. It lets you outline and measure your goals and create an action plan for achieving them. Plus, it fuels collaboration and communication, streamlines processes, and jumpstarts productivity.
Step 4: Choose the right metrics
Now it’s time to select the most relevant metrics and KPIs for your operations dashboard. Think of those that align with your business, department, or project objectives the most and allow you to make strategic decisions regarding your business processes.
Keep in mind that your operations dashboard should be simple. While you may want to stuff it with all kinds of metrics reflecting different aspects of your processes, this isn’t the best idea. Such a dashboard can be overwhelming and hard to follow, which beats its purpose.
The best practice for choosing the right metrics is focusing on a few key ones that accurately depict the performance of your processes. Remember, having multiple dashboards for a single business area is always better than having one overflowing with hard-to-follow data.
Selecting the right metrics should always be a team effort. Brainstorm in ClickUp Whiteboards, use ClickUp Forms to collect feedback, communicate in the ClickUp Chat view, and outline the key metrics without breaking a sweat! ✌️
Step 5: Determine data sources
In this step, you need to define the sources of the data you want to see on your operations dashboard, like databases, APIs, and spreadsheets.
As ClickUp lets you build databases, you can use it as a source for your dashboards. Enter your data as tasks, categorize them using Custom Fields, and switch between 15+ ClickUp views to arrange them as you please.
Alternatively, you can take advantage of ClickUp’s robust integration capabilities and connect it with other software you use to manage or store data. Besides 1,000+ native integrations with tools like Slack, HubSpot, Everhour, and Zendesk, you can build custom integrations through ClickUp API, and pull your data from whatever source you want.
Step 6: Plan your dashboard’s layout and create visualizations
The next step is figuring out your dashboard’s appearance, taking into account optimal user experience, organization, and visual appeal.
ClickUp Dashboards makes this process super easy. Thanks to the drag-and-drop design, you can move your cards around and update the layout to your liking.
Choose the elements you want on your dashboard, select the right widgets and data sources, and create visualizations based on the specified metrics.
Step 7: Update your data regularly
Congratulations, you’ve created your operations dashboard! 🥳
But keep in mind that your job doesn’t end here. The entire point of an operations dashboard is to display real-time data. You need to ensure that the dashboard shows the most recent information—outdated information corrupts your perception of operations’ performance and can lead to wrong decisions.
Update your data source regularly to avoid such scenarios. You can use ClickUp Automations to reduce manual work and the risk of mistakes. Automations are based on triggers, conditions, and actions and can help you ensure the data in your dashboards is always fresh and relevant.
ClickUp offers four types of automations:
- Custom: Automations you create yourself when you have a specific scenario in mind
- Templates: Preset automations
- Integrations: Connect another app to ClickUp to set up your automations
- Assignee and watcher: Set an assignee (watcher) for all new tasks
Step 8: Refine your dashboard as needed
Your operational dashboards may serve their purpose today, but will require refinement at one point or another to accommodate your updated operations or new data.
You should occasionally review performance metrics and KPIs to ensure they’re still relevant. Reconsider the dashboard’s layout and see how you can improve it to enhance efficiency.
Another important aspect here is collecting feedback from your team members. Ask if they find the dashboard useful and what they would like to change. ClickUp Forms can assist with this—create forms your team can quickly fill out and get a detailed summary of the collected information.
ClickUp: The Perfect Home for Your Operations Dashboard
ClickUp offers everything you need to create an operations dashboard. With this visual project management platform, you can define your goals, select the right metrics, set up databases, visualize the desired information, and collaborate with your team.
Sign up for ClickUp today and start building your perfect dashboard to take control of your operations! 🌹


Everything you need to stay organized and get work done.

Recent Articles
Claude Skills for Project Management: A Practical Guide 
Claude Skills for Project Management: A Practical Guide
How to Write a Scope of Work (+ Examples & Templates)
How to Write a Scope of Work (+ Examples & Templates)
What Are Project Goals? Definition, Examples & How To Write Them 
What Are Project Goals? Definition, Examples & How To Write Them
