


Still downloading templates?
There’s an easier way. Try a free AI Agent in ClickUp that actually does the work for you—set up in minutes, save hours every week.
Sorry, there were no results found for “”
Sorry, there were no results found for “”
Sorry, there were no results found for “”
You manage work in sprints, adapt quickly, and value flexibility to keep up with the project progress. But leadership wants deadlines, release dates, and quarterly timelines—preferably all neatly laid out in a visual plan.
If you’re an Agile project manager, Scrum master, or product owner, chances are you’ve faced this tension before.
Backlog grooming, sprint boards, and burndown charts are great for day-to-day Agile execution. However, they fail to answer the big-picture questions like: When will Feature X be done? How does this all fit together over the next three months?
For this, Agile Gantt charts are your savior. In this guide, we’ll discuss what an Agile Gantt chart is and how it differs from traditional timelines. We’ll also see the key features that make a Gantt chart ‘Agile,’ and a step-by-step approach to building one.
🧠 Fun Fact: The history of Gantt charts dates back to the early 1900s when Henry Gantt created the original version to manage shipbuilding schedules. His visual planning method later played a key role in major projects like the Hoover Dam and NASA’s Apollo program.
Why use an Agile Gantt Chart? Because even Agile teams need a visual roadmap. The ClickUp Simple Gantt Chart Template maps your entire project lifecycle—from kickoff to closure. Use color-coded phases, task statuses, and assignee fields to track exactly where each task stands. Dependencies and due dates auto-adjust as you move things around.
An Agile Gantt chart is a visual planning tool for Agile project management and combines:
What makes it useful for project managers who work in hybrid environments?
So for starters, when you need to commit to a deadline and report to the C-Suite, Gantt charts help you visualize long-term project plans without locking teams into waterfall processes.
They also connect your short-term sprint execution with long-term roadmap goals.
Yes—but not in the traditional, rigid way. Agile teams typically rely on sprint burndown charts, task boards, release plans, etc., to plan projects and visualize progress. These tools work well for sprint planning and execution.
But they often fall short when you need to plan across multiple sprints, teams, or stakeholders. That’s where Gantt charts can help.
When you use an agile Gantt chart for project management, here are the benefits it offers:
When you’re managing multiple teams, tasks, and releases, complexities multiply quickly, and the worst part is that your dependencies span across teams, departments, and even time zones.
Overlapping delivery schedules also adds to the chaos of project progress.
An Agile Gantt chart, as a visualization technique, provides a top-down view to track cross-team dependencies and adjust project schedules in real-time during delays. You’ll be able to keep all teams aligned without constant meetings or back-and-forth.
Some projects can’t run on a ‘we’ll figure it out, sprint by sprint’ approach. You need to plan ahead because:
The benefit of using a Gantt chart in Agile projects is that it allows you to assign tasks, considering all of the above factors.
💡 Pro Tip: Not sure where to start? Learn how to create a Gantt chart that fits your Agile workflow for planning cross-functional launches or mapping feature releases across a quarter.
When your team supports multiple stakeholders, each group expects different things:
An Agile Gantt chart shows them how the work is projected to unfold, with the understanding that it’s an estimate and will be updated regularly.
❌ When to skip Agile Gantt Charts?
📚 Read More: Free Task Management Templates in ClickUp & Excel
Certain characteristics enable a Gantt chart to function well in an Agile process.
Here are the common ones to look for (and implement):
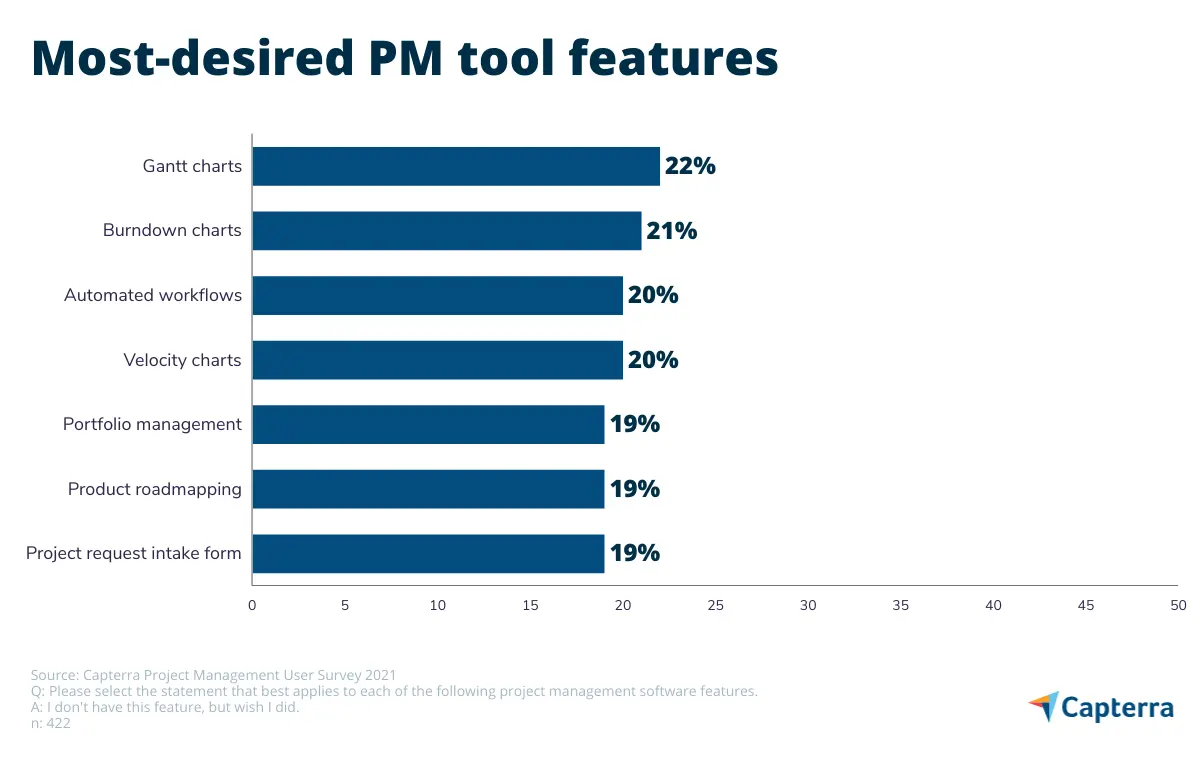
👀 Did You Know: As per Capterra’s Project Management Software Market Research report, 22% of users of software rank Gantt charts as a feature that’s most desired, closely followed by burndown charts.
⚡ Template Archive: Gantt Chart Project Templates
While both Agile and waterfall processes utilize Gantt charts and share many similar components, the approaches differ significantly. Here’s a side-by-side comparison:
| Aspect | Traditional Gantt Chart (Waterfall Style) | Agile Gantt Chart |
| Planning approach | Upfront planning: The full project is mapped out with fixed dates and task sequences, sometimes months or even a whole year in advance | Iterative planning: A high-level timeline is set, but details are planned in short sprints (1-4 weeks). Future tasks stay as rough estimates that get refined over time |
| Level of detail | Micro-detailed: Each task and subtask gets a date and duration, creating a massive but complex chart with hundreds (or thousands) of rows | High-level (macro) focus: Instead of listing every task, it groups work under epics, features, or major deliverables. Detailed tracking happens in the backlog or task board |
| Team involvement | Planner-centric: Created and controlled by the project manager. Teams often have little say in the plan and only update their task status when asked | Collaborative: The team helps shape and update the Gantt, especially during sprint planning. They can adjust tasks when the scope changes or the estimates turn out wrong |
| Change management | Resistance to change: Updating one task can require recalculating many others. So, teams may continue working with outdated plans just to avoid the hassle | Embraces change: The chart gets updated continuously during sprint reviews or whenever priorities shift |
| Usage | Static: Often a static reference document, it might be reviewed in weekly status meetings or in reports, but it’s not consulted daily by the team | Dynamic and integrated: Teams refer to it during stand-ups or use it in retrospectives to discuss how to adjust future sprint plans. It’s integrated with their task management system |
| Scrum integration | Not applicable: Waterfall doesn’t use Scrum events | Tightly integrated: Gantt timelines evolve through Sprint Planning, Daily Stand-ups, Sprint Reviews, and Retrospectives |
⚡ Template Archive: Agile Templates for Projects in ClickUp, Excel, and Google Sheets
If you’ve ever tried building a Gantt chart in Excel while managing sprints, you know the drill:
Outdated dates. Broken dependencies. Version 12.3_final_FINAL.xlsx.
Tracking project progress is time-consuming and error-prone.
ClickUp, the world’s first Converged AI Workspace, is often deemed a favorite in a project manager’s life.
With ClickUp’s Project Management Solution, creating Agile Gantt Charts doesn’t require you to wrangle spreadsheets. You can drag-and-drop timelines, auto-shift dependencies, and collaborate live with your team.
ClickUp is the best Agile ALM platform for teams looking to manage Docs, Sprints, and collaboration in one place. It combines task management, Whiteboards, Chat, Gantt charts, and AI features in a no-code, customizable workspace. This means no more unnecessary work sprawl.
Here’s how you can create a Gantt chart that works with your Agile process.
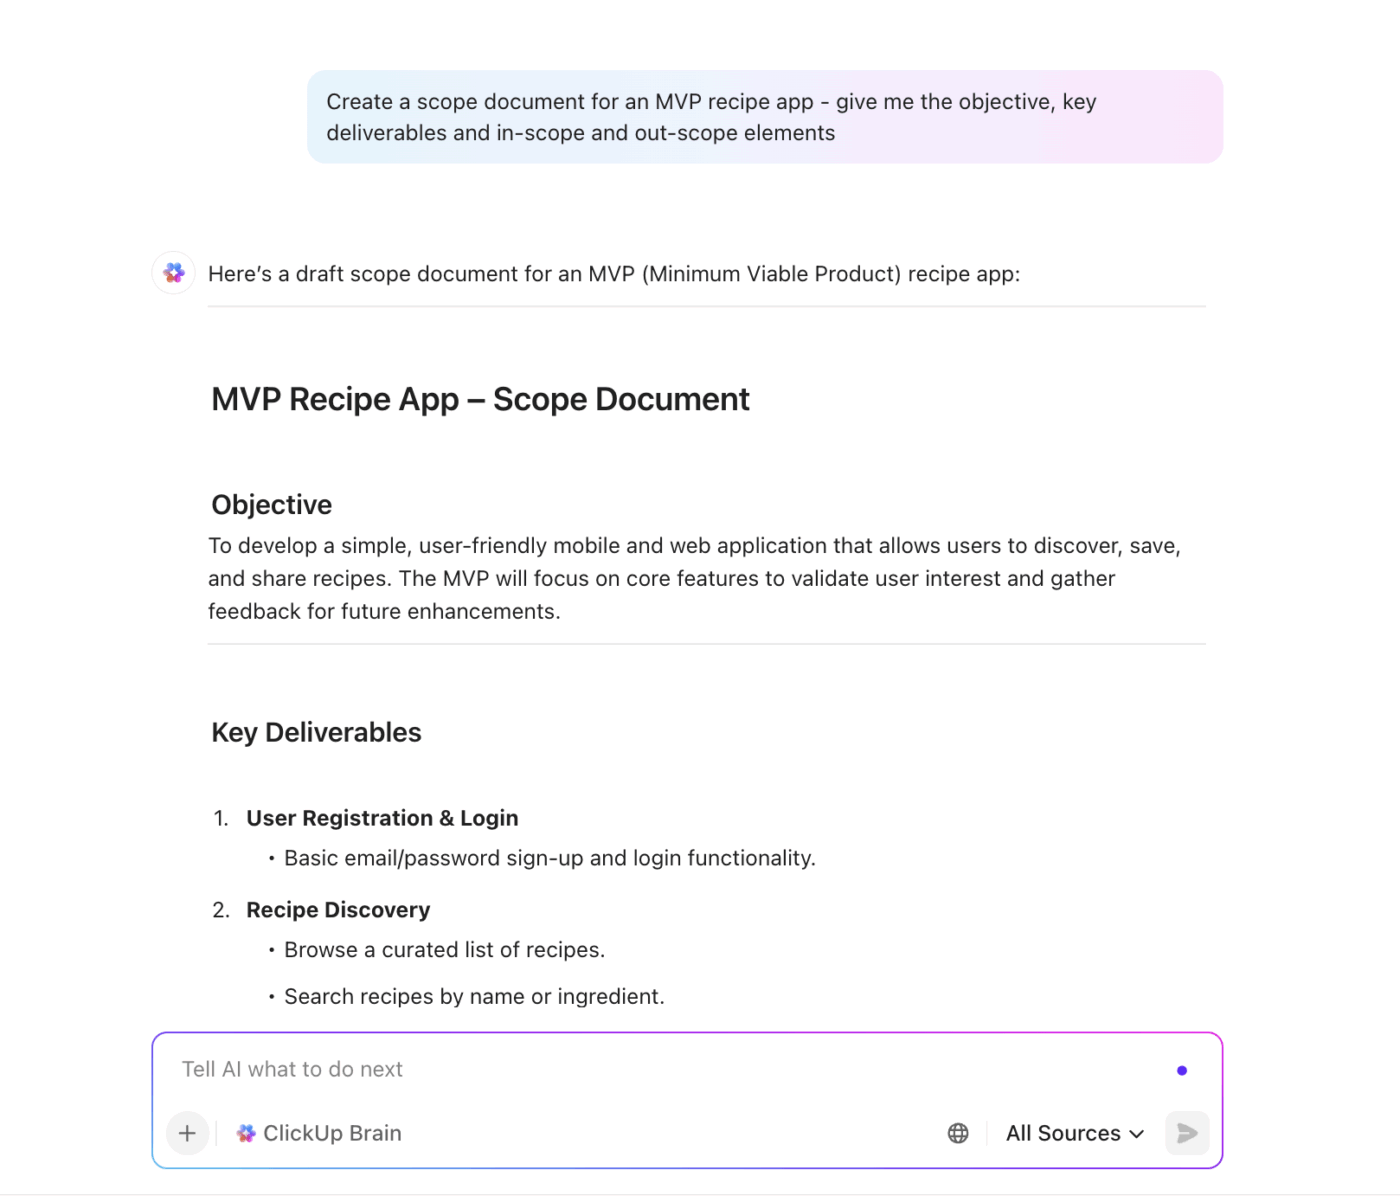
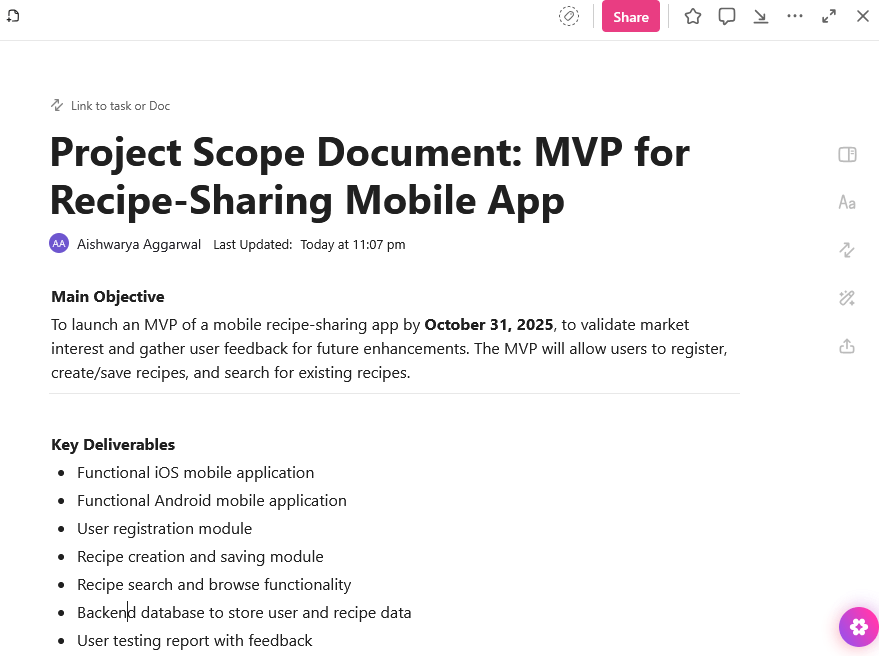
A clear project scope establishes a clear understanding of:
Let’s say you’re building an MVP for a new project on a new recipe-sharing mobile app:
| Project details | Description |
|---|---|
| Main objective | To launch an MVP of a mobile recipe sharing app by October 31, 2025, to validate market interest and gather user feedback for future enhancements |
| Key deliverables | Functional iOS app, functional Android app, user registration module, recipe creation/saving module, etc. |
| In-scope items | – User registration – Recipe creation/saving – Basic search- Browse by category – Mobile apps (iOS & Android) |
| Out-scope items | – User reviews/ratings – Social sharing – Video recipe support – Offline mode- Push notifications – Web version of the app |
ClickUp’s built-in AI assistant, ClickUp Brain, helps you move from ideation to creating a product roadmap.
Here’s how:
💡 Bonus: If you want to supercharge your Agile execution by:
Try ClickUp Brain MAX—the AI Super App that truly understands you, because it knows your work. Ditch the AI tool sprawl, use your voice to get work done, create documents, assign tasks to team members, and more.
Plus, ClickUp Docs serves as a single source of truth for your team to manage the project scope. As your project evolves, the doc stays synced with your workspace.
This means your scope, updates, and sprint plans stay accessible, editable, and aligned across teams.
⚡ Template Archive: Free Project Timeline Templates in Word, Excel, and ClickUp
There are three elements that play a critical role in your execution plan, regardless of the type of Gantt chart you’re making.
Milestones charts in Agile projects indicate the non-negotiable events, deadlines, or key outcomes in your project timeline.
Example milestones for recipe app MVP:
To support these milestones, you need to create epics. These are goal-driven features that are too big for one sprint. Break them down into smaller user stories or tasks that can be completed in iterations by your development team.
| Epics | Features |
| Recipe Creation | – Add new recipe – Edit existing recipe – Delete recipe – Add ingredients – Add step-by-step instructions |
Lastly, you will assign start and due dates to each task based on its complexity. This helps you:
ClickUp List View gives you a clean, vertical layout where you can view all your epics in one place. Go to the List View in your dedicated Workspace and add each epic as a task. Then, break down each task into subtasks.
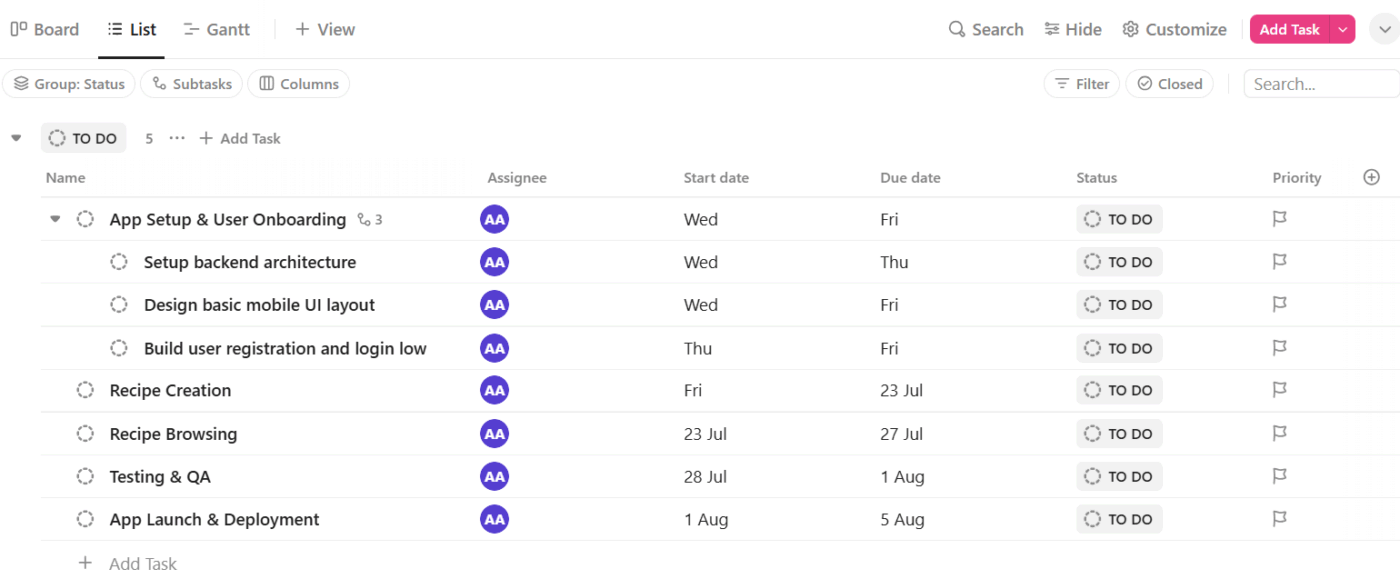
You can also use ClickUp Custom Fields to set Start and Due Dates. And add Priority, Status, and Milestone alignment fields to track task urgency and progress.
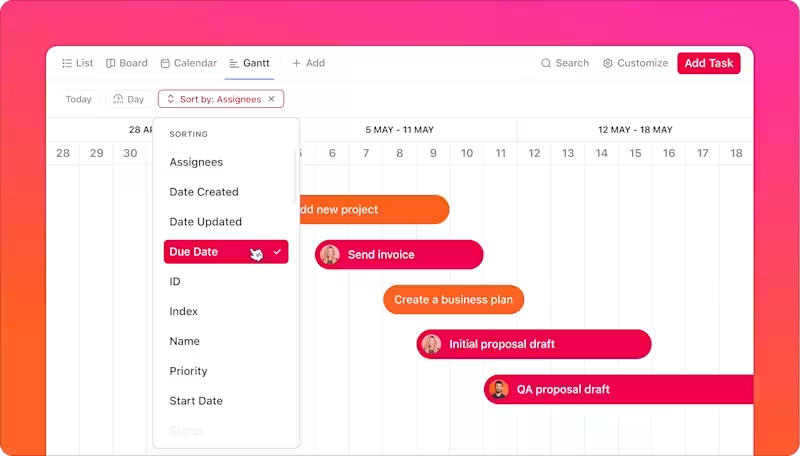
🎥 Watch: How to use Gantt View (ClickTips)
Now, it’s time to visualize your high-level plan on a timeline via ClickUp’s Gantt chart software.
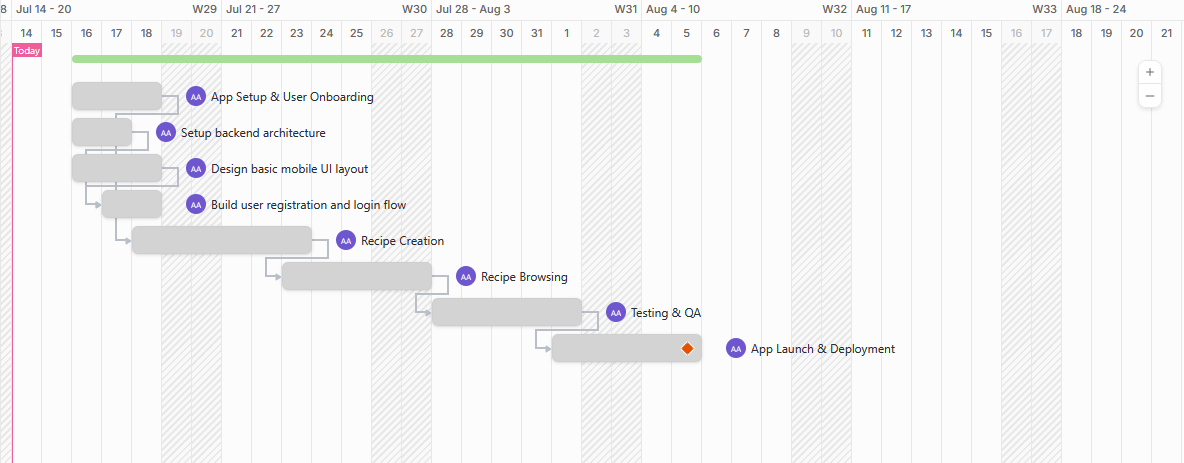
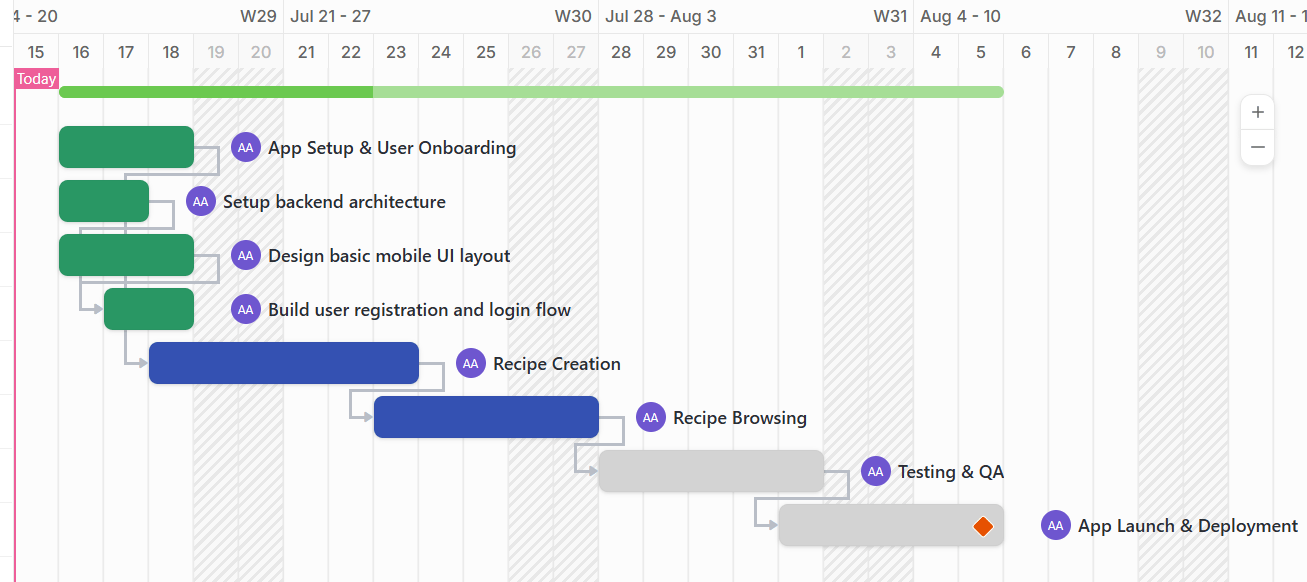
1. Switch to Gantt View: Inside your Workspace, choose the list you want to include (Recipe App MVP). Then, click on + View and select Gantt.
ClickUp will automatically generate your Gantt chart based on the epic and subtasks you mentioned in the List view.
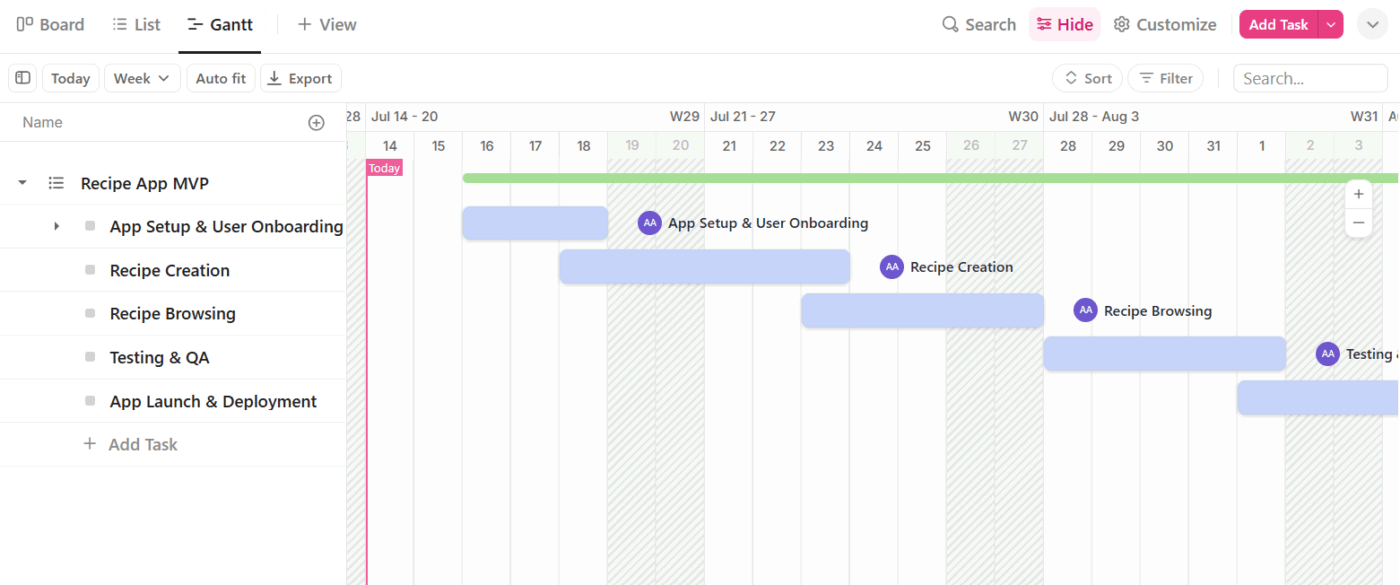
2. Add milestones: In the Gantt chart, right-click Task Type → Milestone. This converts relevant tasks into ClickUp Milestones that appear as diamond icons on the chart. This way:
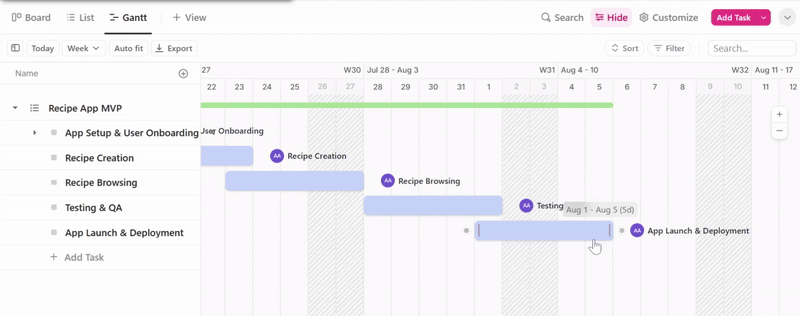
3. Create dependencies: ClickUp Dependencies let you connect tasks that rely on each other. You can see exactly which task must finish before another can start. And blockers that could delay the next sprint.
To set dependencies, right-click over a task bar you want to connect to another bar → click Dependencies. You’ll see two types:
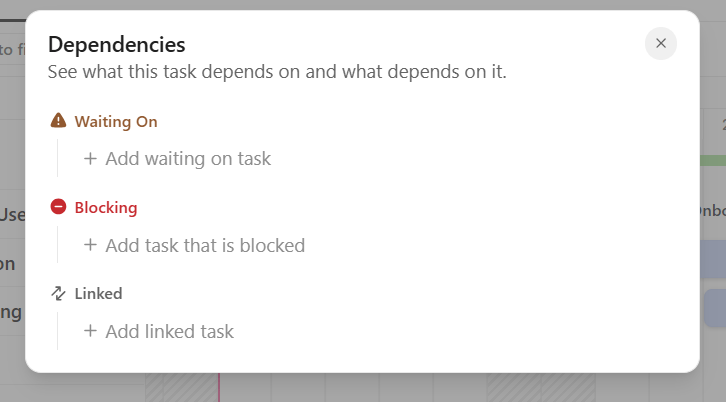
Here are some dependency examples for the Recipe App MVP project:
| Task | Dependency type | Depends on | Why it matters |
| Recipe Creation | Waiting on | App setup & user onboarding | Users must be able to log in before creating and saving recipes. |
| Recipe Browsing | Blocking | Testing & QA | The QA team needs this feature completed to test the full browsing experience. |
| Testing & QA | Blocking | App launch & deployment | App launch must wait until QA confirms all features work as expected. |
Once added, you’ll see arrows between task bars. Repeat the process for any number of tasks you want to map out the full sequence.
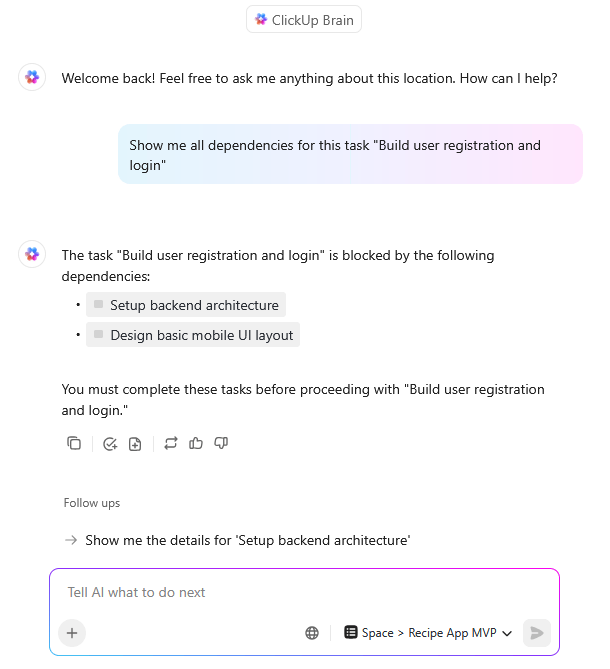
💡 Pro Tip: While Agile Gantt charts help you visualize task dependencies, use ClickUp Brain to instantly summarize what a task is waiting on, what it’s blocking, and what it’s linked to. This prevents you from manually tracing arrows and speeds up decision-making.
Some example prompts:
Since your Agile team works in sprints, each sprint should end with a tangible outcome: a tested feature, a functional improvement, or a ready-to-launch module.
Here’s how 2-week sprints look:
| Sprints | Dates | Deliverables |
| 1 | Aug 5 – Aug 16 | – Backend framework setup (Node.js, Firebase, etc.) – User registration/login flow – Basic mobile UI layout |
| 2 | Aug 19 – Aug 30 | – “Add Recipe” form – Save recipe to user profile – Upload ingredients & instructions |
ClickUp’s Agile Project Management Software lets you incorporate sprints in two ways:
💡 Pro Tip: Use sprint planning templates to get a ready-made structure to kick off every sprint.
These typically include:
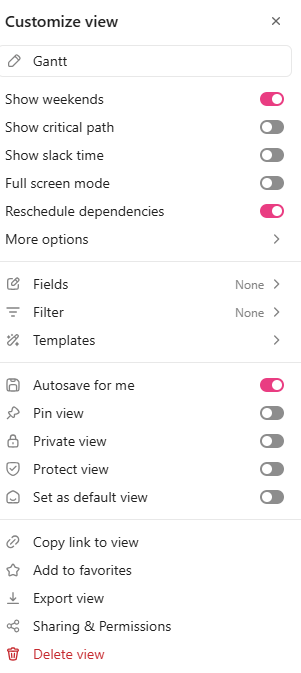
This step involves tailoring your Gantt chart to match your Agile workflow. After opening the Gantt View, click the Customize button located on the right side of the screen.
🎥 Watch: The 2 Best Ways to Leverage the Gantt Chart
Apart from renaming your chart, you can:
📮 ClickUp Insight: 31% of managers prefer visual boards, while others rely on Gantt charts, dashboards, or resource views.
But most tools force you to pick one. If the view doesn’t match the way you think, it just becomes another layer of friction.
With ClickUp, you don’t have to choose. Switch between AI-powered Gantt charts, Kanban Boards, Dashboards, or Workload View in a single click. And with ClickUp AI, you can auto-generate tailored views or summaries based on who’s looking—whether it’s you, an exec, or your designer.
💫 Real Results: CEMEX sped up product launches by 15% and cut communication delays from 24 hours to seconds using ClickUp.
Agile plans are never static, and your Gantt chart shouldn’t be either.
So, use it as a live planning tool to:
As Agile teams thrive on fast feedback and real-time collaboration, with Clickup SyncUps, you can instantly hop into video or audio calls directly from your workspace.
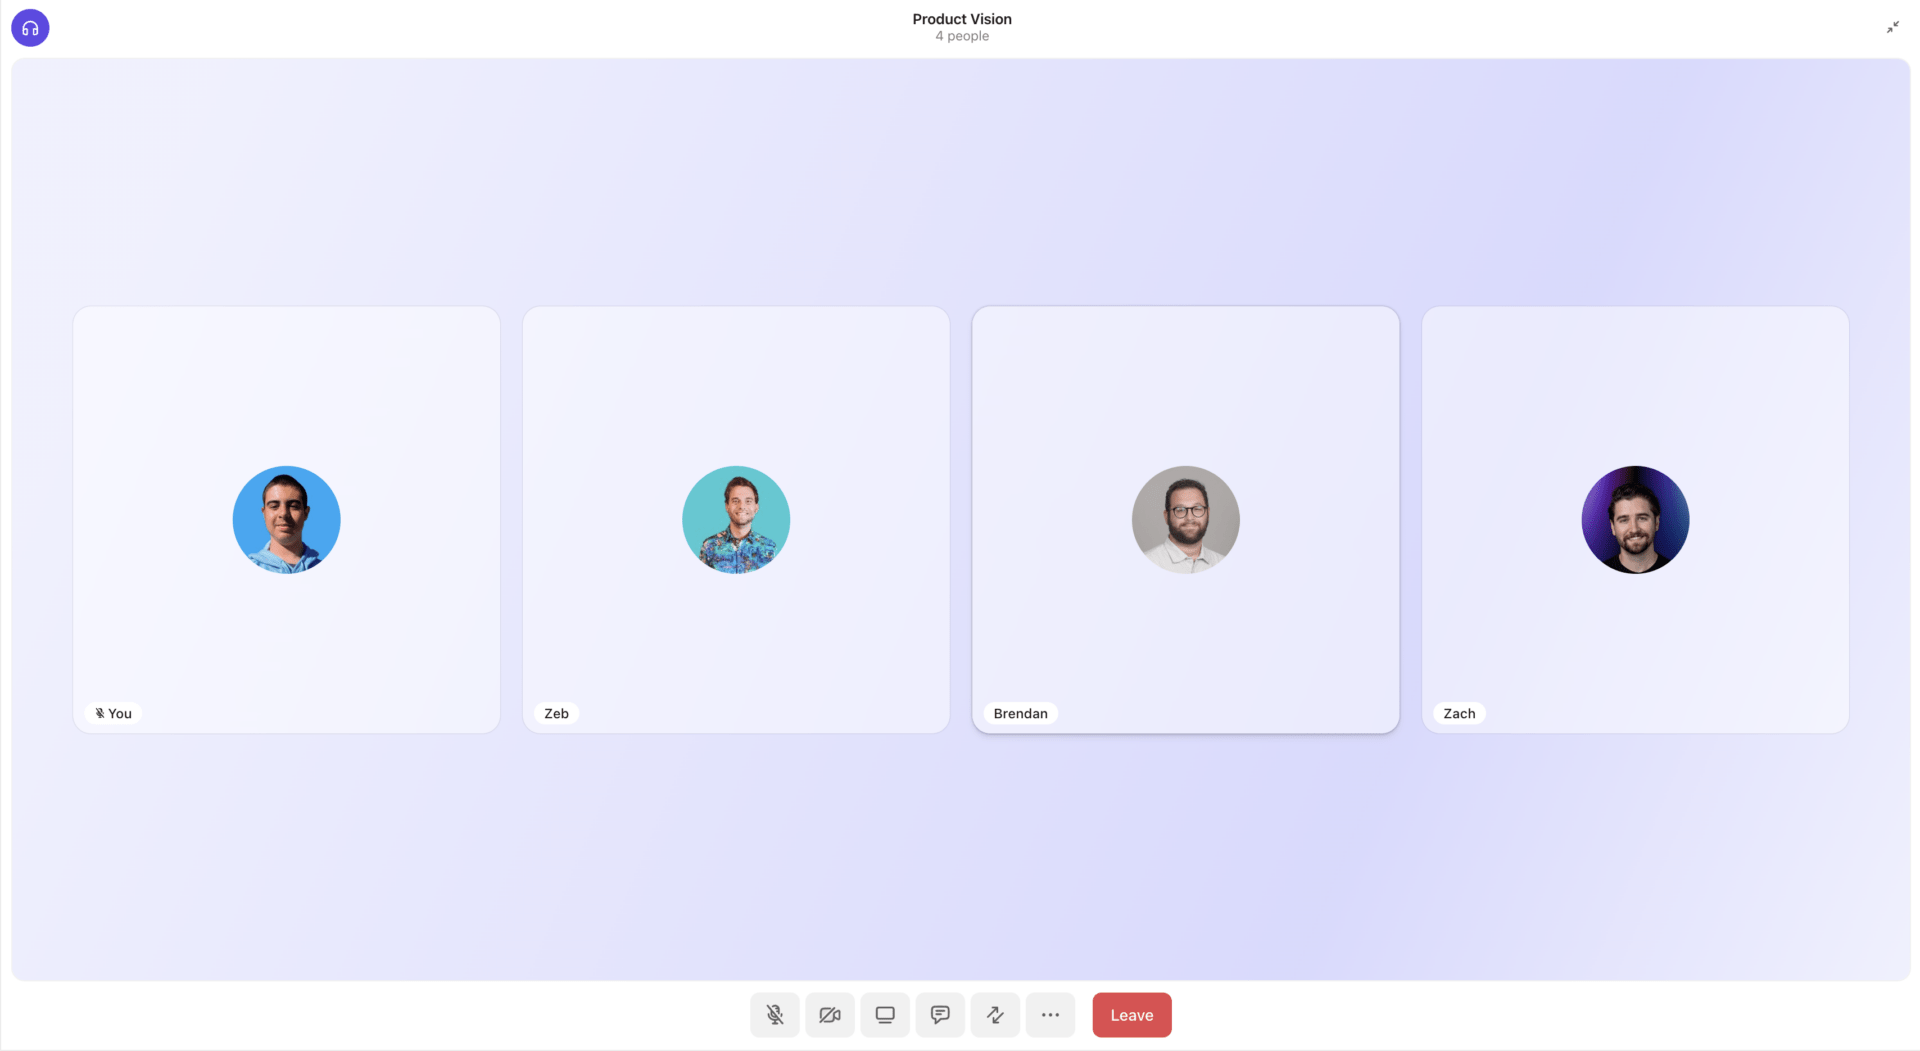
Use screen sharing to walk through sprint boards, backlog grooming, or blockers. Turn discussions into action by linking tasks mid-call, and keep everyone aligned with recorded meetings and AI-powered summaries.
Asynchronous team members can comment on recordings and catch up without slowing delivery. SyncUps keep Agile communication fluid—without pulling you away from the work.
💡 Pro Tip: Pair your Gantt chart with ClickUp’s Workload View to catch overallocation early. For example, if one developer has three tasks in a week, it flags it so you can reassign or adjust before it blocks progress.
While we’ve seen the benefits of using Gantt charts to manage tasks in Agile workflows, it’s only fair to also see the limitations.
| ✅ Pros | ❌ Cons |
| Improved stakeholder communication: Not all stakeholders are versed in Scrum boards or burndown charts. Using Gantt charts with Agile methodology shows them clear timelines like “Feature A done in March, testing in April.” | Overhead in maintenance: If your Gantt tool isn’t integrated or automated, updating timelines manually becomes time-consuming. |
| Synchronization across teams: They highlight cross-team dependencies and make it easier to spot coordination issues early. This is especially useful in scaled Agile setups. | Potential for reduced team communication: Agile depends on daily conversations and collaboration. If a project manager makes updates without team input, confusion is inevitable. |
| Flexibility with modern tools: Project management tools like ClickUp make Gantt charts flexible and easy to maintain. It offers real-time collaboration, drag-and-drop scheduling, and automatic adjustments. | Not ideal for daily task management: Gantt charts are great for macro-level planning but don’t show what’s in progress, what’s blocked, or what’s done today. You will need Scrum or Kanban boards for daily work. |
⚡ Template Archive: Free Project Schedule Templates in Excel and ClickUp
Often viewed as too rigid for Agile project management, with the right approach, Gantt charts help teams with visualizing dependencies, aligning on timelines, and managing cross-team coordination.
With ClickUp, you can easily create Gantt charts, update timelines as work evolves, and track dependencies without losing the bigger picture.
Thanks to its drag-and-drop feature, you can reshuffle priorities mid-sprint. With automatic dependency adjustments, when dates shift, downstream tasks move with them, keeping your schedule accurate.
Ready to start building smarter Agile Gantt charts? Sign up for ClickUp for free to get started.

© 2026 ClickUp

There’s an easier way. Try a free AI Agent in ClickUp that actually does the work for you—set up in minutes, save hours every week.