yfx for project management success blog featured image

How to Implement Y=f(x) in Project Management for Success

Start using ClickUp today

  • Manage all your work in one place
  • Collaborate with your team
  • Use ClickUp for FREE—forever

Ever wondered what Y=f(x) means in project management? This powerful concept isn’t just for mathematicians. It’s a game-changer for project success, helping you map out how inputs affect outcomes. 

Y=f(x) is more than just a formula; it’s a way to understand and control your project’s variables, improve efficiency, and make smarter decisions. 

In this article, you’ll learn how to implement Y=f(x) in your projects. We’ll break down the DMAIC framework and show you how it ties in with this concept. You’ll also learn some best practices to make the most of Y=f(x) in your projects.

Whether you’re new to Six Sigma tools or a seasoned pro, these insights will help you be a more effective project manager. 

Summarize this article with AI ClickUp Brain not only saves you precious time by instantly summarizing articles, it also leverages AI to connect your tasks, docs, people, and more, streamlining your workflow like never before.
ClickUp Brain
Avatar of person using AI Summarize this article for me please

Y=f(x) in Six Sigma

Y=f(x) is a cornerstone of the Six Sigma methodology, helping us express desired outcomes in measurable terms. 

In project management, the equation Y=f(x) is a mathematical representation of the functional relationship between a project’s inputs (x) and its outputs (Y). Essentially, it means that a project’s outcome is a function of its input variables and the factors that influence them.

In other words, the results you achieve (Y) depend on the elements you put into the project (x) and how they are combined (f).

When setting up a project, it can be challenging to formulate the initial problem statement and specify the desired outcomes. By using Y=f(x) at the outset, you’re pushed to clearly understand ‘Y,’ which represents the desired results you’re working to achieve. 

This approach forces you and your project team to view outcomes as measurable terms, setting a solid foundation for your project’s success regardless of your chosen project management methodology.

Unpacking the Y=f(x) formula

To harness the power of Y=f(x) in your projects, you need to understand its core components:

  • Y (Outcome): This represents the output or result of a project. This could be anything from a delivered product or service to a specific outcome like increased sales or improved customer satisfaction
  • f (Function): This refers to the function or process that transforms the inputs into the desired output. This could be a series of tasks, activities, or decisions that contribute to the project’s goal
  • x (Input): These could include resources (e.g., time, money, people), tools, techniques, or external factors (e.g., market conditions, technology advancements)
  • ε (Error): This represents the level of uncertainty or difference between the expected and actual outcomes when the process is applied

The mathematical function Y=f(x) describes a relationship between a dependent variable (Y) and one or more independent variables (x). It shows how changes in the independent variables lead to changes in the dependent variable.

Let’s understand the concept with a practical example.

Consider a software development project:

Y: A fully functional, bug-free software application

f: The development process, including requirements gathering, design, coding, testing, and deployment

x: Inputs such as the development team’s skills, the project’s budget, the chosen programming language, and the project’s timeline

In this example, the quality and success of the software application (Y) depend on the effectiveness of the development process (f) and the availability and quality of the inputs (x).

Benefits of Y=f(x) for project managers

Implementing Y=f(x) in your project management approach offers several key benefits:

  • Improved understanding of cause and effect: Y=f(x) helps you grasp the relationship between inputs and outcomes, allowing you to make more informed decisions throughout your project
  • Enhanced performance measurement: By clearly defining your desired outcomes (Y) and the factors influencing them (x), you can more effectively measure your project’s performance and identify areas for improvement
  • Data-driven decision making: Y=f(x) allows you to systematically understand and optimize the relationship between input factors and desired output metrics. This data-driven approach helps in reducing defects, errors, and variations while enhancing product quality and customer satisfaction 
  • Continuous improvement: Leveraging Y=f(x) equips you with a powerful tool to drive continuous improvement, reduce costs, and achieve sustainable growth in your projects 
  • Innovation and adaptability: The ability to model and predict how changes in factors impact outcomes empowers you to innovate and adapt. In a dynamic market landscape, this gives you a definite competitive edge
  • Effective problem-solving: Y=f(x) guides you through the DMAIC (Define, Measure, Analyze, Improve, Control) roadmap, providing a structured approach to problem-solving in your projects

Challenges with using the Y=f(x) framework

While Y=f(x) offers numerous benefits, it’s important to be aware of potential challenges. Some of these are:

  • Lack of data: In some cases, project managers may not have sufficient data to quantify the relationship between inputs and outputs accurately. This can make the equation ineffective
  • Complexity of inputs: Many projects involve a vast number of interrelated inputs, making it difficult to identify and quantify all relevant factors accurately.
  • Uncertainty and risk: Projects are inherently uncertain, and unforeseen events can significantly impact the relationship between inputs and outputs. This makes it difficult to establish a definitive equation
  • Qualitative factors: Many factors that influence project outcomes are qualitative, making it difficult to measure and quantify them accurately. This can limit the usefulness of the equation
  • Interdependencies: Inputs often have interdependencies, and changes to one input can affect multiple other inputs. This can make it challenging to isolate the impact of individual factors
  • Team resistance: Implementing process improvements based on Y=f(x) might face resistance from team members unfamiliar with statistical methodologies. In such cases, project managers would have to adopt effective change management strategies
Summarize this article with AI ClickUp Brain not only saves you precious time by instantly summarizing articles, it also leverages AI to connect your tasks, docs, people, and more, streamlining your workflow like never before.
ClickUp Brain
Avatar of person using AI Summarize this article for me please

Implementing Y=f(x) Through the DMAIC Framework

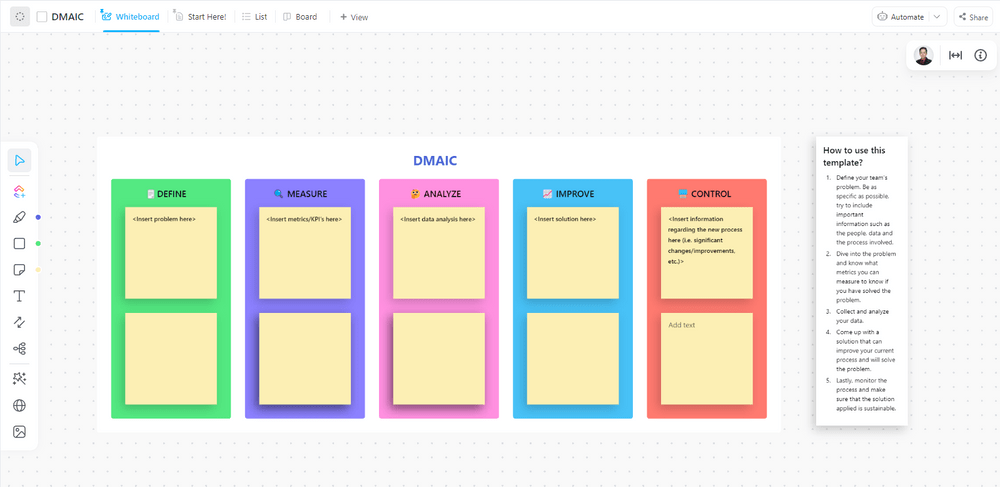
DMAIC (Define, Measure, Analyze, Improve, Control) is a structured problem-solving methodology often used in Six Sigma projects. It provides a systematic approach to identifying and addressing the root causes of defects or inefficiencies. The Y=f(x) concept can be seamlessly integrated into the DMAIC framework to enhance problem-solving and process improvement.

Here’s how you can use DMAIC to put Y=f(x) into action.

Step 1. Define: Setting project goals

The first step toward a successful project is identifying what you wish to achieve. This is where the Define stage comes in handy. It’s all about grasping the ‘Y’ in your Y=f(x) equation—your desired outcome.

Start by asking yourself if your project has a specific, defined business or process problem to solve.

Sometimes, the answer is clear, but often, you’ll need to dig deeper. If it’s not obvious, work on getting a clear picture of your ‘Y’—the process problem you’re trying to solve—in measurable terms that align with your project goals.

Execute Y=fx with ClickUp SIPOC Template
Analyze supplier-input-process-output-customer relationships to identify important components, existing connections, and prospective gaps in a process

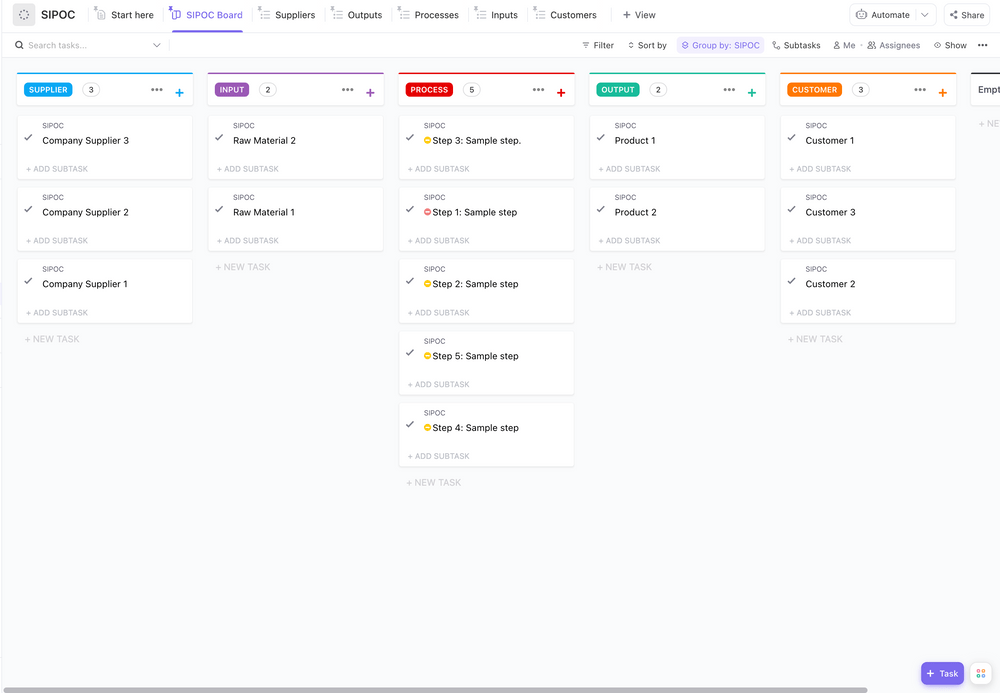
A helpful tool at this stage is the SIPOC (Supplier, Input, Process, Output, Customer) diagram. This can help you:

  • Scope the problem
  • Think in terms of processes
  • Pinpoint what and where to measure
  • Link metrics to inputs, processes, and outputs

By using SIPOC, you’re setting the stage for Y=f(x) thinking right from the start.

Step 2. Measure: Identifying key variables

Once you’ve defined your ‘Y,’ it’s time to move into the Measure stage. In this stage, the focus is on collecting and analyzing data. In this stage, you must:

  • Map out your project to identify potential causes of ‘x’ variables
  • Determine which ‘x’ variables have the greatest influence on ‘Y’
  • Prioritize and narrow down your list of ‘x’ variables to a manageable number
  • Gather data around the current ‘Y’ and ‘x’ to establish a baseline  

This is a critical stage since the lack of significant data can often lead to failure ahead. Avoid making decisions based on gut feelings or anecdotes. Instead, focus on gathering solid data to inform your choices.

Step 3. Analyze: Prioritizing root causes

Moving into the Analyze stage, your goal is to verify and quantify the relationship between ‘x’ and ‘Y.’ This is where the Y=f(x) formula really comes into play. Use statistical and graphical tools to:

  • Test the relationship between ‘x’ and ‘Y’
  • Identify which ‘x’ variables contribute most to your process problem
  • Based on their potential impact on the output, prioritize the root causes for further investigation and improvement.

This stage is all about gathering clues for improvement and pinpointing the most important drivers of your outcome. To identify the root causes of output variations, you can use tools like fishbone diagrams, 5 Whys, or failure mode and effects analysis (FMEA).

Spot potential risks quickly and create a plan of action with the ClickUp Process FMEA Lean Six Sigma Template

ClickUp’s Process FMEA Lean Six Sigma Template is designed to help you identify potential risks and control processes.

This comprehensive template makes it easy to:

  • Identify potential process risks quickly and accurately
  • Understand which areas need improvement
  • Create an action plan for improvement 

Step 4. Improve: Developing solutions and testing 

With a clear understanding of your ‘Y’ and key ‘x’ variables, you’re ready to move into the Improve stage.

In this stage, you will:

  • Brainstorm creative solutions based on what you’ve learned about the process. These solutions should aim to modify the inputs (x) to achieve the desired output (Y).
  • Develop and test these solutions using experiments or pilot programs in a controlled environment
  • Focus on solutions that truly address your key ‘x’ variables and help improve ‘Y’
  • Aim for verifiable improvement through measurement

Step 5. Control: Optimizing outcomes

The Control stage is where DMAIC really shines. It’s about ensuring your improvements stick and lead to long-term success. To do this:

  • Create a process management chart to visualize the new process flow
  • Identify critical checkpoints in the process
  • Monitor both ‘x’ and ‘Y’ over time to ensure sustained improvement
  • Set up control measures to maintain the improved performance and prevent regression to the previous stage

By following these steps, you’re not just implementing Y=f(x); you’re creating a system for ongoing optimization and success in your projects.

Summarize this article with AI ClickUp Brain not only saves you precious time by instantly summarizing articles, it also leverages AI to connect your tasks, docs, people, and more, streamlining your workflow like never before.
ClickUp Brain
Avatar of person using AI Summarize this article for me please

Best Practices for Y=f(x) in Project Management

To make the most of Y=f(x) in project execution, you must follow some key practices. These will help you leverage this powerful tool effectively and achieve your project management KPIs.

Selecting appropriate metrics

When implementing Y=f(x), it’s crucial to choose the relevant data and the right metrics. Start by clearly defining your project goals. Ask yourself what specific insights or outcomes you’re aiming for. This will guide your selection of data and visualization techniques.

Remember, Y=f(x) is all about understanding the relationship between inputs (x) and outcomes (Y). To do this effectively:

  • Use statistical processing software to examine how specific input combinations impact the results
  • Include as many significant inputs as possible that are connected to the results

By setting up the formula correctly, you’ll be better equipped to select the right tools to verify X-Y relationships. This approach helps you understand cause and effect, measure performance, and identify areas for improvement in your projects.

Leveraging data visualization

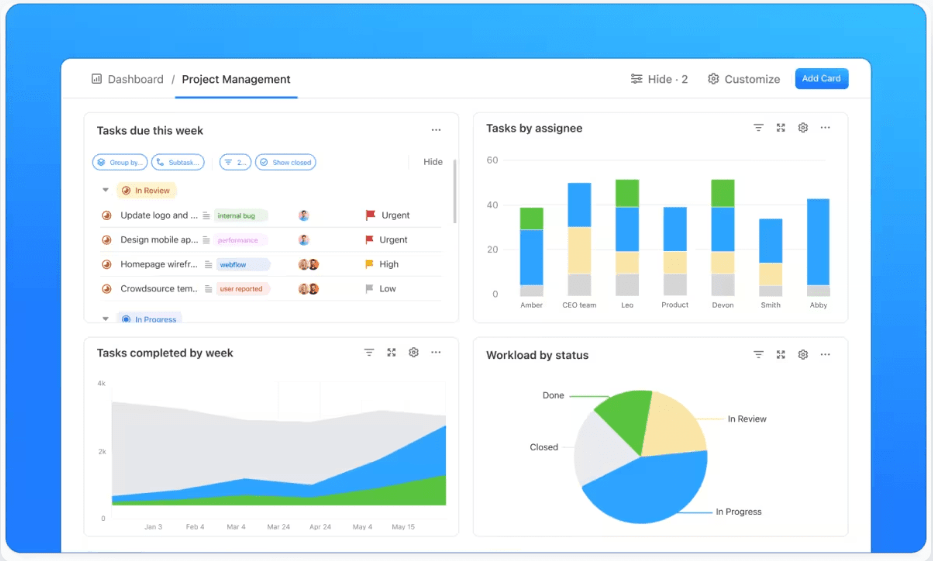
Data visualization is a powerful ally when working with Y=f(x). It’s a blend of art and science that can significantly enhance your project management efforts. Here’s how to make the most of it:

  • Know your purpose: Decide if you’re using visualization for analysis or presentation. This will guide your approach 
  • Understand your audience: Customize your visuals to your team’s needs, interests, and expertise level 
  • Choose the right chart type: Select visuals that resonate with your audience and empower them to explore data, identify insights, and make decisions

Effective visualizations simplify complex data sets. They allow you to quickly spot patterns, trends, and outliers in the collected data, leading to more informed decisions.

Targeting continuous improvement 

Y=f(x) isn’t just a one-time tool; it’s a framework for ongoing optimization. Here are some strategies to ensure continuous improvement:

  • Use it at all stages of problem-solving: Apply Y=f(x) from the beginning to ensure you’re working on the right problem with the correct formula. 
  • Follow the DMAIC roadmap: The structured approach we explained earlier aligns perfectly with Y=f(x)
  • Create a process management chart: This helps visualize the new process flow after improvements. Identify critical checkpoints and set up actions for when the process strays from the plan.
  • Collect and validate data: Ensure your data is accurate, consistent, and organized in a format suitable for visualization. This is crucial for reliable and meaningful insights.
  • Regularly interpret and analyze: Take time to interpret your visualizations and identify actionable insights. This ongoing process keeps your project on track and responsive to changes.

💡Pro Tip: The AI Project Manager in ClickUp helps you analyze data from multiple sources and identify any variance or outliers. Set up an automation to notify your team when a process requires attention.

By implementing these best practices, you’ll be able to harness the full power of Y=f(x) as a tool for continuous improvement, data-driven decision-making, organizational strategy, and project success.

Summarize this article with AI ClickUp Brain not only saves you precious time by instantly summarizing articles, it also leverages AI to connect your tasks, docs, people, and more, streamlining your workflow like never before.
ClickUp Brain
Avatar of person using AI Summarize this article for me please

How to Manage Y=f(x)-Based Projects With ClickUp

Managing projects effectively requires a versatile tool that can adapt to the dynamic nature of project management. ClickUp is an all-in-one project management tool offering an integrated approach to managing Y=f(x)-based projects, making it an indispensable asset for project managers.

By leveraging its extensive features, project managers can ensure that every variable is accounted for, optimized, and aligned with the desired outcome.

ClickUp's Project Management platform for efficient Y=f(x) application
Simplify project workflows efficiently with ClickUp’s project management platform

Benefits of using ClickUp for Y=f(x)-based projects

While there are many advantages of using ClickUp for managing Y=f(x)-based projects, here are some of the primary benefits:

  • Centralized control: Keep all your project variables and outcomes in one place, making it easier to see the big picture and make informed decisions
  • Flexibility: Adapt and customize the platform to fit your project’s unique needs, regardless of industry or scope
  • Real-time collaboration: Collaborate with team members on tasks and documents in real time, ensuring immediate feedback and collective problem-solving
  • Improved efficiency: Get more done faster with the integrated AI and automation features in ClickUp 

Here are some ways you can use ClickUp’s capabilities to execute your Y=f(x) project management strategy:

Executing Y=f(x): Set clear, measurable outcomes (Y) for your project with ClickUp Goals
Set and track your project objectives (Y) with ClickUp Goals
  • Goal setting: Set clear, measurable outcomes (Y) for your project with ClickUp Goals and track progress towards achieving them
  • Workflow automation: Streamline processes by automating repetitive tasks and tedious workflows using ClickUp Automations to reduce the risk of human error and save time
  • Task visualization: Visualize your project data in multiple ClickUp Views, from simple lists to complex Gantt charts
  • Integrated AI: Leverage ClickUp Brain to predict task durations, set realistic deadlines, and warn you when they approach
  • Progress tracking: Get a high-level overview of your project’s health and performance indicators with customizable ClickUp Dashboards
  • Templates: Utilize ClickUp’s pre-built project management templates to apply structured improvement methodologies to your projects.
Define, Measure, Analyze, Improve, and Control your processes easily with the ClickUp DMAIC Template

ClickUp’s DMAIC Template helps you manage and track a DMAIC (Define, Measure, Analyze, Improve, Control) project. This Whiteboard template will ensure you adopt a systematic approach to improving processes and increasing efficiency. Use it to:

  • Set objectives and define project scope
  • Identify and track key metrics
  • Analyze data, determine root causes, and implement changes
  • Gain insights with continuous reporting

Managing and optimizing ‘x’s in Y=f(x) with ClickUp

With ClickUp, you can meticulously manage your project process and optimize the ‘x’s—the various inputs and factors that influence your project’s success. Here’s how:

  • Task management: Break down your variables (x’s) into actionable steps in ClickUp Tasks, assign tasks to relevant team members, and stay on top of team activities
  • Custom fields: Tailor your tasks and data points to include all relevant ‘x’s, ensuring comprehensive tracking and analysis.
  • Dependencies: Define relationships between tasks so that changes in one area automatically update related areas, maintaining alignment with your Y=f(x) strategy
  • Milestones: Turn critical tasks into project milestones that you can track to be in control of project progress

Using ClickUp as an effective project management tool

ClickUp goes beyond traditional project management software by offering a suite of features that facilitate not just management but also collaboration and communication:

ClickUp Chat
Connect with your team members in real time with ClickUp Chat
  • Scoping: Collect and compile detailed project requirements from all stakeholders using customizable ClickUp Forms, and turn submissions into trackable tasks
  • Planning: Ensure watertight project plans by involving stakeholders and team members in brainstorming and finalizing project details with ClickUp Whiteboards and ClickUp Mind Maps
  • Decision-making: Make better decisions with one single source of truth for all your data in ClickUp Dashboards, which you can customize with widgets to match your requirements
  • Collaboration: Enhance team collaboration with built-in messaging with ClickUp Chat, collaborative document editing and sharing with ClickUp Docs, and real-time notifications, ensuring everyone is on the same page
  • Integrations: Leverage ClickUp’s 1000+ integrations to connect the other tools you use, creating a unified system for all your project management activities

ClickUp is where tasks, documents, goals, and communication converge to create a seamless workflow. It equips you to navigate the complexities of project management with confidence and precision. 

Summarize this article with AI ClickUp Brain not only saves you precious time by instantly summarizing articles, it also leverages AI to connect your tasks, docs, people, and more, streamlining your workflow like never before.
ClickUp Brain
Avatar of person using AI Summarize this article for me please

The Practical Application of Y=f(x) in Project Management

The Y=f(x) formula isn’t just a theoretical concept; it’s a practical tool that can be applied to the day-to-day operations of project management. By integrating this formula into various aspects of project work, managers can enhance decision-making, streamline strategic management, and leverage data for predictive modeling.

Y=f(x) in decision-making and strategic management

Incorporating Y=f(x) into decision-making processes means that every choice is backed by an understanding of how different factors will impact a project’s progress and outcomes. Here’s how you can apply it:

  • Strategic planning: Use Y=f(x) to set clear objectives (Y) and identify which variables (x) will contribute to achieving these goals. This could involve resource allocation, timeline adjustments, or scope modifications.
  • Risk assessment: Estimate the potential impact of a risk (Y) based on its probability (x) and severity. This proactive approach allows for the development of contingency plans and risk mitigation strategies.
  • Performance tracking: Monitor ongoing projects by measuring ‘Y’ against expected results. If ‘Y’ is not meeting targets, use Y=f(x) to investigate which ‘x’ needs tweaking
  • Cost control: Analyze the relationship between project costs (Y) and factors such as resource utilization (x) and scope changes
  • Change management: Assess the potential impact of a change (Y) based on its scope (x) and complexity.

By embedding Y=f(x) into the strategic management process, project managers can ensure that their decisions are data-driven and aligned with project goals.

Y=f(x) in data analysis and predictive modeling

Data analysis and predictive modeling are critical components of modern project management. Y=f(x) provides a framework for these activities:

  • Historical data analysis: Look at past projects to understand how different ‘x’s influenced ‘Y’. This historical perspective can inform future project planning and execution
  • Earned value management (EVM): Calculate the project’s earned value (EV) based on the percentage of work completed (x)
  • Predictive modeling: Use statistical tools to model how changes in ‘x’ will likely affect ‘Y’. This can help forecast project outcomes and set realistic expectations.
  • Continuous improvement: Apply Y=f(x) to iterative cycles of testing and refinement. By analyzing the effects of incremental changes to ‘x’, you can continuously improve project performance.
  • Quality control: Evaluate the quality of a product or service (Y) based on inspection results (x)

Leveraging Y=f(x) in data analysis and predictive modeling turns raw data into actionable insights, enabling project managers to anticipate and shape the future of their projects.

Summarize this article with AI ClickUp Brain not only saves you precious time by instantly summarizing articles, it also leverages AI to connect your tasks, docs, people, and more, streamlining your workflow like never before.
ClickUp Brain
Avatar of person using AI Summarize this article for me please

Implement Y=f(x) for Project Management Success With ClickUp

Y=f(x) is a powerful tool that has a significant impact on project management success. The concept helps project managers better understand the relationship between inputs and outcomes. This enables them to better plan future project proposals, set relevant goals, and improve performance measurement. 

The DMAIC framework provides a structured approach to implement Y=f(x), guiding projects from defining goals to controlling processes for long-term success.

To make the most of Y=f(x), it’s crucial to choose the right project metrics, effectively use data visualization, and focus on ongoing improvement. Integrated project management software such as ClickUp offers a range of features that help you do all this and more. Rely on it to reach peak efficiency, drive innovation, and achieve better results in your projects.

Get a free ClickUp account today.

Questions? Comments? Visit our Help Center for support.

Sign up for FREE and start using ClickUp in seconds!
Please enter valid email address