

If you have a penchant for process improvement—you’ve most likely heard of Lean Six Sigma tools.
Lean Six Sigma methodology can be a powerful enabler in improving your business processes. But there’s a catch. If you’re new to the methodology, it can be pretty overwhelming. The details might confuse you, or you might feel stressed by the data you need to analyze.
Fret not. In this post, we’ll break down Lean Six Sigma and ten tools and the business processes they’re suited for to skyrocket process efficiency. ⚒️
When implemented well, these tools effectively reduce process variability and create a culture of continuous improvement.
10 Six Sigma Tools for Business Process Improvement | ClickUp
What are Six Sigma Tools?
Six Sigma tools are analytical and process improvement methodologies that reduce process variability and ensure higher quality levels in output.
Developed in the 1980s by Motorola engineer Bill Smith, the Six Sigma approach was initially used to improve the throughput of manufacturing processes. Over time, industries like education, healthcare, and services have adopted this approach.
The core objective of Six Sigma is to identify defects and spot the underlying causes of process variations. The associated tools implement consistent quality improvements by pinpointing process issues.
Leveraging these methods enables organizations to deliver with precision, improve reliability, and shrink process cycle times.
10 Six Sigma Tools and Techniques to Improve Business Processes
Here are 10 reputed lean Six Sigma tools to improve your organization’s quality assurance processes and operational efficiency:
1. Plan-Do-Check-Act (PDCA)
This iterative four-phase model helps organizations promote ongoing quality control and continuous learning. The PDCA cycle is now a fundamental element of the Six Sigma methodology, improving lean manufacturing and quality control across industries.
- Planning: The planning phase identifies a problem or opportunity for improvement within a process. This stage gathers data to assess present performance and define the project’s process optimization scope
- Doing: This stage implements the strategies on a small scale and evaluates the outcomes of the former stage against the expected results. It is a controlled experiment with precise documentation
- Checking: At this point, your team will verify whether the implemented changes led to a measurable improvement
- Acting: This phase executes the changes on a larger scale and incorporates feedback from previous phases. Successful trial runs standardize your new process
When to use this tool: PDCA can be applied to software development processes. By addressing feedback effectively, you can ensure that each iteration meets or exceeds customer expectations.
ClickUp’s Whiteboard feature offers a fully customizable canvas for brainstorming, strategizing, and mapping business processes. You can also use it to manipulate agile workflows and categorize sub-tasks and root causes of process inefficiencies.
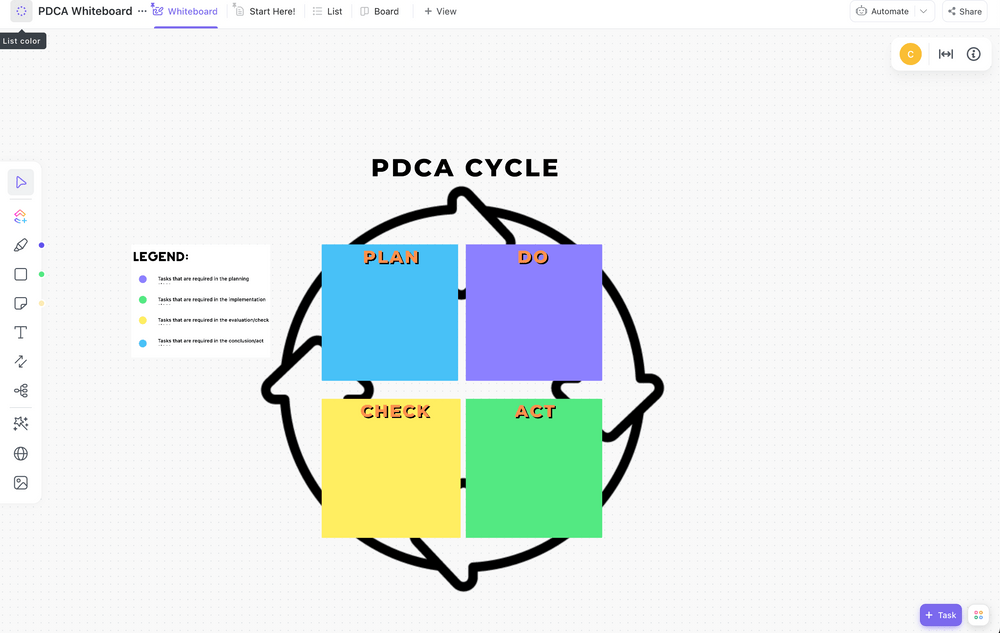
ClickUp’s PDCA Process Whiteboard Template lets you brainstorm prospective solutions and track plan iterations and results. This structured template allows you to organize your process into specific tasks and use different statuses to keep your team updated on the progress.
2. Value Stream Mapping (VSM)
A value stream is the order of internal and external tasks typically used to deliver products or services to clients. The value stream mapping (VSM) process helps visualize and analyze the flow of materials and information as a product moves across the value stream.
Its primary goal is to identify waste and inefficiencies through end-to-end process visualization.
- Start by mapping the present state: This step creates a baseline for measurement improvements and offers insights into existing systems’ workflows or bottlenecks
- Identify potential problems: This could be wasted resources like overproduction, waiting time, overprocessing, defects, and underutilized talent
- Design a future workflow: The third step involves envisioning a workflow with minimal wastage. This step includes everything from process redesign to work cell organization
- Implement your changes: At this stage, you can expect investments in new technology or training new personnel in the implementation phase
When to use this tool: VSM works well in manufacturing and logistics when mapping the production process. You can pinpoint delays and non-value-added activities from raw materials to customer delivery.
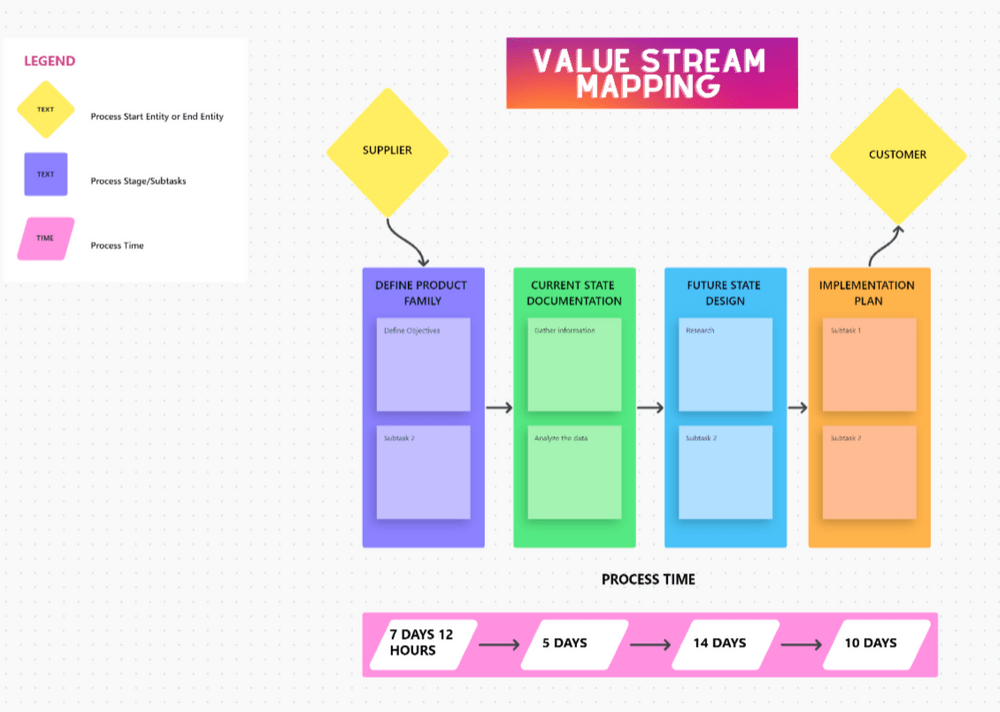
ClickUp’s Value Steam Mapping Template allows your team to continuously monitor and refine processes after upgrading the current state maps. This iterative process helps you brainstorm ways to improve your existing processes, sustain your improvements, and remain agile when responding to dynamic market conditions.
3. Cause and Effect Diagram
Commonly called a fishbone or Ishikawa diagram, this template can help spot root causes of process inefficiencies by mapping relationships between different factors.
You start by defining the problem at the head of the fishbone and circling it for focus. Next, draw a straight line (backbone) from the problem statement to the left side of the whiteboard. This line represents the linkage between causes and effects.
Further on, you can categorize the causes of the problem. These ribs of the fishbone often include issues related to workforce, materials, methods, machines, or measurements.
Consider adding specific branches for each major category. Besides listing particular causes, you can encourage teammates to share ideas on these branches. Feel free to add sub-branches for ultra-specific causes. Use free project management software like ClickUp to create diagrams that break down your process improvement methods.
When to use this tool: This tool is effective in healthcare settings to analyze adverse events or in customer service to resolve recurring issues affecting client satisfaction.
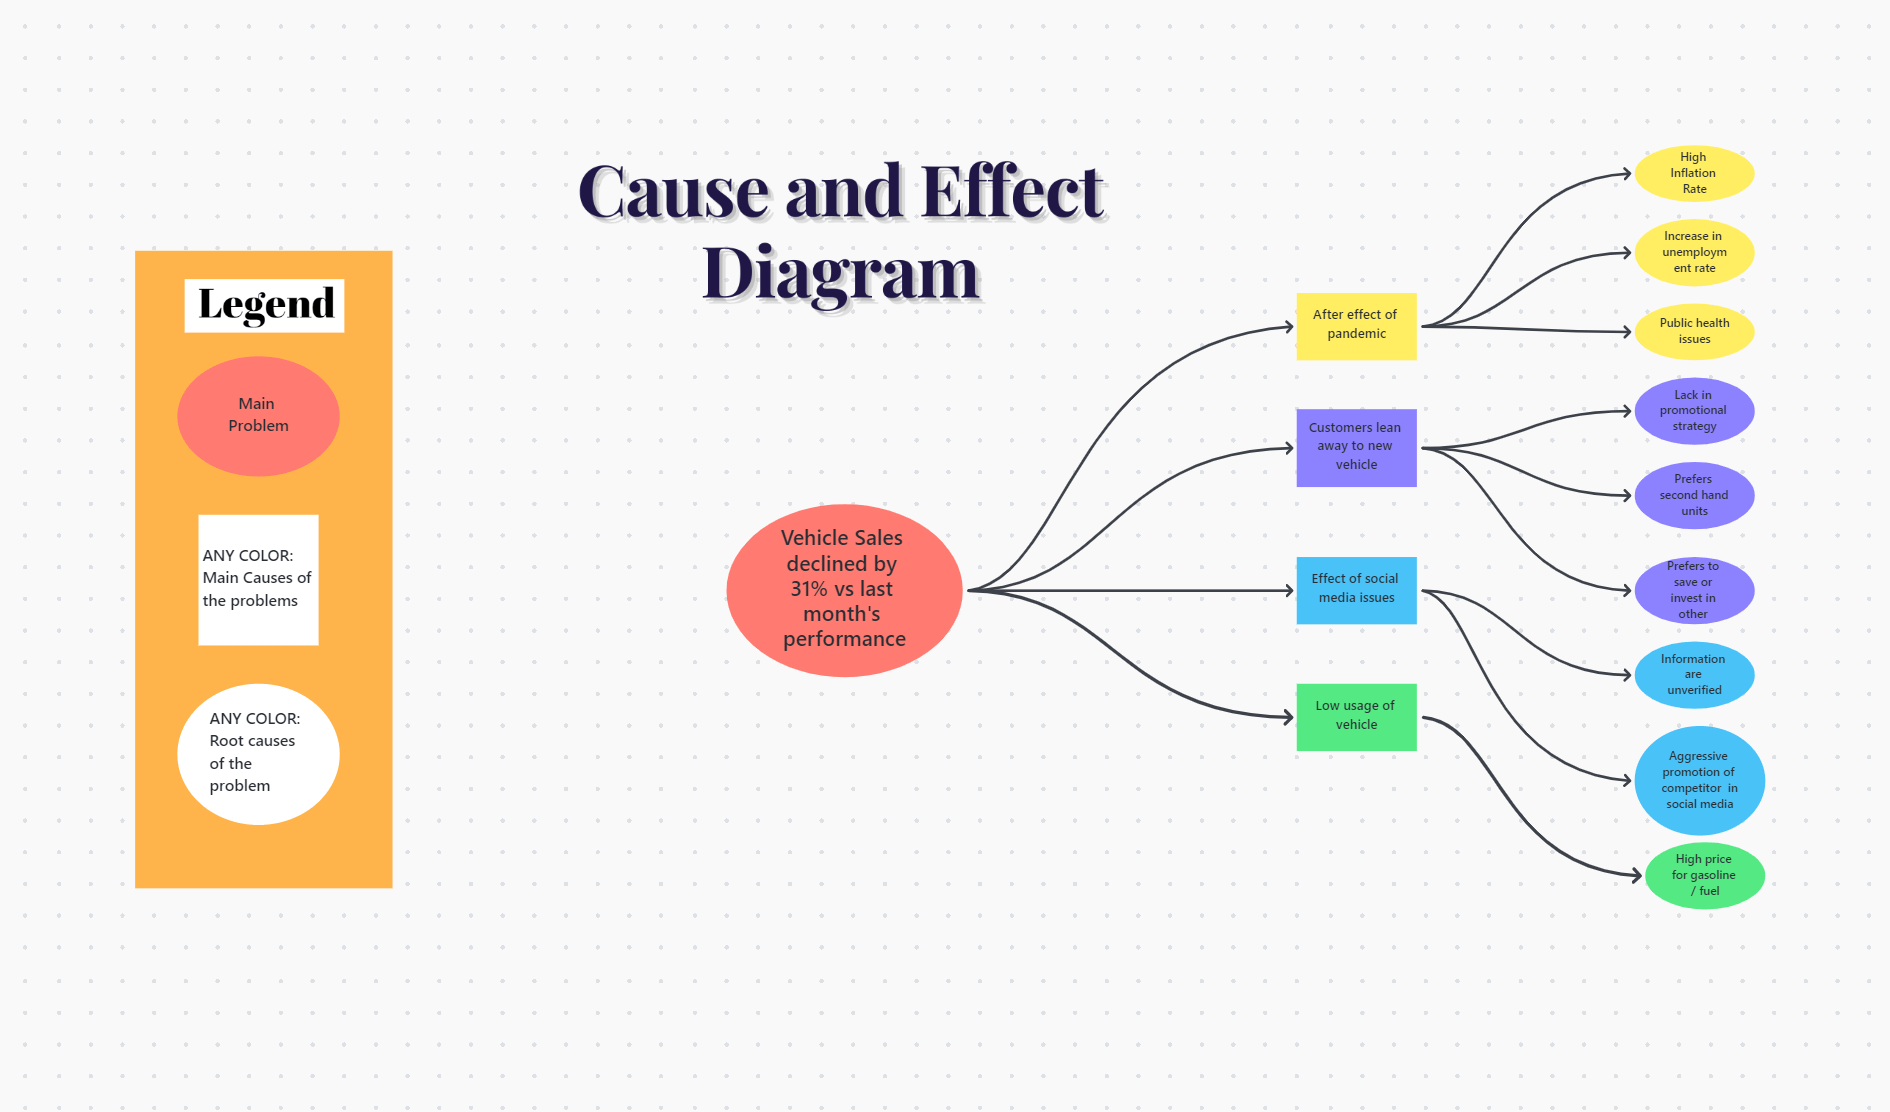
ClickUp’s Cause and Effect Whiteboard Template lets you list and review the relationships between your problems and their potential causes. You can use digital markers to highlight key issues and engage in discussions to investigate them further. Once the diagnosis is complete, you can determine tailor-made action steps to address each root cause by building out a ClickUp workflow of your choice.
4. The Five Whys
This Six Sigma tool explores the root causes of a process problem by asking ‘Why’ five times or as many times as needed.
Continuously asking ‘Why’ to each last answer related to diagnosing the problem brings you closer to the root cause.
Your goal here is to peel away layers of the symptoms and assumptions to uncover what’s fundamentally causing the problem. Once the problem is identified, it’s easier to develop tailored countermeasures.
For example, assume that you have a problem retaining employees. Using the five whys method, identify the root cause of the problem.
Problem: Poor employee retention rate.
- Why: Work schedules weren’t flexible
- Why: The scope of projects isn’t clear
- Why: Product briefs weren’t shared on time
- Why: Poor productivity from client-side
- Why: Lack of resources to collect and share complete product information
From these causes, it’s clear that the problems stem from the client’s inability to share comprehensive product briefs on time. Addressing this earlier in the workflow could help your employees work as per plan and improve their job satisfaction.
This lean Six Sigma tool offers simplicity, efficiency, and effectiveness when separating symptoms from the problem’s root cause.
When to use this tool: The five whys are best used in situations requiring root cause analysis, particularly when issues are complex and layered. Consider using this Six Sigma tool in operational environments to understand the reasons for machine failure or process disruptions.

ClickUp’s 5 Whys Template allows faster team collaboration and a repeatable methodology for resolving inefficiencies. Once you identify the root causes of process variabilities, jump straight into problem-solving by creating and assigning specific tasks to your team members.
5. FMEA
Failure Modes and Effects Analysis (FMEA) is best for listing all possible failures in a design, a manufacturing or assembly process, a product, or a service.
It’s designed to spot potential failure points and enable companies to take corrective actions through early detection. You can use FMEA to prioritize issues based on their impact and likelihood to occur.
Begin by assembling a cross-functional team with knowledge of the process being analyzed. This introduces several perspectives on potential failures.
Once you define the product, process, design, or service being analyzed, list each step or component and map ways in which failure could occur. These are your failure modes.
Each failure mode is scored to reflect its severity (S), occurrence (O), and detectability (D). The Risk Priority Number (RPN) is calculated by:
RPN = S x O x D
Use this RPN to prioritize failure modes based on what impacts product functionality the most.
When to use this tool: It suits new or existing process risk assessment, especially before product or process launches. It’s extensively used during design and development in the automotive and aerospace industries to prevent future failures and enhance reliability.

ClickUp’s FMEA Lean Six Sigma Template clarifies which sub-processes or components need improvements to avoid unexpected inefficiencies. Its various views help you organize risks by severity and by frequency.
6. Kanban
Kanban boards are powerful visual tools in lean management to optimize business processes. They allow users to visualize tasks, limit work in progress, and maximize flow to repair process inefficiencies and operational effectiveness.
First, map out key business processes and classify each process into distinct stages. The former includes factors like product delivery or customer onboarding, and the latter can include ‘Request Received,’ ‘Quality Check,’ or ‘Processing’, etc.
Set up your Kanban board with columns for each stage. This visual layout will show you how your tasks progress, allowing you to spot bottlenecks efficiently.
Don’t forget to mention the maximum number of tasks (WIP limits) that can be handled simultaneously. This is crucial to identify blockages and address them proactively.
Overall, its dynamic task management reveals real-time feedback on the process flow and highlights all delays. The architecture of this Six Sigma tool helps make process adjustments by reallocating resources. You can also try redefining process steps to cut down on inefficiencies.
When to use this tool: Kanban suits software development and editorial content teams to manage projects, regulate workflow, and limit work-in-progress visually.
For instance, ClickUp’s Kanban Board feature lets you visualize workflow stages clearly and track real-time progress. Merging these capabilities with Six Sigma’s data-driven approach is perfect for error-proofing small-scale and large-scale processes.

ClickUp’s Kanban Board Template breaks down larger tasks into more achievable sub-tasks and offers insights into your team’s capacity. It can reduce task cycle durations significantly and maximize the ROI on your resources.
7. Pareto chart
Pareto charts are a type of bar graph representing the frequency or impact of problems or causes in a process. The 80/20 Pareto principle suggests that 80% of all problems are due to 20% of the causes.
The chart assists you in separating the ‘vital few’ from the ‘trivial many’ causes of a problem. This lets you address high-impact issues from the beginning.

Your first two steps include data collection and categorization. Once the problems are categorized, you must tally the frequency of occurrence for each category. Now, you rank the categories based on high to low occurrence. Next, calculate the cumulative percentage of total defects or causes accounted for by each category.
Finally, plot the categories on the chart’s horizontal axis and the frequency on the vertical axis.
The Pareto Chart helps your business process improvement goals by:
- Measuring and comparing problems
- Identifying focus areas
- Allocating resources effectively
- Iterating for improvements
When to use this tool: It helps in software development by prioritizing which bugs or features to address first based on their frequency and user impact.
8. Takt time
Takt time is a fundamental concept that synchronizes production rates with customer demand, creating a smooth, continuous flow of operations.
Takt time helps you set the production pace to match the rate at which products are needed. With Takt time, you can expect high production efficiency and lower waste and inventory costs.
Takt Time = Total available production time / Customer demand
For example, if a factory operates for 960 minutes/day and the customer demand is 320 units/day, the takt time is:
Takt Time = 960 minutes / 320 units = 3 minutes / unit
In business process improvement, takt time is suitable for adjusting the speed of operations by balancing workloads or reconfiguring production lines. You can monitor production metrics to check whether any steps don’t meet the takt time.
When to use this tool: This works best in the consumer electronics manufacturing sector. It helps align production speed with market demand to avoid overproduction and reduce inventory costs.
9. Poka-Yoke
A Japanese term for ‘mistake-proofing,’ Poka-Yoke builds fail-safes into processes to avoid and correct mistakes at the source before they become defects. This Six Sigma tool makes it virtually impossible for errors to occur.
Like most Six Sigma techniques, you start by analyzing the process and spotting common error points. These might be due to human mistakes like forgetfulness or incorrect assumptions.
Further, it analyzes errors caused by the process’s design, interface, or interaction between the employee and the process.

The most important part is developing a Poka-Yoke solution that prevents errors or makes it immediately apparent if an error arises. Here are three core types of Poka-Yoke:
- Contact type: Identifies product defects by testing physical attributes
- Fixed-value type: Ensures a specific number of movements or actions are made
- Motion-step (sequence) type: Checks the proper sequences of action and verifies whether they are completed as per the correct order and without omission
You can test additional process improvement templates to merge any two of the above techniques and perform A/B testing.
When to use this tool: Widely used in automotive manufacturing, Poka-Yoke ensures parts are installed correctly, preventing assembly errors and improving product quality.
10. SIPOC
This is an acronym for Suppliers, Inputs, Processes, Outputs, and Customers. SIPOC helps your team visualize the context, scope, and key stakeholders involved. Use this lean Six Sigma type to ensure that subsequent analyses or changes are well-targeted and relevant.

Describe the process you want to improve in five to seven high-level steps. Next, map out the five components of SIPOC.
- Suppliers provide input to the process. This could be internal teams, external vendors, or systems
- Inputs list the materials, information, or other resources that help execute the process
- The process includes the critical steps of the task, from start to finish. Remember to make this a high-level overview, not a detailed process map
- Outputs define what the process produces. These are the results or produce that came from the process
- Customers are those who receive your outputs. Note that customers can be internal or external to the organization
You can create a simple SIPOC table or diagram that describes the flow from suppliers to customers through the process. Try working with different SIPOC Diagram templates to better understand several utility styles.
When to use this tool: This tool is suitable for service industries like hospitality or banking to map out customer service processes. It helps identify what elements affect customer experiences.
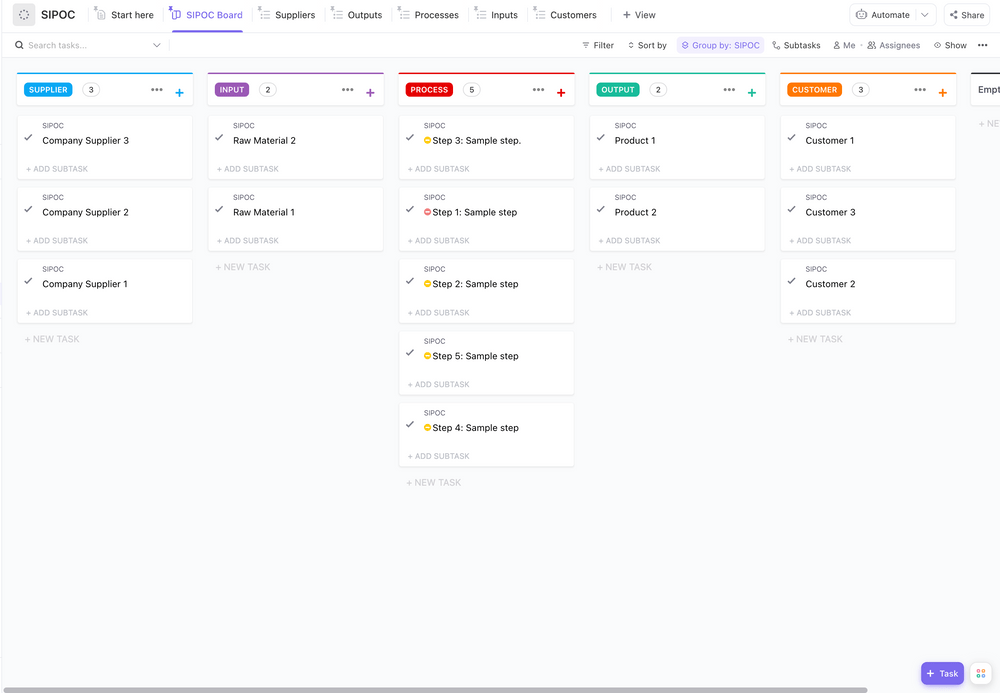
ClickUp’s SIPOC Template lets you set systematic processes for your supply chain without wasting time and resources on redundant tasks. It informs your team of a process scope through separate views like supplier, process, input, and output to help locate inefficiencies faster.
Your Path to Operational Excellence
These Six Sigma tools mark a strategic enhancement in your business or team’s approach to process improvement. In addition to optimizing individual processes, they empower teams to adopt a rewarding culture of continuous improvement.
Embedding these tools into daily operations sets your organization up for sustained gains in productivity and quality. If you’re wondering where to start, try integrating Six Sigma templates within ClickUp to make your business processes more reliable and less prone to mistakes.
Sign up for ClickUp today and promote a culture of continuous improvement.
Common FAQs
1. What are Six Sigma tools?
Six Sigma tools improve business processes by minimizing errors. Some of them include the Fishbone Diagram (to identify root causes), Pareto Chart and FMEA (to target critical improvement areas), the 5 Whys (to drill downwards to the problem’s source), Control Charts (to monitor variability), and PDCA (for iterative planning).
2. Is Six Sigma a Lean tool?
Six Sigma tools are often associated with Lean as both aim to improve business efficiency. Lean focuses on eliminating waste and enhancing the flow of production processes to improve efficiency. On the other hand, Six Sigma reduces variation and defects to improve quality.
3. Is Six Sigma a quality tool?
Yes, Six Sigma is fundamentally a quality improvement tool designed to reduce process variation and improve output quality. It can use statistical tools to achieve and maintain a process defect level of no more than 3.4 defects per million opportunities.


Everything you need to stay organized and get work done.

Recent Articles
Claude Skills for Project Management: A Practical Guide 
Claude Skills for Project Management: A Practical Guide
How to Write a Scope of Work (+ Examples & Templates)
How to Write a Scope of Work (+ Examples & Templates)
What Are Project Goals? Definition, Examples & How To Write Them 
What Are Project Goals? Definition, Examples & How To Write Them
