There may be hundreds of processes involved in getting a product or service ready for the customer—some are essential, while a few are totally avoidable. The vital question is: How do you differentiate between value-adding and non-value-adding processes?
Value stream mapping can help you scratch below the surface and get a good look at your delivery cycle. First implemented by Toyota, this tool helps you create a diagram depicting flows of materials, information, and processes to pinpoint unoptimized areas.
It’s a strenuous, complicated exercise, especially if your production cycle is lengthy and with many moving components. That’s why top managers rely on templates to easily visualize process flows.
In this article, we’ll introduce you to the best value stream mapping templates to improve efficiency, reduce waste, and deliver better value to your customers.
- What Is a Value Stream Mapping Template?
- What Makes a Good Value Stream Mapping Template?
- 10 Value Stream Mapping Templates to Use
- 1. ClickUp Value Stream Mapping Template
- 2. ClickUp Automated Value Stream Map Whiteboard Template
- 3. ClickUp Value Chain Whiteboard Template
- 4. ClickUp Value Risk Matrix Template
- 5. ClickUp Process Audit and Improvement Template
- 6. ClickUp Business Process Improvement Project Charter Template
- 7. ClickUp Process Mapping Template
- 8. ClickUp Process Improvement Project Charter Template
- 9. Value Stream Mapping Template by 24Slides
- 10. Value Stream Map Template by VisualParadigm
What Is a Value Stream Mapping Template?
Value stream mapping (VSM) is a visual tool for analyzing current workflows that get you from product order to delivery. This involves representing the movement of information, materials, and processes through your company using complex flowcharting techniques.
A value stream mapping template simplifies the diagramming exercise by providing a preset framework for illustrating, examining, and improving your production processes. The idea is to identify and minimize resource-wasting or inefficient steps and optimize your production logistics for goals like better yield, reduced time to market, or enhanced customer satisfaction.
Value stream maps are suitable for visualizing processes at any scale, whether prototyping or mass production. Besides fine-tuning your production system, they can encourage:
- Cross-functional collaboration
- Cost reduction
- Data-driven decision-making
- Customer satisfaction measures
What Makes a Good Value Stream Mapping Template?
Since there are thousands of value stream mapping templates available, finding the right one is no cakewalk. Here are a few characteristics a good template should have:
- User-friendly interface: A quality template should offer a simple interface that allows people with different education levels and expertise (product managers, technicians, operators, etc.) to use it
- Collaboration options: Value stream mapping typically involves people from several teams working together. The right template should offer collaboration features that make this possible, including digital whiteboards, real-time editing, and note-taking and commenting tools
- Visual tools: The template should let you use value stream map-specific shapes for visualizing processes and flows (like a factory icon for suppliers or customers and stripes for shared processes)
- Drag-and-drop design: It should have connectors and a drag-and-drop editor to establish relationships between different elements in the flowchart
- Resource allocation support: The template should offer a clear view of time, personnel, and budget restrictions to facilitate data-backed resource allocation decisions
10 Value Stream Mapping Templates to Use
We’ve sifted through hundreds of value stream mapping templates and shortlisted the top 10 from ClickUp, 24Slides, and VisualParadigm, which offer the most functionality. Check them out and find the one that suits your value stream mapping preferences!
1. ClickUp Value Stream Mapping Template
It’s hard not to be subjective when identifying waste in your company—you’re accustomed to the current processes and may not see room for adjustments. The ClickUp Value Stream Mapping Template lets you gain an objective perspective into workflows by gathering people from multiple teams and using visual aids.
This is a Whiteboard template—think of it as a digital canvas where your teammates can share their perspectives and work together on visualizing and solving problems. ClickUp Whiteboards have built-in tools for connecting ideas and linking them to tasks, Docs, and files to centralize work.
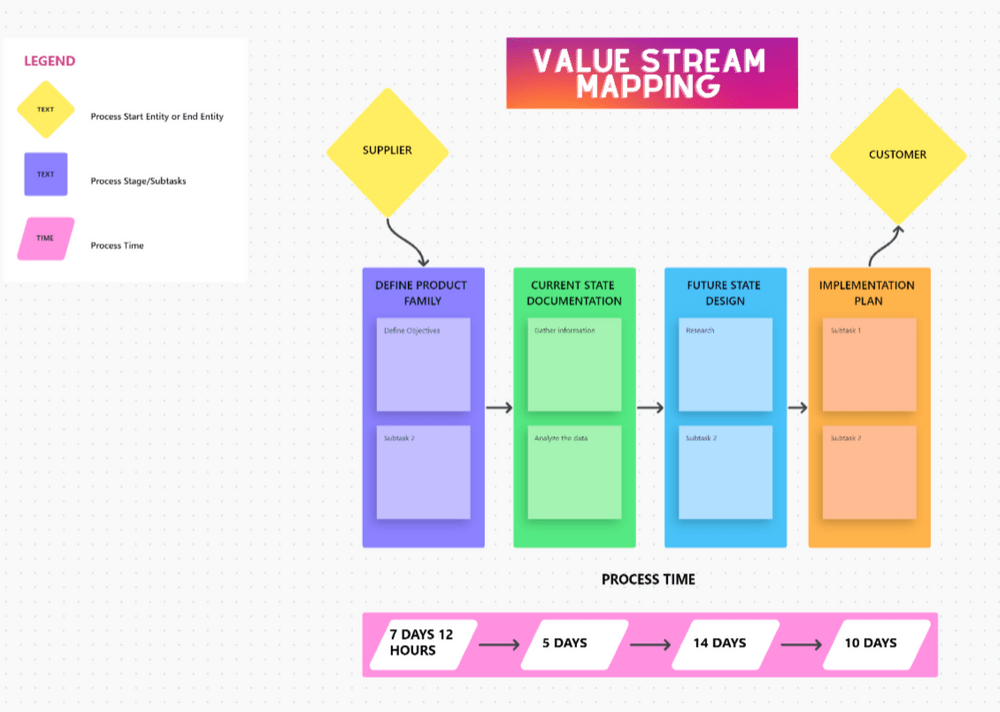
With this template, you get a ready-made map to analyze the current state of your processes. The Whiteboard view offers four color-coded sections—Define Product Family, Current State Documentation, Future State Design, and Implementation Plan. Customize the process Start and End nodes (yellow diamonds denote the supplier and customer endpoints) and define the timeline across stages.
The tool lets you leave notes, attach files, and define objectives to outline your supply and delivery logistics. You can create and assign improvement tasks right within the template.
ClickUp Whiteboards come with task tracking and reporting features, making it easy to establish accountability for fixing a certain value stream map process inefficiency.
2. ClickUp Automated Value Stream Map Whiteboard Template
Want to precisely identify improvement opportunities and take the guesswork out of the value stream mapping equation? Rely on the ClickUp Automated Value Stream Map Whiteboard Template to lend a helping hand!
Given that this is a value stream mapping analysis template like the previous option, it’s packed with perks that encourage collaboration and teamwork. Options like real-time editing, leaving notes, and connecting to tasks and Docs leave plenty of room for brainstorming process bottlenecks.
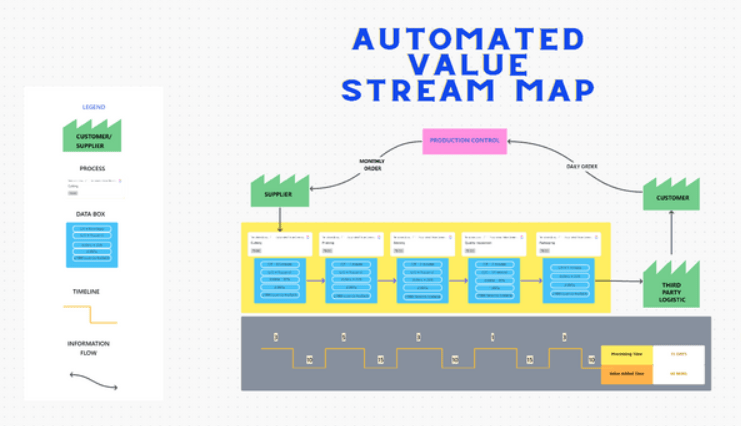
This is an industry-standard template with the regular value stream mapping factory symbols, data blocks, and timeline and information flow connectors to position your processes end to end. Get your operation managers on board the template to visualize and discuss the latest elements in your processing cycle.
By default, the template has nine Custom Fields for adding attributes to your processes:
- Seconds Available
- Department
- Cycle Time (mins)
- Processing Time (days)
- Value Added Time (mins)
- Uptime (%)
- Worker
- Shifts
- Change Overtime (mins)
The template has two views—the Whiteboard view for brainstorming and the Processes view for recording and monitoring all ongoing processes in one place.
3. ClickUp Value Chain Whiteboard Template
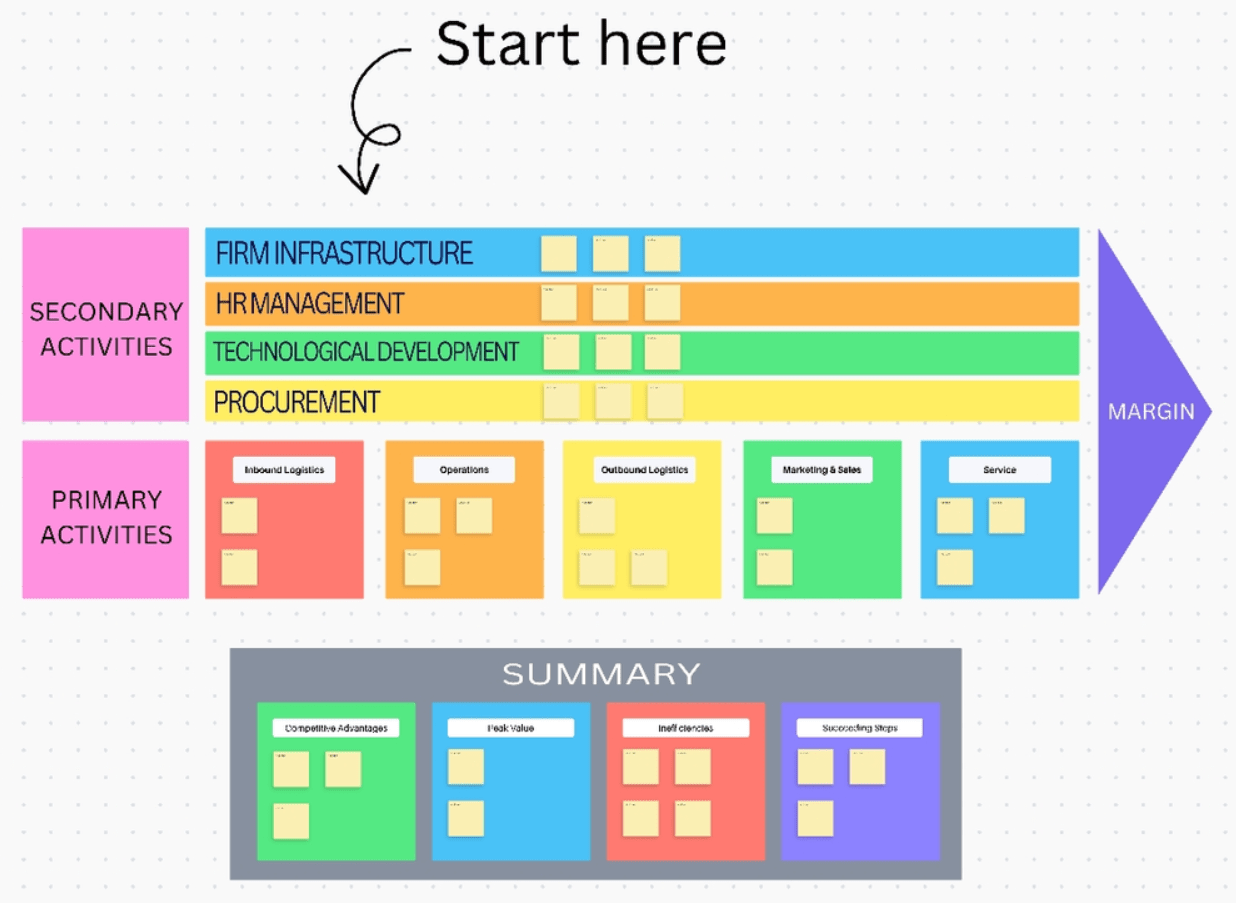
A value chain network represents the progression of primary and supporting activities that bring value to a product. You can do that with the ClickUp Value Chain Whiteboard Template, which allows micro-analyzing processes like procurement, warehousing, HR activities, and even after-sales service.
The aptly color-coded template provides a framework for building a comprehensive value chain. Use the square boxes to define Primary activities and the rectangular tiles for Secondary ones.
Your job is to brainstorm all processes necessary for creating your product and sort them into the right category using sticky notes. Customize the value chain flow by connecting processes across departments like design, production, distribution, marketing, and customer service.
Once you do that, take a look at your map and pinpoint areas that don’t bring as much value to your company—this could be an unsuccessful ad, outdated program, or high transportation costs. Document your findings in the Summary section of the template.
Use the Getting Started Guide view for tips and advice on using the template. Make sure to update task statuses within the template to keep your stakeholders informed every time you implement a process change.
4. ClickUp Value Risk Matrix Template
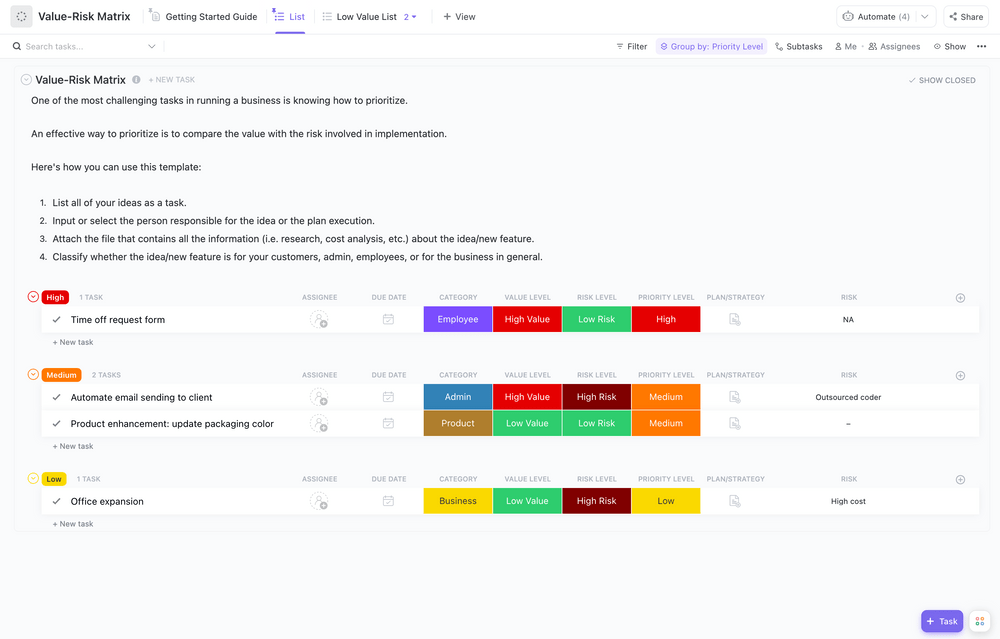
When deciding whether to take on a new project or make a significant change in your company, you need to consider the risks alongside the potential added value. Leverage the ClickUp Value Risk Matrix Template to make smart decisions and prioritize relatively low-risk, high-value projects and activities.
The template boasts a value risk matrix to define the nexus between the value and complexity of production tasks. Switch between List and Board views to organize your low-risk and high-risk initiatives.
The main List view outlines all your ideas in the form of tasks. Add an assignee to every task using one of the Category Custom Fields named Employee, Product, Admin, Business, and Customer. Determine value, risk, and priority levels to classify your tasks.
Use the two other List views—Low-Value List and High-Value List—to sort your ideas from the previous view. They come in handy when working with dozens of tasks.
The Board view is a Kanban board displaying tasks as cards and sorting them depending on their category. You can use other criteria to group the cards by selecting the Group By field at the top-right corner of the screen.
Once you’ve outlined all tasks, plot them in the matrix to get a clear overview of priority tasks and the preferable order in which they must be executed.
5. ClickUp Process Audit and Improvement Template
As your business evolves, the workflows that were efficient in the past may become outdated. If you want to reevaluate processes in terms of cost efficiency and productivity, start conducting audits with the ClickUp Process Audit and Improvement Template.
With this tool, you can conduct a fair analysis of your current processes, pinpoint drawbacks and redundancies that reduce efficiency or profitability, and introduce corrective measures.
The template breaks down the audit plan into four sections:
- CATWOE Analysis: Stands for Customer, Actor, Transformation, Worldview, Owner, and Environment analysis—it’s used for streamlining stakeholder perspectives in conflicting scenarios
- Model Conception: Defines the audit plan
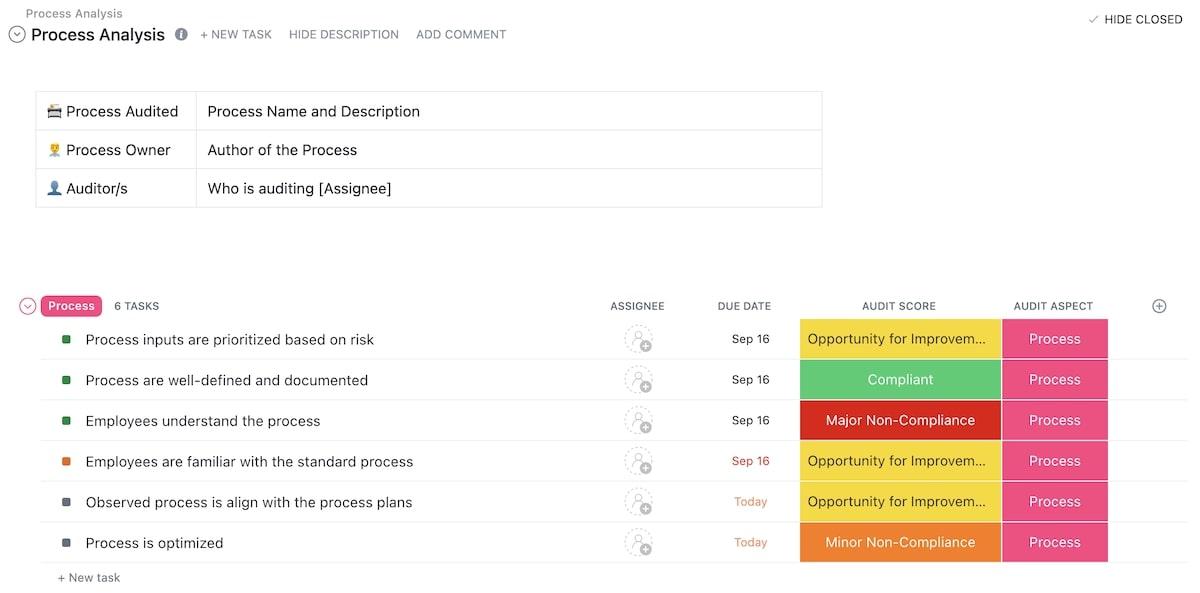
- Process Analysis: Lists the processes you’ll audit and the guiding criteria
- Change Management: Outlines the approaches (methods and manners) you’ll use to transition to better processes
Each section lets you create tasks, add assignees, and set their due dates and priorities. Use ClickUp Custom Fields to add process or task categories based on your line of work. You can track proposed changes through nine status tags: Not Started, In Progress, Complete, To Do, Approved, Rejected, Pending, Canceled, and Archived.
6. ClickUp Business Process Improvement Project Charter Template
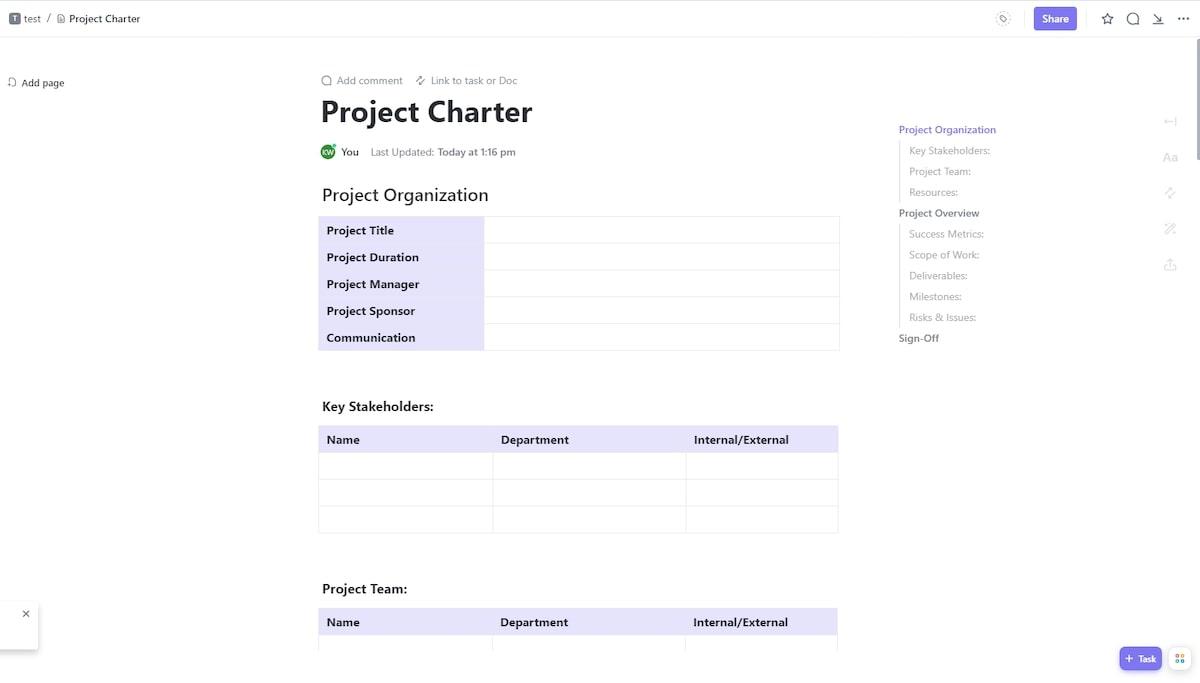
For project managers, continuous process improvement is vital for staying ahead of competitors and enhancing customer success strategies. The ClickUp Business Process Improvement Project Charter Template sets you up with an organized document to plan and deploy refined workflows.
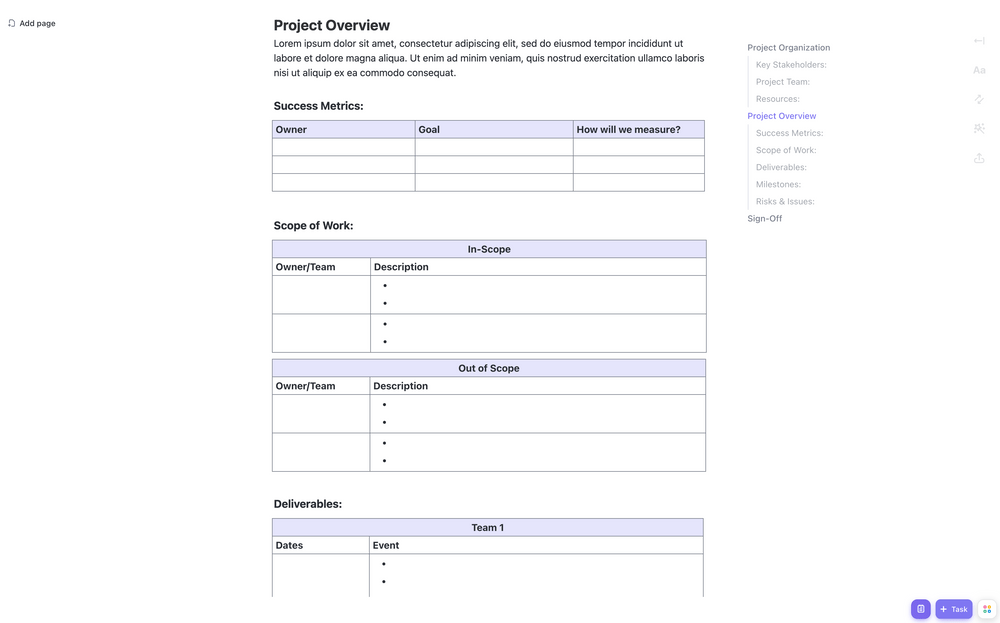
This template has a no-frills tabular format. Start a new initiative by providing details about the organization, project, and manager(s). You get dedicated tables for defining the roles and responsibilities of your stakeholders and project team.
The core of this project charter template is the Overview section. This is where you’ll include the project’s scope, process risks and issues, progress metrics, deliverables, and milestones.
For process optimization, you can get into details about cycle time, error rates, or customer feedback to identify the pain points that stifle your efficiency. Documenting these intricacies will make it easy for your decision-making team to suggest realistic improvements.
If you’re handling complex project dependencies, we recommend using the Calendar or Gantt Chart views in ClickUp to draw a structured timeline of improvement initiatives across value stream maps.
7. ClickUp Process Mapping Template
The ClickUp Process Mapping Template is your shortcut to cutting costs, improving efficiency, and reducing waste. This template gives you detailed insights into the relationship between different steps comprising your processes, helping you spot and fix bottlenecks. ✔️
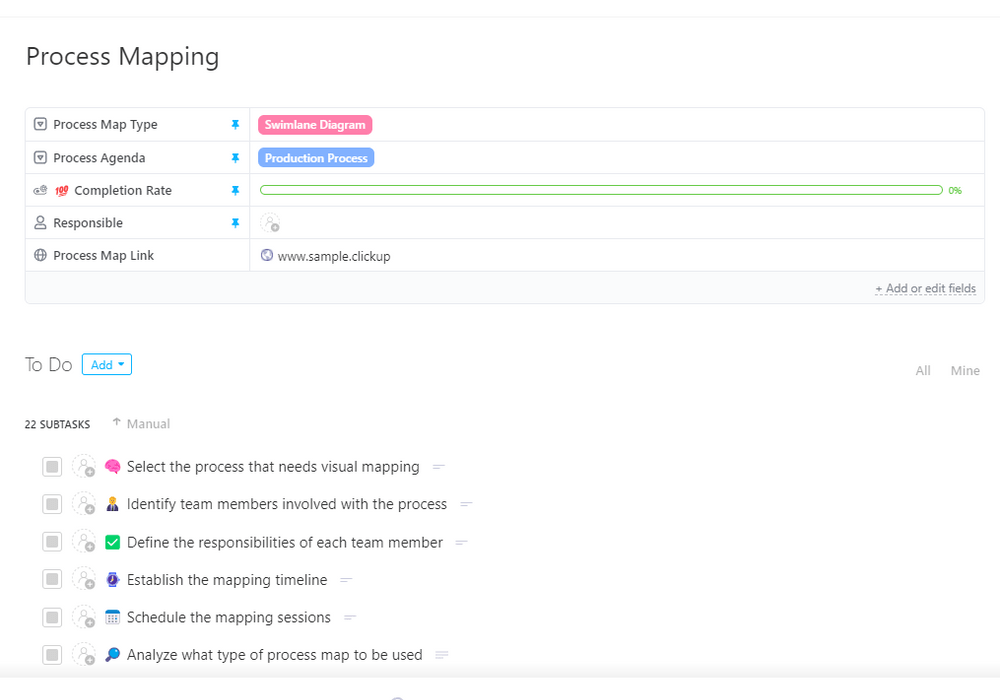
This task template is essentially a to-do list comprising 22 subtasks. Each represents a process mapping goal and provides short instructions on how to accomplish it. For example, the first subtask selects the process needing improvement, while the second requires identifying the workers involved in the delivery.
You can leave how-to notes, add attachments, and create an action list for you and your team. Leverage the following five Custom Fields to add structure to your process and value stream maps endeavor:
- Completion Rate
- Process Map Type
- Process Agenda
- Process Map Link
- Person(s) Responsible
The beauty of this template is that it supports task dependencies—in only a few clicks, you can ensure a specific task can’t be started or completed before another one.
Any kind of process or concept mapping is challenging without a visual structure. Try the Board view in ClickUp to create rich visual representations of relationships between concepts, processes, and ideas.
8. ClickUp Process Improvement Project Charter Template
Operational and manufacturing value stream mapping projects can quickly descend into chaos without adequate documentation. But not when you have the ClickUp Process Improvement Project Charter Template to back you up!
This simple template is all about detailing who’s supposed to do what and measuring success through established metrics. Let’s see how.
For instance, we’ll consider a dog food manufacturer dealing with frequent meat contamination. The process improvement here is to install a handwashing station for meat handlers and work on improving airflow.
In this case, the manager (let’s call him Tim) will use the template to first define stakeholders like investors, suppliers, machine operators, food quality engineers, and delivery drivers. Tim will then propose the solution, describing the success metrics, scope of work, and deliverables.
The template helps list out milestones for progressive achievements. In our example, the first milestone can be optimizing meat supply times to minimize environmental exposure. Tim can establish who’s in charge of the process within the template to maintain team transparency.
Regardless of your industry, consider including what-if scenarios and potential implementation risks in the charter. Activate ClickUp’s Recurring Tasks feature to check in regularly and ensure the proposed processes are shaping up as planned.
9. Value Stream Mapping Template by 24Slides
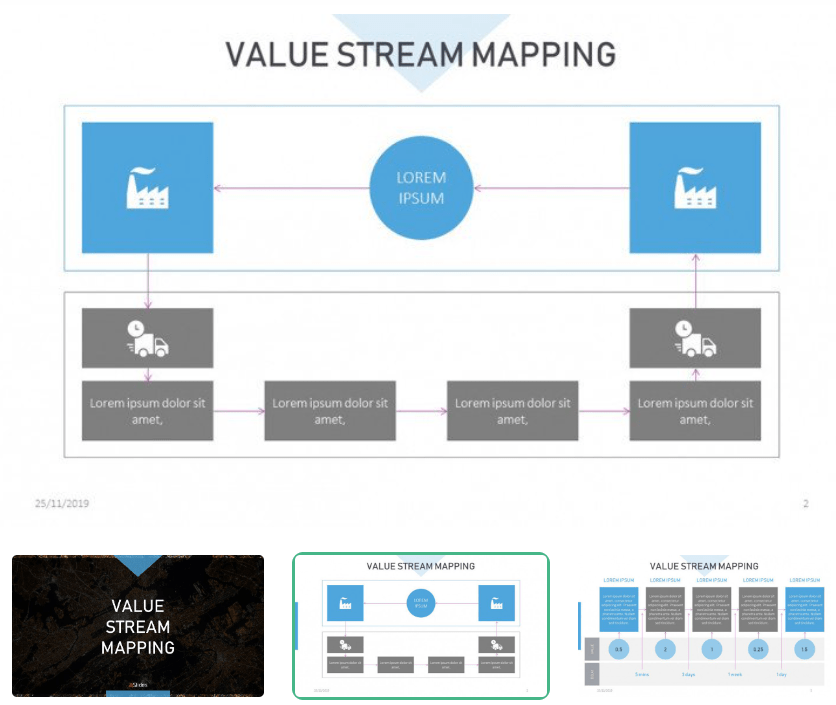
Are you looking for a simple structure that lets you display the processes necessary to bring your product to the end customer? This template for stream mapping by 24Slides is just what you need.
This PowerPoint template doesn’t boast advanced collaboration and communication tools, but it can be more than enough to visualize your flows and identify bottlenecks at a presentation.
The template consists of eight slides, each featuring a value stream map for representing different aspects of your processes. Create timelines to define how long it takes to deliver your product, display improvements in percentages, and determine which processes carry the most value.
This template is all about customizability. Change the slides’ order, edit the color palette, change the font, and add engaging visual components to tailor the presentation to your audience.
📮 ClickUp Insight: 74% of employees use two or more tools just to find the information they need—while jumping between emails, chat, notes, project management tools, and documentation. This constant context-switching wastes time and slows down productivity. As the everything app for work, ClickUp unifies all your work—email, chat, docs, tasks, and notes—into a single, searchable workspace, so everything is exactly where you need it.
10. Value Stream Map Template by VisualParadigm
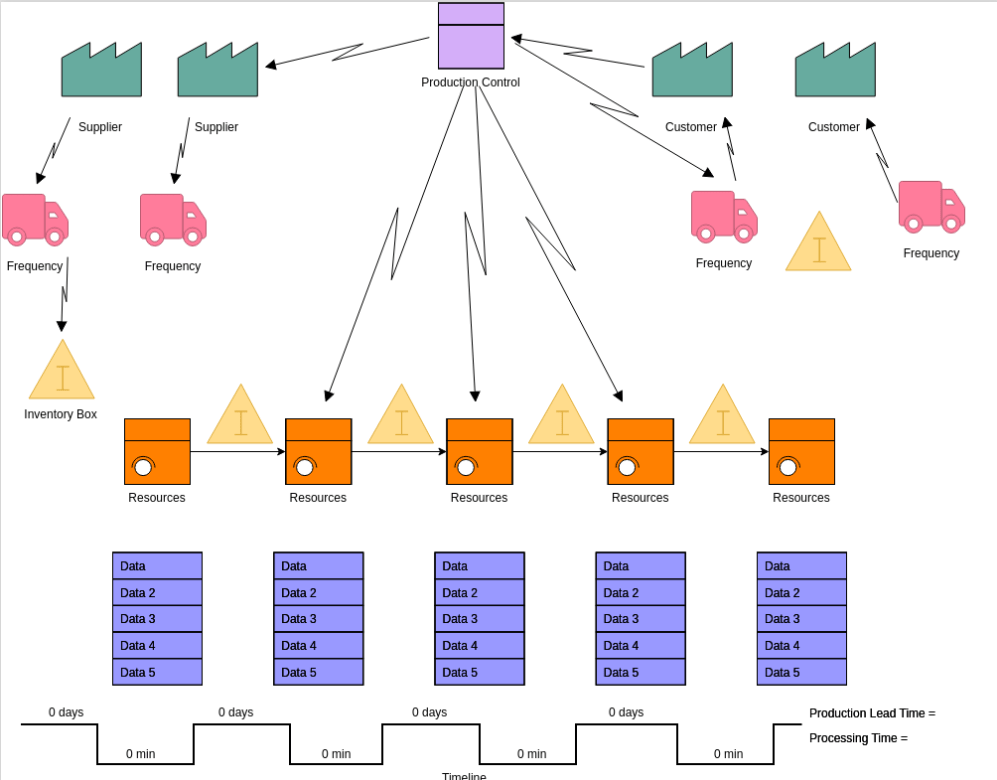
Improving the efficiency of your processes is no easy feat—you need to take a good look at your workflows and monitor minute details about everything, be it order supplies or the location of your facility. VisualParadigm’s template to create a value stream map enables you to do this without starting from scratch.
The template comes with colorful premade value stream maps that let you visualize your processes by simply adding the correct info to the right box. You get a single-sheet overview of critical processes, resource areas, and production estimates.
This template is versatile enough to suit all industries. The online editor offers plenty of customization options—change the shapes, colors, fonts, and arrows to make the layout work for you.
Once you’re done, you can save the template in various formats, including JPG, PDF, PNG, and SVG.
Value Stream Mapping Templates: The Devil’s in the Details
Think of value stream mapping as looking at your processes under a microscope—you observe every little detail to catch irregularities and inefficiencies and see how to set them right. The templates we discussed offer a solid playground to regulate and enhance your processes with a realistic approach.
Analyzing processes requires other tools, such as flowcharts and work plan templates—you can find them on ClickUp, as it has over 1,000 template options for various departments!


