


Still downloading templates?
There’s an easier way. Try a free AI Agent in ClickUp that actually does the work for you—set up in minutes, save hours every week.
Sorry, there were no results found for “”
Sorry, there were no results found for “”
Sorry, there were no results found for “”
Lucidchart is a popular web-based tool that simplifies the creation, collaboration, and sharing of diagrams. From detailed flowcharts to complex process maps, it gives you the flexibility to visualize just about anything—and bring your ideas to life.
Among its many features, Lucidchart is especially known for its ready-to-use Gantt chart templates.
While the selection isn’t vast, Gantt charts in Lucidchart are easy to use, surprisingly versatile, and helpful for visualizing project timelines with minimal effort.
So today, let’s explore some of the best Lucidchart Gantt chart templates along with a few (better) alternatives!
🔍 Did You Know? The U.S. Army utilized Gantt charts during World War I to streamline the production of war materials and supplies. 💣
Whether it’s on Lucidchart or anywhere else, here are a few elements that make a Gantt chart template functional:
🧠 Fun Fact: The Gantt chart software market is projected to grow significantly, reflecting a clear demand for dedicated tools. While varying slightly by source, forecasts suggest robust growth, with one report indicating a CAGR of 12.5% from 2026 to 2033, aiming for a $3.5 billion market size by 2033.
Let’s not keep you waiting anymore—check out these top Gantt chart templates available on Lucidchart:
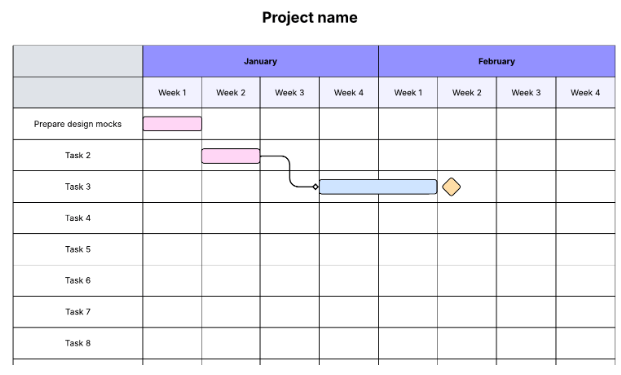
The Simple Gantt Chart Template by Lucidchart is a basic tool for organizing multiple project activities over a specified period (daily, monthly, or weekly). It is fairly easy to work with and, therefore, ideal for beginners.
Apart from organizing tasks, you can also use it to assign action items to your team members and collaborate with them to brainstorm project plans. The template is customizable, allowing you to personalize colors, time markers, milestones, and other key chart elements.
🔑 Ideal for: Project managers or team leads looking for a quick, visual way to plan and track small- to medium-sized projects.
📚 Also Read: Gantt Chart Examples for Project Management
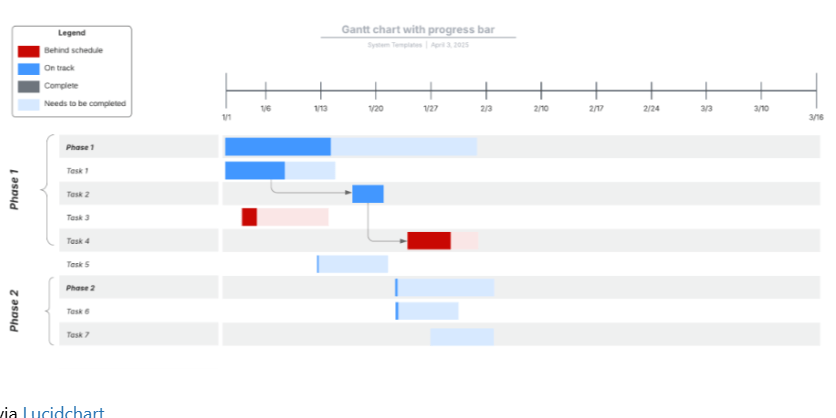
Seeking a Gantt chart tailored for moderately advanced project management requirements? The Gantt Chart with Progress Bar Template by Lucidchart provides a clear view of all your project tasks, along with their respective dependencies.
Additionally, it provides valuable insights into the project’s progress. Combinedly, they help you accurately visualize the project timeline, identify the critical path, and prevent bottlenecks early on.
🔑 Ideal for: Teams who need to track task completion visually and monitor ongoing progress in real time across multiple workstreams.
🎥 Watch this video on how to prioritize tasks:

Launching a new product? The Go-to-Market Gantt Chart Template by Lucidchart simplifies the whole process, from start to finish. With this template, create product launch tasks, assign them to your team members, and track each of their progress.
It’s packed with a variety of other useful features, including data linking and conditional formatting. The template is easy to navigate and features numerous visual elements to facilitate collaboration with your team and ensure a successful product launch.
🔑 Ideal for: Marketing and product launch teams coordinating cross-functional go-to-market activities with strict deadlines and dependencies.
💡 Pro Tip: Keep your project timeline realistic. Avoid over-optimism—estimate durations based on historical data or team capacity to prevent burnout and missed deadlines. ⏱️
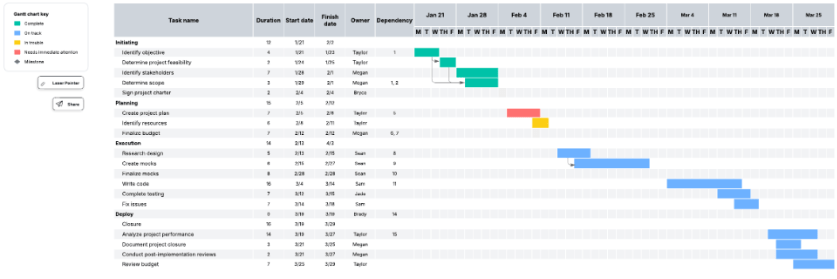
The Gantt Chart with Milestones Template by Lucidchart is handy if you’re working on a project with an extensive scope.
It enables you to break down the project into distinct phases and extract actionable items from each one. You can specify their individual durations, start dates, finish dates, owners, dependencies, and other details. This helps schedule tasks, visualize their timelines, and follow their progress for a timely wrap-up.
🔑 Ideal for: Teams that need to highlight major deadlines or deliverables in long-term projects, such as product development or client implementation.
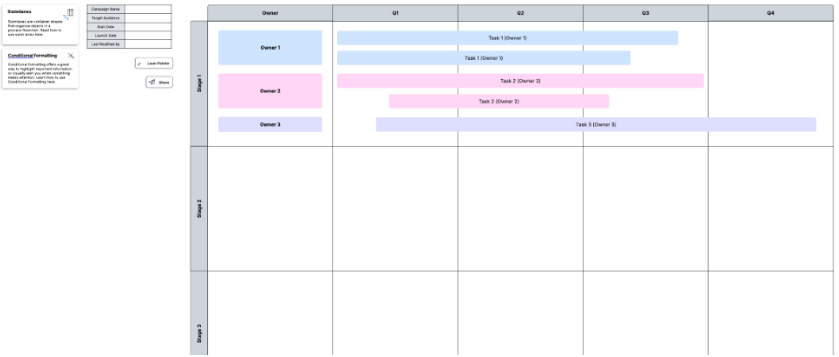
If you want a Gantt chart that visualizes your project phases in quarters rather than days, weeks, or months, the Gantt Chart with Quarters Template by Lucidchart should help. It groups your project phases into quarters and lists each task that falls under them.
Apart from this, the template also shows you the progress of each task through visual status indicator icons. If a project phase extends into another quarter, the template also displays this information and highlights its dependencies. It also offers swimlanes to help you organize every task without clutter.
🔑 Ideal for: Strategy teams or department heads planning initiatives every quarter to align with fiscal or performance cycles.
➡️ Read More: Best Free Gantt Chart Maker Software
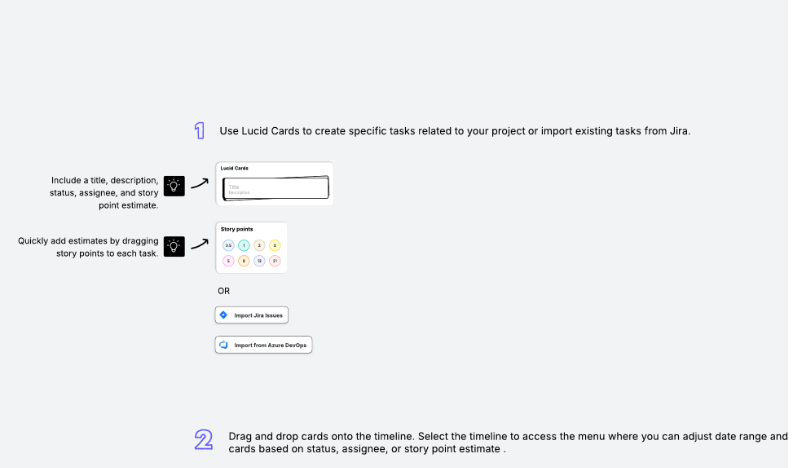
The Basic Gantt Chart Template by Lucidchart is compatible with Lucidspark and works best for creating a visual project roadmap. To use it, you need to use Lucid cards to extract tasks for your project and drag and drop them onto your selected timeline.
The template provides a clear view of each task’s status, assignee, and story point estimate. Apart from this, you can get a comprehensive view of your entire project—from start to finish—to manage time, accountability, and execution.
🔑 Ideal for: Individuals or small teams managing short projects and needing a simple visual timeline to stay organized.
🔎 Did You Know? Remember NASA’s historic Apollo 11 moon landing mission? Well, Gantt charts played a significant role in this, helping teams coordinate complex engineering tasks more efficiently. 🚀
💡 Bonus: As a project manager, if you want to:
Try ClickUp Brain MAX—the AI Super App that truly understands you, because it knows your work. Ditch the AI tool sprawl, use your voice to get work done, create documents, assign tasks to team members, and more.
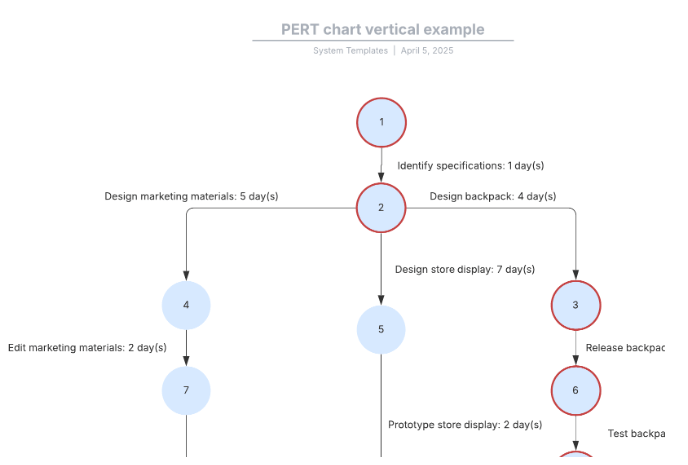
Although not the typical Gantt chart, the PERT Chart Vertical Template by Lucidchart is another useful resource for project planning and scheduling. It revolves around three aspects: task order, dependencies, and timeline.
Based on the Program Evaluation and Review Technique (PERT), this template lets you visualize a project’s activities and schedules by organizing its various parts, processes, and dependencies. Moreover, it also highlights the critical path, allowing you to focus on the most essential tasks without delay.
🔑 Ideal for: Project planners or analysts who need to map dependencies and determine the critical path in time-sensitive, complex projects.
🎥 Watch how to create a process map in ClickUp:
The Lucidchart Gantt chart templates listed above are helpful. However, they may not be suitable for all types of teams. Here’s why:
Gantt charts are solid tools for visualizing and managing project schedules. But they alone cannot boost your project management efforts. This is where ClickUp steps in!
The everything app for work, ClickUp, offers a wide range of pre-designed customizable Gantt chart templates and a suite of powerful features that go beyond project scheduling to support your overall project management initiatives.
Ready to get started? Check out these Gantt chart templates by ClickUp:
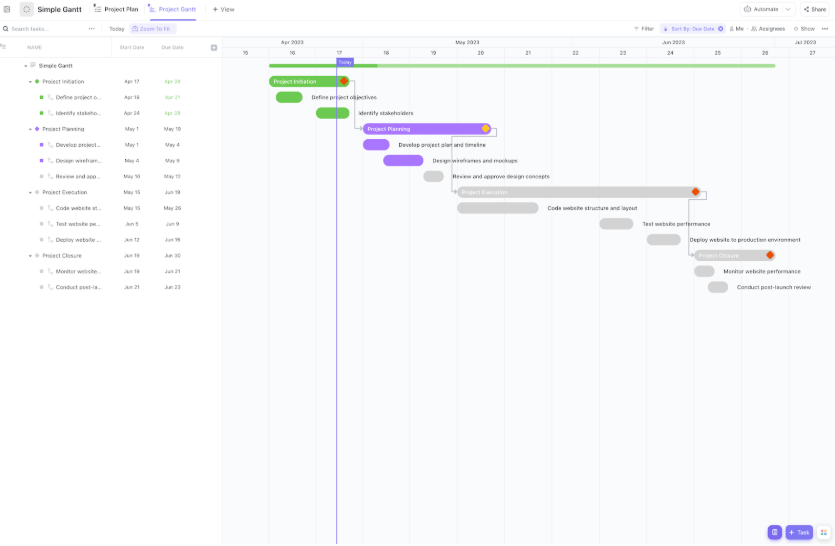
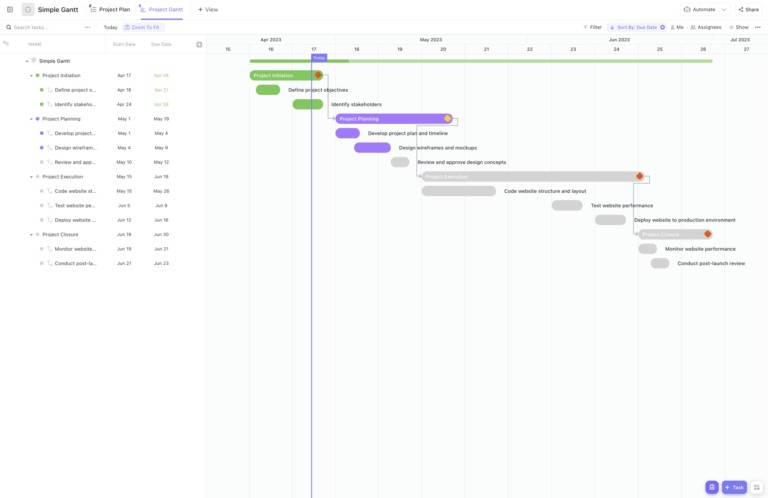
The ClickUp Simple Project Management Gantt Chart Template is comprehensively designed to enhance project schedule management. It boasts a clean design and an intuitive user interface.
Like a traditional Gantt chart, horizontal bars show task timelines, their dependencies, and milestones. The template is also highly collaborative. Apart from viewing schedules, you can also assign tasks, manage workflow, and identify bottlenecks to minimize the chances of delays.
🔑 Ideal for: General project managers or team leads managing standard business projects with straightforward tasks and deadlines.
Customer voice: Here’s what Justin Kosmides, CEO at Vela Bikes, says about using ClickUp:
Being a smaller team and having thousands of orders from around the world, we need to be ultra-efficient, and ClickUp Gantt charts allow us to track all of our production and logistics in one place, which made our production team two-thirds more efficient.
🧠 Fun Fact: As per statistics, large construction projects take 20% longer to finish than originally planned.
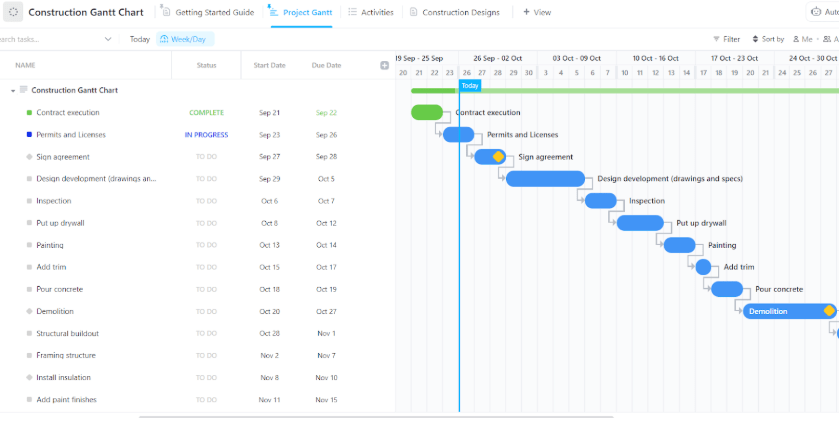
If you don’t want this percentage to shoot higher, use the ClickUp Construction Gantt Chart Template and streamline your construction project management.
This easy-to-use template focuses on boosting the efficiency of three project management elements: planning, coordination, and communication. It allows you to highlight specific tasks, visualize their timelines, set milestones, and adjust them as your needs change.
However, it doesn’t stop there—the template also allows you to connect tasks to their relevant resources and track their costs, budget, and labor for effective dependency management.
🔑 Ideal for: Construction managers, site supervisors, or contractors coordinating large-scale construction projects with sequential and dependent tasks.
📮 ClickUp Insight: 92% of workers use inconsistent methods to track action items, which results in missed decisions and delayed execution. Whether you’re sending follow-up notes or using spreadsheets, the process is often scattered and inefficient.
ClickUp’s task management solution ensures a seamless conversion of conversations into tasks, allowing your team to act quickly and stay aligned.
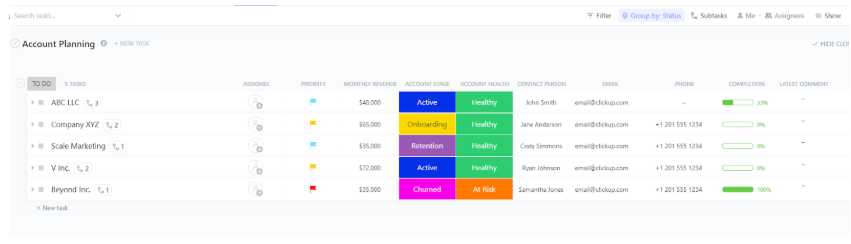
The ClickUp Business Account Planning Gantt Chart Template displays the status of each of your client accounts, allowing you to plan the next steps for optimizing them. This template is a visual treat. It utilizes color codes to indicate account status, health, and other key aspects.
Additionally, it enables you to identify areas for improvement, assign tasks to team members, and track progress to enhance the client journey. This way, it helps you maximize the potential of every client account to drive business growth.
🔑 Ideal for: Sales or client success teams managing strategic account plans with multi-phase engagement, outreach, and renewal cycles.
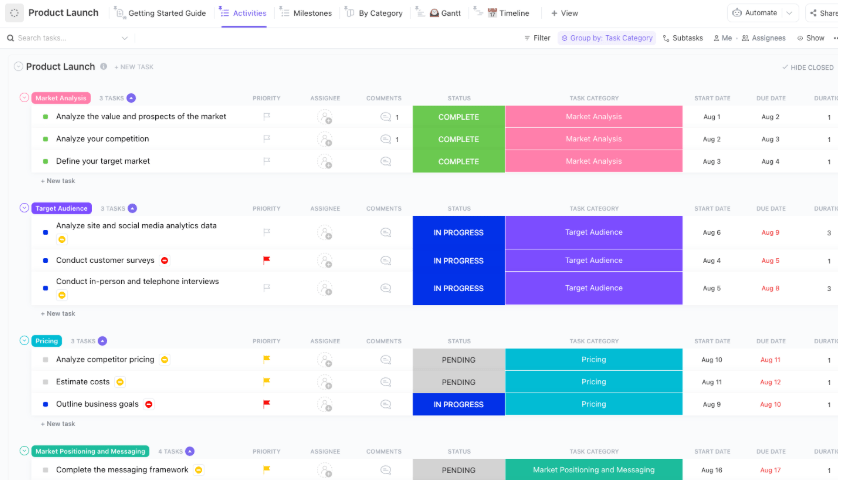
The ClickUp Product Launch Checklist Template is an all-inclusive document to streamline the product launch process. While the Lucidchart template was intended for basic use, this one is highly advanced and designed to simplify intricate launches.
Develop a quick checklist of all the tasks involved in a product launch to help you accurately visualize its timeline. You can also assign team members and assets for efficient execution. It enables you to collaborate with other stakeholders in real time. This proves helpful in communicating inefficiencies, resolving roadblocks, and maintaining alignment with project progress.
🔑 Ideal for: Product managers and cross-functional teams planning product releases with detailed task breakdowns and firm go-to-market timelines.
📚 Also Read: ClickUp vs. Miro: Which Whiteboard Tool to Choose
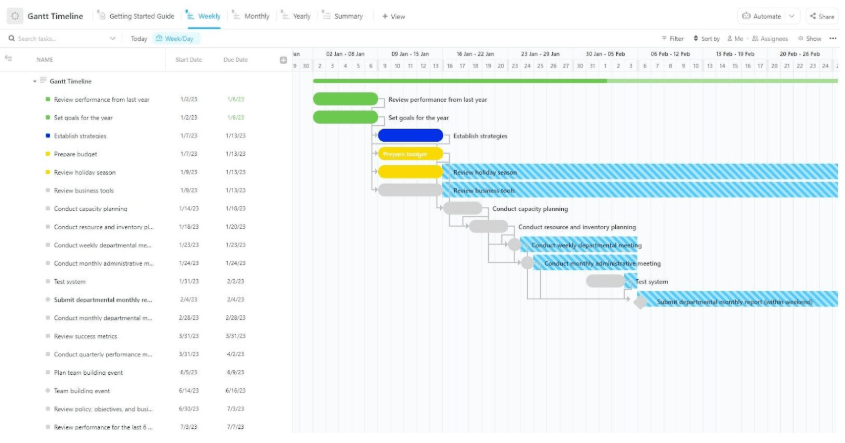
The ClickUp Gantt Timeline Template equips teams with a comprehensive planning system that transforms scattered tasks into a cohesive visual format. This template outlines every phase, milestone, and dependency along a flexible timeline, enabling managers to forecast workloads and prevent scheduling conflicts.
Each taskbar shows real-time progress, while Custom Fields and color-coded statuses help you instantly spot bottlenecks and priority items. Whether you’re coordinating marketing campaigns or complex engineering rollouts, this template provides a central hub to manage progress, share updates, and keep stakeholders informed.
🔑 Ideal for: Operations or program managers who need a flexible, high-level timeline view to coordinate multi-departmental efforts.
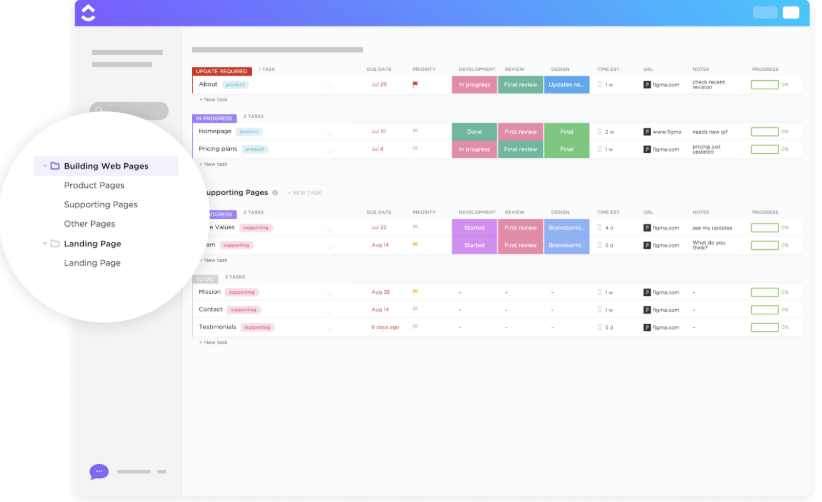
Building a web page can quickly get tricky, especially if you don’t have a seasoned team or a predefined workflow. Fortunately, this is where the ClickUp Building Web Pages Gantt Chart Template saves the day.
From initial research to design iterations, development sprints, and final QA, each task is displayed along a timeline with dependencies and milestones marked. The template also allows you to assign owners, add estimates, and link relevant documents.
This level of transparency ensures that developers, designers, and stakeholders share a unified view of project progress.
🔑 Ideal for: Web development teams planning and coordinating the creation of multiple website pages across design, dev, and QA workflows.
💡 Pro Tip: Use color coding strategically. Assign colors based on teams, task status, or priority to improve chart readability at a glance. 🎨
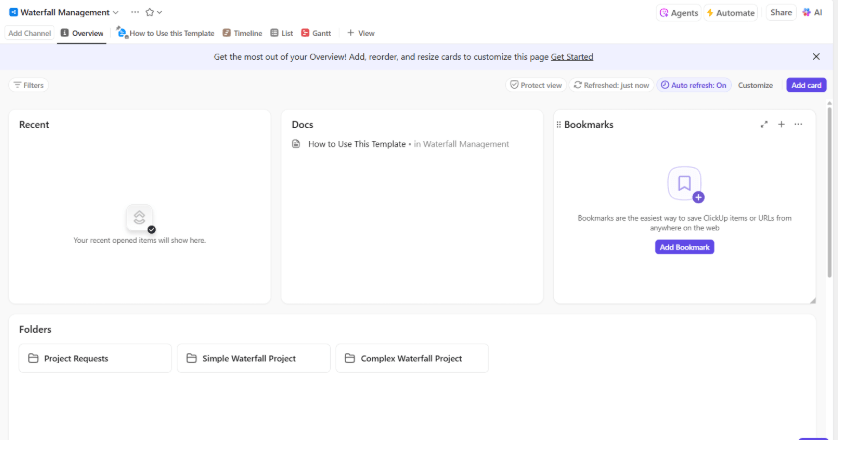
When your project requires a traditional sequential workflow, the ClickUp Waterfall Management Gantt Chart Template makes planning straightforward. Each phase—from discovery to delivery—is laid out in order, with dependencies defined so work doesn’t move ahead prematurely.
Task bars include built-in progress tracking and Custom Fields for notes or status updates. Built-in reporting widgets and export options allow you to present project status to stakeholders or clients with confidence.
🔑 Ideal for: Teams working within structured, sequential project frameworks, such as software development, compliance, or government projects.
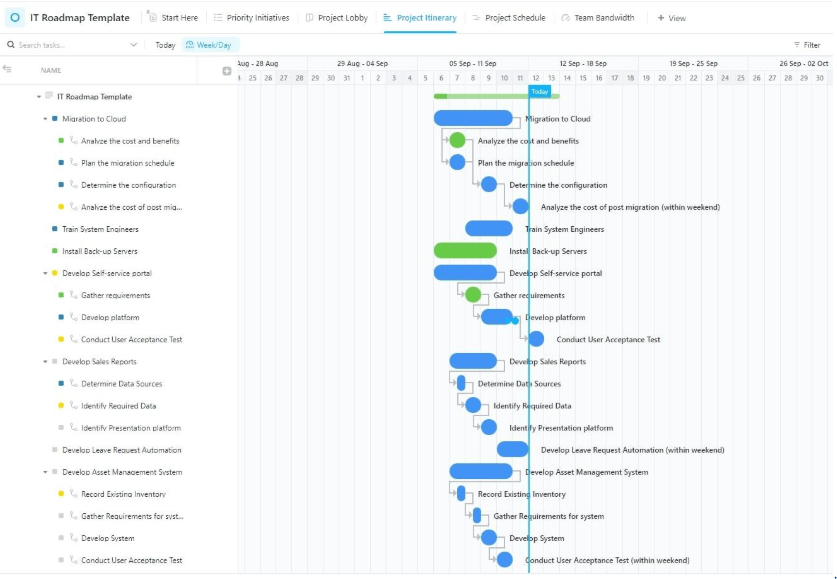
The ClickUp IT Roadmap Gantt Chart Template helps technology leaders visualize everything from infrastructure upgrades to software deployments over long time horizons. Tasks can be grouped by quarter, linked by dependencies, and assigned to cross-functional teams to reflect real-world complexities.
The resource forecasting tools show upcoming workload bottlenecks, while milestone markers help track critical launches. As your plans evolve, the drag-and-drop interface makes timeline adjustments painless.
🔑 Ideal for: IT managers and technology leaders planning long-term infrastructure, security, or application rollouts and upgrades.
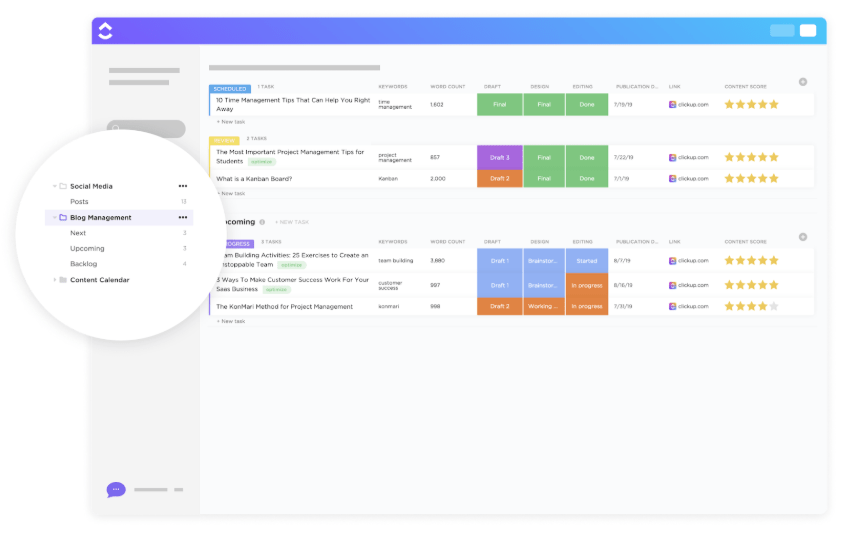
Specifically designed for bloggers and content managers, the ClickUp Blog Management Gantt Chart Template provides a solution to your cluttered content publishing process. From brainstorming ideas, drafting, editing, and publishing, every step is mapped onto the timeline with assigned owners and deadlines.
You can organize and improve blog content, track and schedule posts, and so on. Moreover, it also allows you to set due dates and coordinate with other stakeholders—such as writers, editors, and publishers—for efficient blog management.
🔑 Ideal for: Content managers or editorial teams overseeing blog production schedules and managing multiple posts in a calendar cycle.
🔎 Did You Know? One of the most notable early applications of Gantt charts was in planning the construction of the Hoover Dam in the 1930s—a massive, multi-year project.
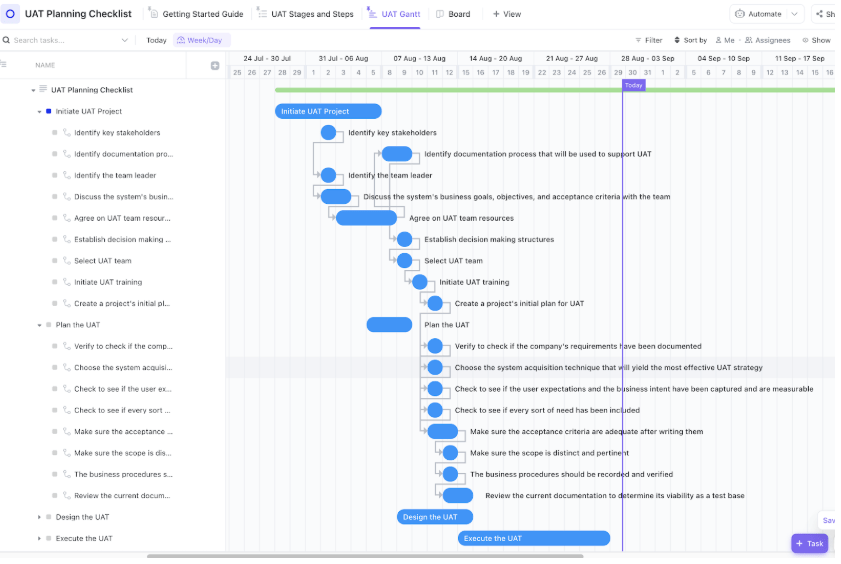
User Acceptance Testing (UAT) is often the final and most crucial step in software development. The ClickUp User Acceptance Testing Checklist Gantt Chart Template aims to optimize it.
It helps teams plan and track every step of the UAT process with clarity and precision. Using a visual Gantt chart format, you can map out test case development, execution timelines, feedback cycles, and approvals.
With built-in dependencies and task assignments, it ensures smooth coordination between QA, product, and stakeholder teams, making sign-off seamless and organized.
🔑 Ideal for: QA teams, business analysts, and stakeholders involved in planning and executing structured UAT before go-live.
➡️ Read More: Best Miro Alternatives & Competitors
While Lucidchart is a solid tool for mapping ideas and building diagrams, it isn’t built to manage projects end-to-end. This can quickly become a bottleneck for teams that need more than just a basic Gantt chart.
ClickUp, on the other hand, combines the clarity of a Gantt chart with the functionality of a sweeping project management system. Every task, deadline, and dependency is live, actionable, and integrated with your workflow.
Moreover, ClickUp’s Gantt chart templates adapt to how your team works, not vice versa. From dynamic rescheduling to progress tracking and cross-team visibility, it’s designed to help you do the work, not just diagram it.
Make your timelines smarter, faster, and fully actionable with ClickUp’s customizable Gantt charts. Try it today—sign up here for a free trial!

© 2026 ClickUp

There’s an easier way. Try a free AI Agent in ClickUp that actually does the work for you—set up in minutes, save hours every week.