

Sorry, there were no results found for “”
Sorry, there were no results found for “”
Sorry, there were no results found for “”
A good stacked bar chart (also called a stacked column chart) can be a game-changer for data visualization and presentation. One look and you can compare different categories within a dataset.
Imagine breaking down your company’s sales by product category or understanding how expenses are distributed across departments—all of which can be compared and shown through an easy-to-understand visual format.
But how easy is it to create a stacked bar chart in Google Spreadsheets?
Well, it’s possible with its chart editor feature. Are they the prettiest and most customizable charts you’ll ever work with? Probably not. But they get the job done.
In this guide, we’ll take you through the process of creating a stacked bar chart with Google Sheets’ chart editor, from data preparation to its final visualization.
We’ll also explore a better way to visualize your data beyond just a stacked bar chart.
Stacked bar charts in Sheets can get messy fast. Try ClickUp’s free Bar Graph Whiteboard template for clean, clear visuals—no spreadsheet stress.
Here’s how you can create a stacked bar chart in Google Sheets:
Start by importing information from your data source and organizing it in Google Sheets. Create clear headers for your columns. In the first row, label each column with descriptive titles. This is important for creating a coherent bar chart.

In this example, we’ve used “Teams” for column A and gender labels for columns B and C. Double-check your data inputs.
Regardless of your data type, don’t forget to input your data in the appropriate columns.
Once your data is neatly arranged, it’s time to highlight it. Click on the top-left cell of your dataset and drag your mouse to select all the relevant information. This selection will form the basis of your stacked bar chart.

Remember, precision while selecting your data range is key here—you don’t want to include any blank rows or irrelevant data accidentally.
Now for the fun part—turning your data into a visual masterpiece.

Head to the top menu and click on “Insert,” then select “Chart” from the dropdown menu. A default chart will appear, along with the chart editor on the right side of your screen.
In the chart editor, under the “Setup” tab, click on the “Chart type” dropdown menu. Scroll through the options until you find the “Stacked column chart” and select it.

And voila! You’ve just created a stacked bar chart in Google Sheets.
Also Read: How to make a graph in Excel
Now, let’s customize our chart to exactly how we need it.
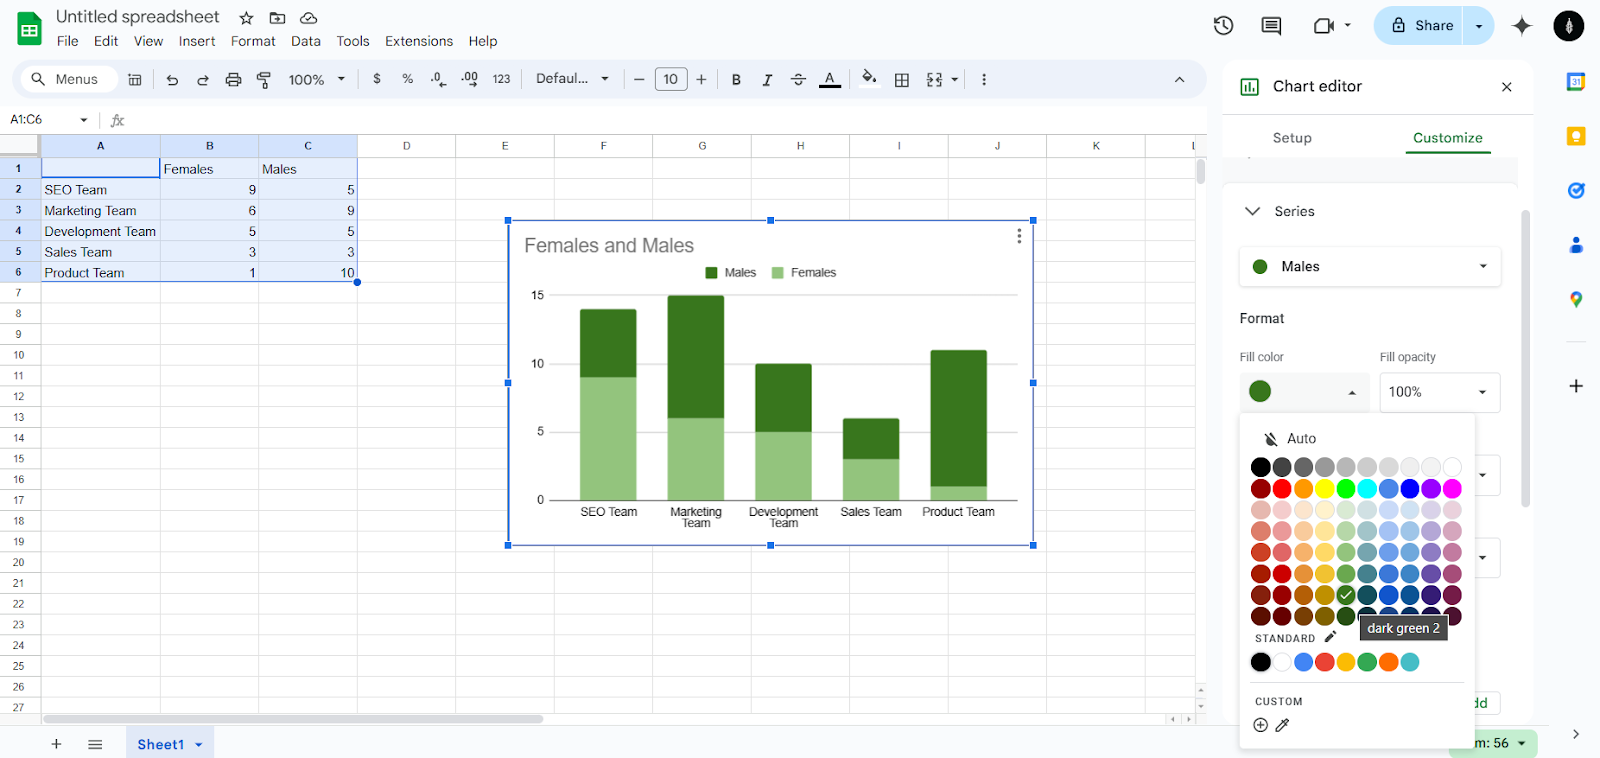
To do this, double-click on your chart to open the chart editor panel (if it’s not already visible).
Navigate to the “Customize” tab for an array of options.
Here, you can adjust the overall chart style, a chart title, data labels for the horizontal and vertical axis, legend placement, and series colors. Play around with these settings to make your bar chart informative and visually appealing.
Your bar chart looks great. Now, let’s place it better. Simply click and hold your chart, then drag it to your desired location on the spreadsheet.

Rearrange your chart’s position as per your requirements. It’s a simple move but is super helpful in adding data context to your chart.
Take a moment to review your graph. Are the colors easy to distinguish? Is the title clear and descriptive? Do the axis titles make sense? Have you clearly defined the chart’s legend?
Make any necessary adjustments to ensure your stacked bar chart effectively communicates your data. Remember, clarity is key in data visualization.
Your Google Sheet stacked bar chart is now ready. You can share your Google sheet with others, allowing them to view or edit your chart.
Alternatively, you can download the chart as an image to use in presentations or reports.
While Google Sheets is a great tool to create stacked bar charts, it’s not perfect.
Google Sheets is free but it doesn’t allow for smooth and easy collaboration on a document, especially when multiple team members work on a single presentation. It also cannot handle large datasets, and it can quickly feel limiting.
While the chart editor in Google Sheets gives you basic functionalities for creating stacked bar charts, ClickUp takes it a step further by offering real-time collaboration with other users and integrations with other tools. Here’s how.

ClickUp Whiteboards offer a flexible canvas for creating stacked bar charts. Unlike Google Sheets, you’re not constrained by cell-based layouts. This helps customize your charts better.
Here’s how to use ClickUp Whiteboards for stacked bar charts:
ClickUp Whiteboards allow real-time collaboration—a feature missing in Google Sheets due to its single-user editing limitation. Multiple team members can work on the chart simultaneously, which helps your team get work done faster.
The ClickUp Bar Graph Whiteboard Template allows you to visually compare quantitative data sets and categories. The horizontal double bar graph allows you to compare two data sets, which helps in better storytelling.
You can also use this template to:

ClickUp Dashboards provide a powerful alternative to Google Sheets for creating and displaying stacked bar charts. Here’s how you can use it:
Dashboards in ClickUp offer greater interactivity compared to static Google Sheets charts. You can click on chart elements to drill down into the underlying data, revealing more insights—useful when you are presenting your data in a stakeholder meeting.
The ClickUp’s Stacked Bar Graph Template provides an easy-to-understand presentation of key insights, whether you’re tracking project progress or monitoring customer sentiment.
In this template, the stacked bar graph displays the comparison and composition of a small number of variables through time, whether relative or absolute.
You can also use this template to:

While primarily used for project timelines, ClickUp Gantt Charts can be creatively used to create stacked bar-like visualizations. Here’s how:
ClickUp Gantt charts offer dynamic updating and dependency linking— key features that are not available in Google Sheets stacked bar charts. It also allows you to visualize complex data sets.
Use ClickUp’s Simple Gantt Template to get a bird’s eye view of a project and visualize dependencies effectively. With this template, you can instantly pull tasks from your List into a simple chart using ClickUp’s Gantt view.
While this is a beginner-friendly free template, it’s also a great starting point for seasoned project enthusiasts who just want to get things going quicker.
You can also use this template to:
Also Read: Monthly Calendar Templates
ClickUp addresses several key limitations of creating stacked bar charts in Google Sheets:
ClickUp offers more advanced design features, allowing you to create visually stunning charts that align with your brand.
ClickUp can handle larger datasets more efficiently than other Google Sheets alternatives, making it suitable for complex data visualization needs.
Real-time collaboration is available across all ClickUp features, including chart creation and editing.
ClickUp charts are interactive, allowing users to explore data in depth.
ClickUp ensures your charts look consistent across different devices and platforms.
Beyond stacked bar charts, ClickUp offers a range of features that make your data visualizations immediately accessible (in addition to looking great), along with exceptional project management capabilities:
While Google Sheets may require manual data entry or complex integrations, ClickUp offers native integrations with various tools. It allows you to automatically pull data from different sources into your stacked bar graph, ensuring the visualization is always up-to-date.
For those transitioning from Google Sheets, ClickUp also provides resources to help you make the switch. You can learn how to create a Gantt chart or even explore creating line charts in Excel.
ClickUp also stays ahead of the curve with features like AI for spreadsheets, providing advanced data analysis capabilities that go beyond traditional stacked bar charts.
Also Read: Free Google Sheets Invoice Templates
Now you know how to create a stacked column chart in Google Sheets.
But now you also know about its limitations. Just creating a bar chart and placing it beside your data set does not convey the complete picture and detracts from your ability to tell a compelling visual story. Add to that the lack of design customization and data size restrictions, and the process of creating bar charts on Google Sheets begins to sound boring.
But it doesn’t have to be that way.
Whether you’re creating project management charts or exploring Gantt chart examples, ClickUp lets you work alongside your team with real-time collaboration—all of which makes data visualization much more fun and impactful.
Create your first interactive bar charts with ClickUp today and experience the difference!

Arya Dinesh
Max 16min read

Preethi Anchan
Max 17min read
Arya Dinesh
Max 13min read

© 2026 ClickUp


