


Still downloading templates?
There’s an easier way. Try a free AI Agent in ClickUp that actually does the work for you—set up in minutes, save hours every week.
Sorry, there were no results found for “”
Sorry, there were no results found for “”
Sorry, there were no results found for “”
Three out of four professionals have felt burnout at work. Deloitte’s Workplace Burnout Survey found that 77% of respondents have experienced burnout at their current job.
To me, this is a warning that productivity and morale erode long before people raise a hand.
For PMs and ops leads, the fix isn’t always hiring more. It’s allocating the work you already have with clear capacity, skills, and deadlines in view.
That’s the point of a Workload view: a live map of who’s committed, who’s at risk, and where unassigned tasks are hiding.
In this guide, I’ll show how ClickUp uses workload views to give me real-time visibility and a practical way to rebalance before problems snowball.
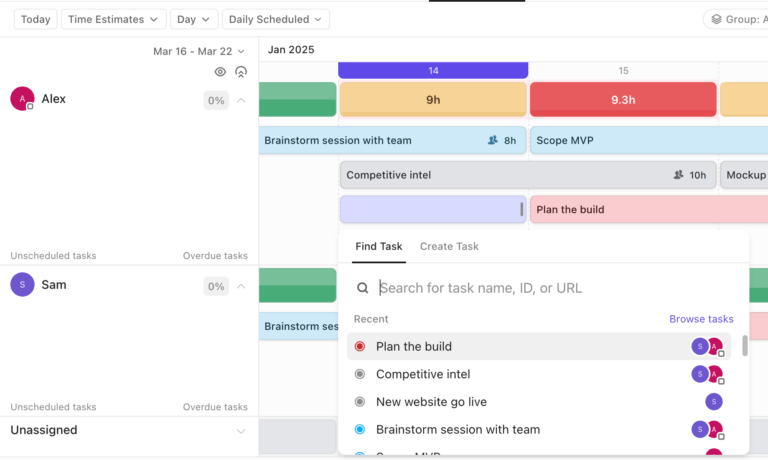
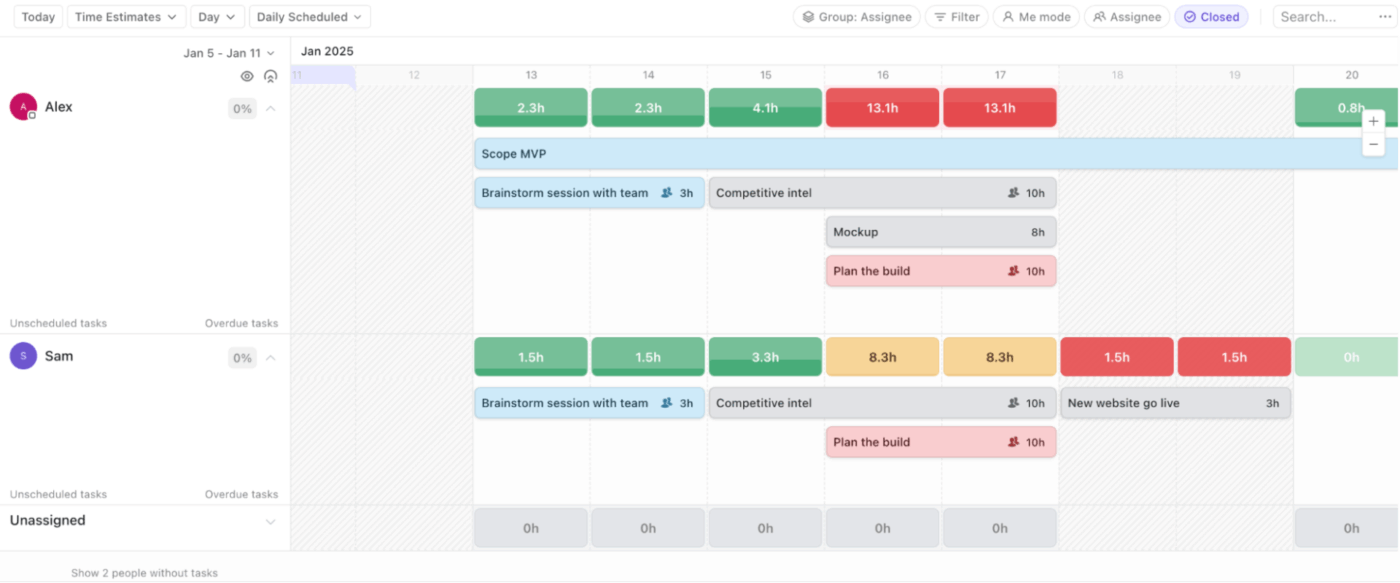
Think of ClickUp’s Workload view as a reality check for team capacity.
It visualizes my team’s work and capacity over time so I can balance assignments every day, week, or month without relying on guesswork.
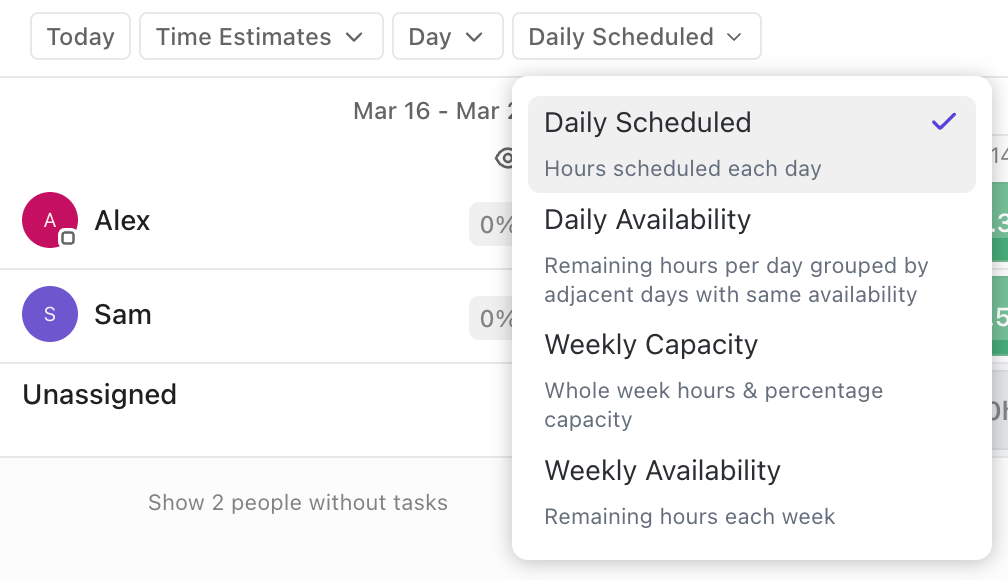
I can zoom the view to different time ranges, click into open space to create work, and choose whether I’m looking at availability (who can take on more) or capacity (who’s already loaded).
The most useful part is how clearly it signals risk.
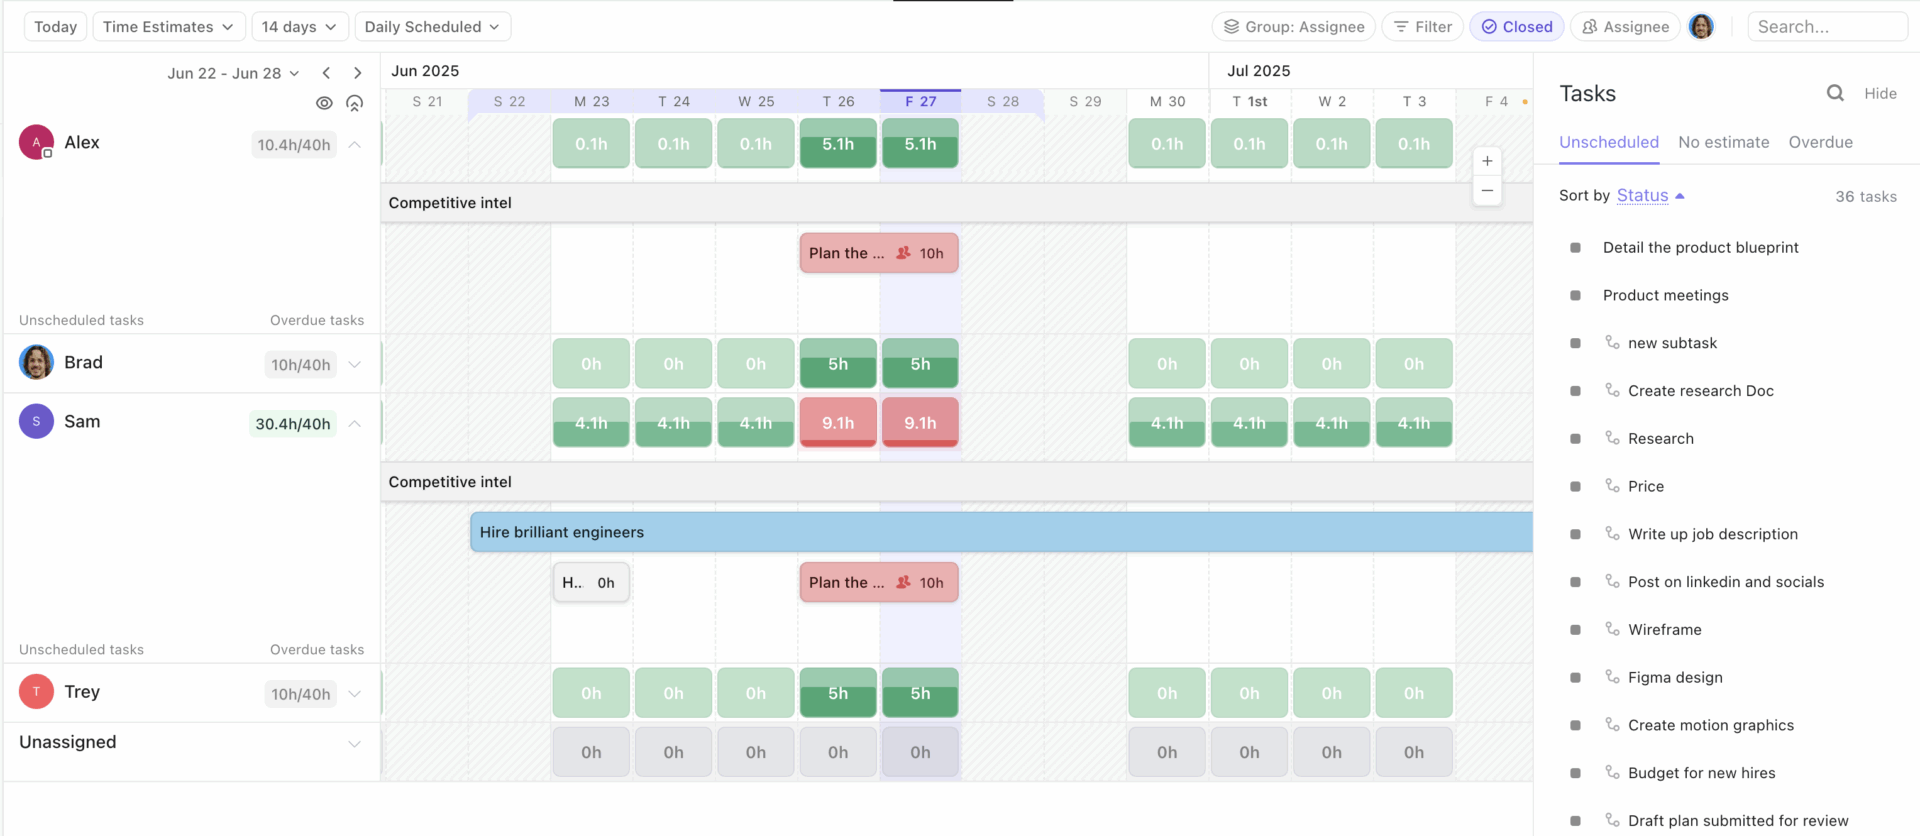
ClickUp uses simplified shades of green, yellow, and red to show whether someone is under capacity, nearing the limit, or overloaded. When I group the view by assignee, I get a clean row-by-row picture of what each person is carrying. I can still group by status or Custom Fields, but I treat those as analysis views, not capacity views.
Whether I’m measuring capacity planning and team productivity, I can choose what fits my team: number of tasks, time estimates, sprint points, or even Custom Fields.
And if I’m troubleshooting my own workload first, I can flip on Me Mode to filter the view down to what’s assigned to me or needs my attention. Non-working days also show in gray (outside the Month view), which helps explain why certain weeks look lighter at a glance.
💬 ClickUp case study: Real teams lean on customization to move fast. Cartoon Network’s social team notes that having one source of truth in ClickUp lets them act quickly and reduces create-and-publish time by 50%.
Take care of your employees, and they’ll take care of your business.
I treat workload balance as an important choice. When capacity stays invisible, problems show up late: missed deadlines and the quiet slide into burnout. If the work is stacked unevenly, even the best teams start to feel worn out and unseen. Here’s why:
📖 Also Read: Workload Management Tools to Boost Productivity
While we have covered what ClickUp Workload views can offer, it is important to share some of the key features that make it so great for me and my team. Here’s a quick overview:
💡 Pro Tip: You can use Custom Fields and AI Fields to sort work by skill and complexity.
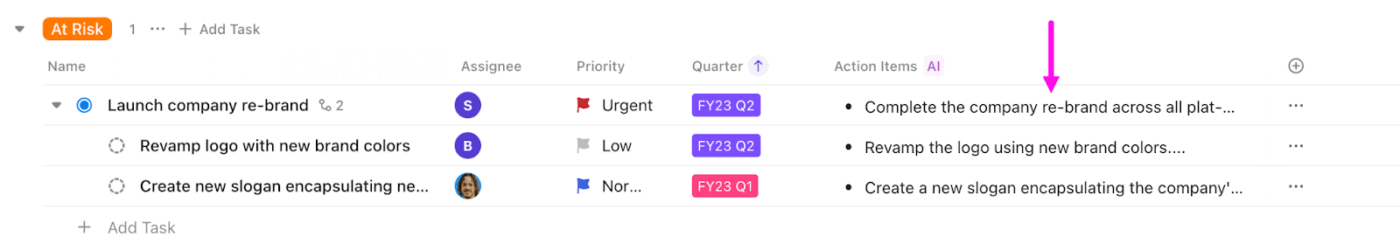
When workloads look “even” but outcomes still slip, it’s usually because effort isn’t comparable. I add structure to fix that.
Here’s where my practice meets the screen. These are the everyday moves my team and I use to plan fair weeks, spot crunch early, and keep promises without late nights.
Good resource management starts with an honest view of who can take what this week. ClickUps’s Workload view gives you that simple picture so you can place work without guesswork and keep people within healthy limits.
Lids used ClickUp to centralize schedules across construction, store planning, facilities, marketing, and more, which helped cut back-and-forth and make handoffs smoother.
The result was 100+ hours saved across teams and a 66% boost in weekly meeting efficiency because everyone could see the same plan and act on it. ✨
For me, that’s the practical payoff of capacity visibility: fewer back-and-forth pings and a more realistic week before work even starts.
📖 Also Read: Best Resource Management Software & Tools
Forecasting gets easier when my view of today’s capacity connects to next month’s milestones.
With Workload view tied to dates and estimates, I can spot future crunches early and decide whether to shift scope, pull in a contractor, or move non-critical work. Seeing availability by week or month helps me budget time the way I budget money, which keeps my promises to clients realistic.
I also notice patterns, like a testing spike after every feature push, and I can plan extra QA capacity ahead of time. That gentle rhythm is what keeps delivery steady across sprints and campaigns.
📌 Example: If future capacity is tight, adjust time estimates or move a due date before the crunch hits. You zoom to a monthly view and see QA turning red in week three. You move two tickets forward, book six hours of contractor time, and the launch timeline stays intact.
The capacity trends provide me insight into the status updates. If the same two people are marked red every Wednesday, I do not consider it a motivation problem. I am looking at a planning pattern that needs a tweak. Patterns in my team’s workloads reveal where I should manage their workloads differently and raise default time estimates.
Workload view clearly highlights these patterns, allowing me to adjust estimates or reassign responsibilities smoothly.
Over a few cycles, the reds fade, and my team’s energy improves because the plan finally matches the work.
💡 Pro Tip: Use ClickUp BrainGPT to turn workload spikes into a clear rebalancing plan.
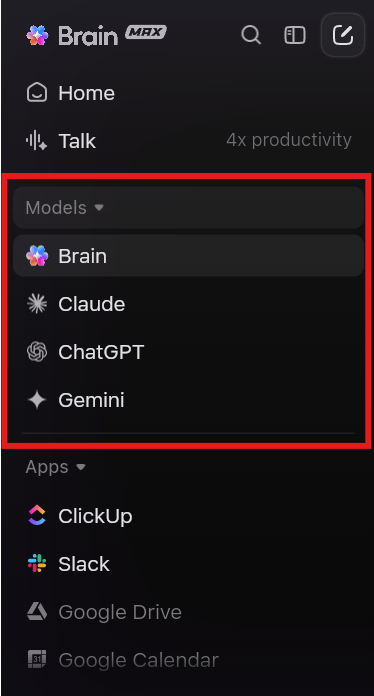
When I notice the same people hitting yellow or red in my Workload view week after week, I use ClickUp BrainGPT’s Talk to Text to pull the right context fast, then document the decision so the team actually follows the new plan.
Choose the right model for the job, on purpose: I keep the ClickUp BrainGPT model on when I want workspace-aware search and answers. If I’m writing a stakeholder note or want a second opinion on phrasing, I can easily switch models to ChatGPT, Claude, or Gemini.
Stakeholders make better calls when they can see real capacity and not just a green status. One view lets a project manager explain tradeoffs with real workload visibility instead of opinions.
Finastra brought its go-to-market work into ClickUp and saw a 40% lift in GTM efficiency and a 30% jump in collaboration because leaders could review workload and tradeoffs in one place.
That is how teams use ClickUp’s Workload views to turn a long meeting into a short decision. You can open the view, point to who is at the limit, who has room, and which tasks can move without breaking a dependency.
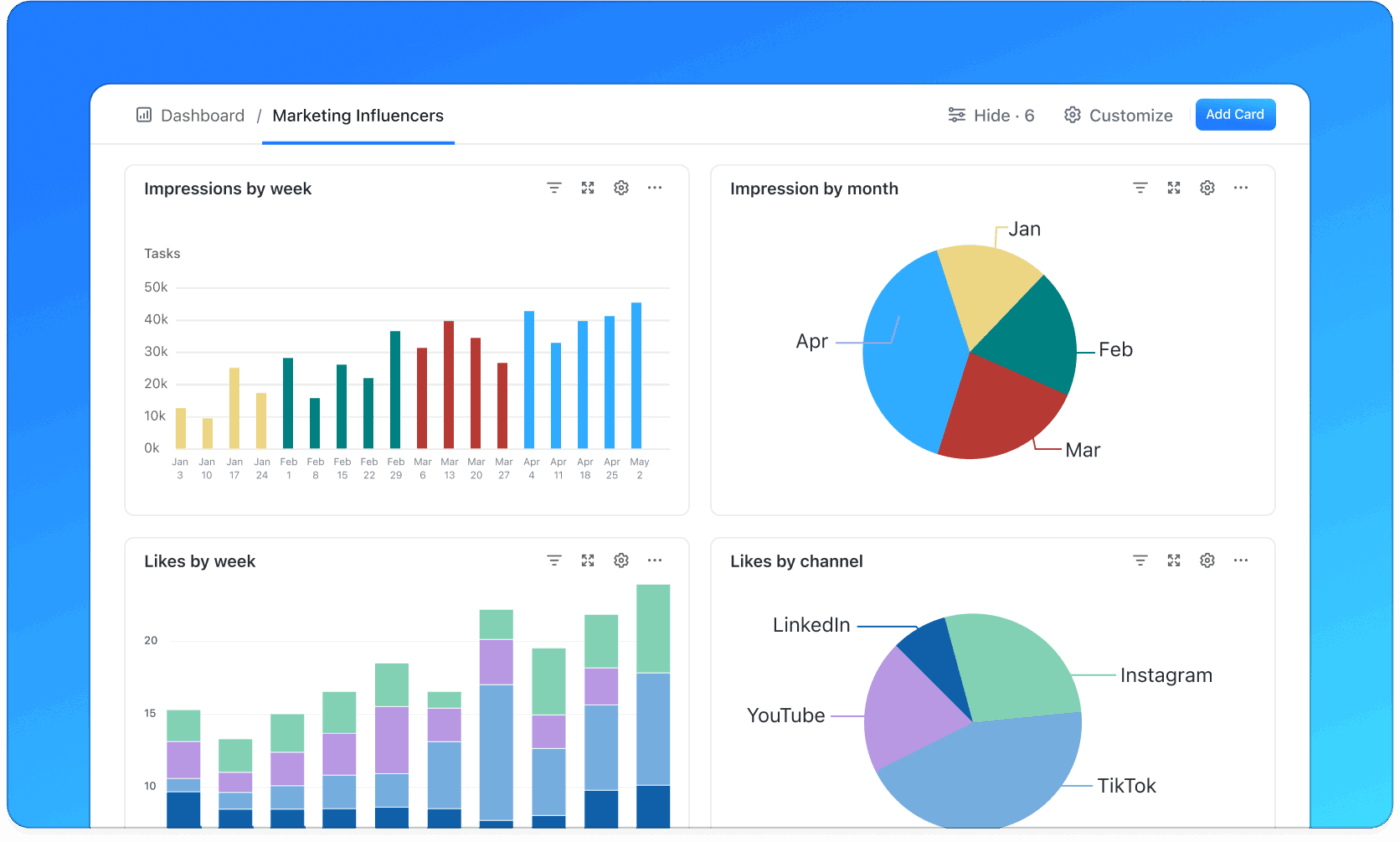
💡 Pro Tip: You can build a capacity dashboard once, then email it to stakeholders automatically. I pair Workload View with ClickUp Dashboards so stakeholders see workload signals without asking my team to rewrite updates.
📮 ClickUp Insight: Only 15% of managers verify workloads before assigning new tasks. Another 24% assign tasks based solely on project deadlines.
The result? Teams end up overworked, underused, or burned out.
Without real-time visibility into workloads, balancing them isn’t just hard—it’s almost impossible.
ClickUp’s AI-powered Assign and Prioritize features help you assign work with confidence, matching tasks to team members based on real-time capacity, availability, and skills. Try our AI Cards for instant, contextual snapshots of workload, deadlines, and priorities.
💫 Real Results: Lulu Press saves 1 hour per day, per employee using ClickUp Automations—leading to a 12% increase in work efficiency.
Setting up Workload views in ClickUp takes just a few minutes and pays off every week by giving you (and me) a clear, honest picture of who can take what.
Here are the steps involved:
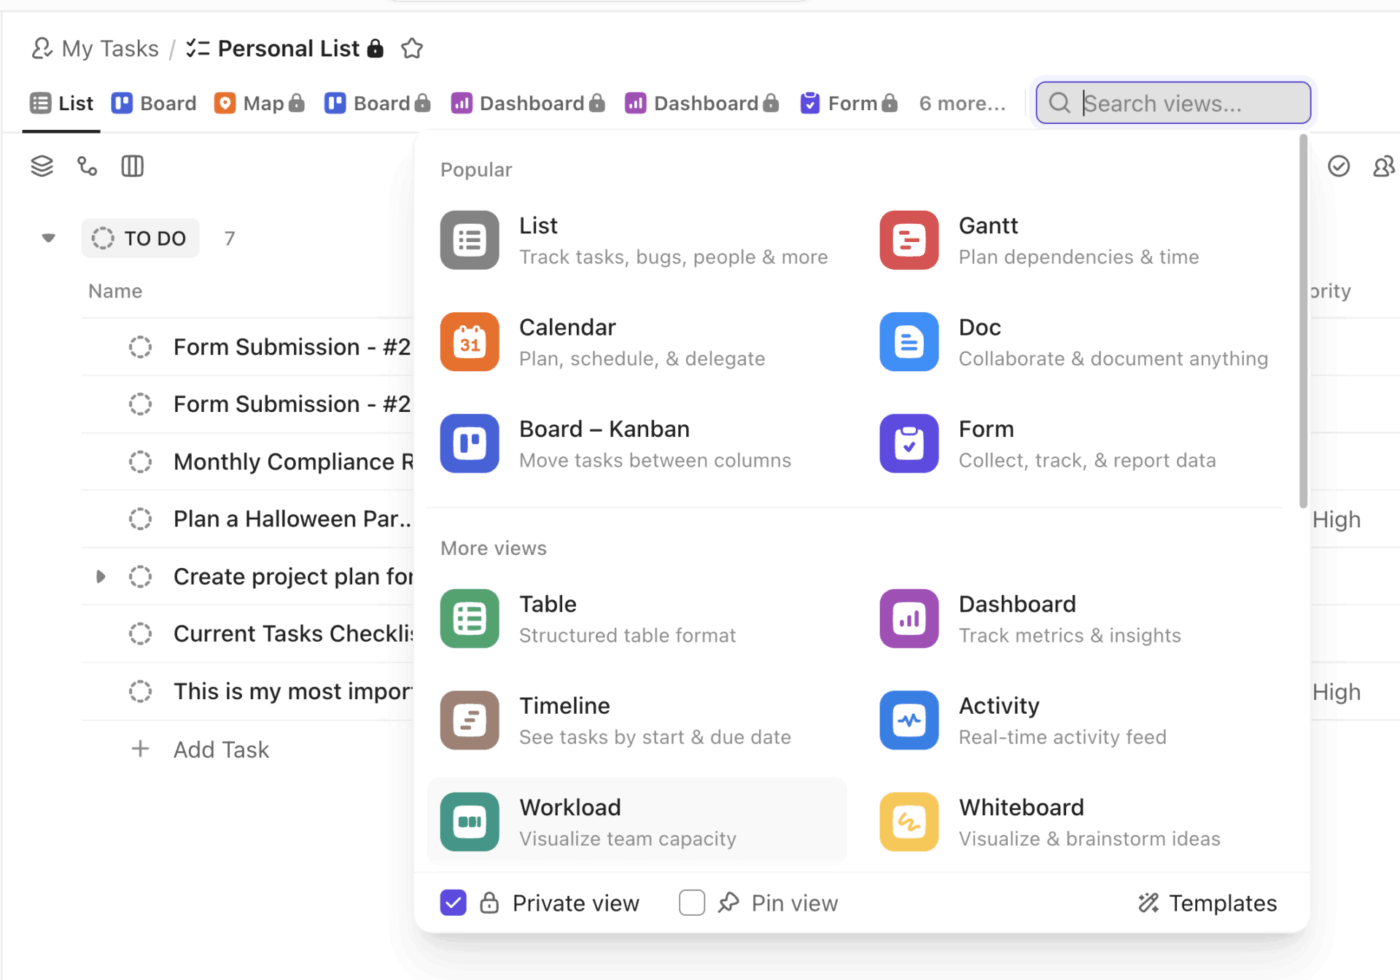
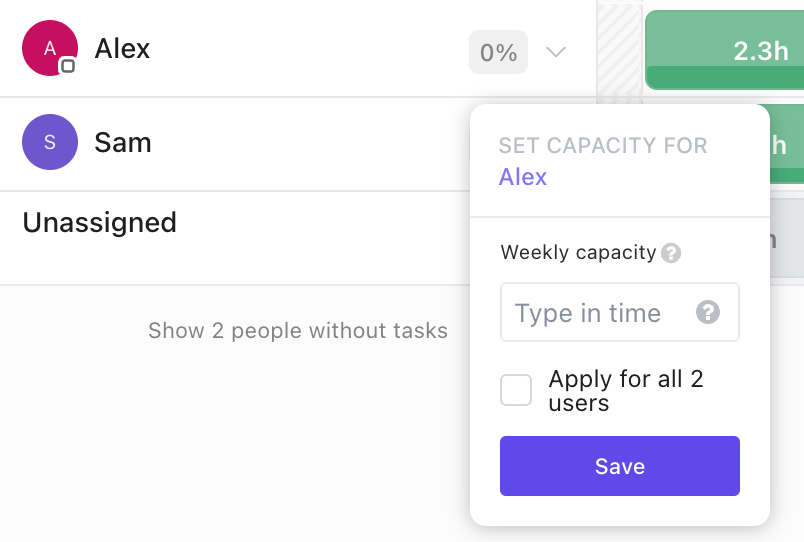
Start by adding a Workload View and choosing how you’ll measure effort so capacity is honest for your team. Keep the setup light, name it clearly, and set fair daily limits so the picture you see matches reality.
📖 Also Read: Free Team Capacity Planning Templates.
I generally keep my team’s Workload view open during planning and check-ins so changes appear as the team works
Here’s how you can make this work: Use the Workload view as your workload management hub during standups for clear visibility of moving tasks. Anchor the timeline to a start date to get an accurate picture of the week. Then follow the following steps:
Make small moves early when you see yellow or red. Protect healthy weeks by sharing work, splitting tasks, or shifting dates before crunch sets in.

Pair day-to-day balancing with lightweight reporting so leaders see the story behind the colors. This typically helps me keep everyone aligned to one source of truth and protect the view once it’s dialed in.
📖 Also Read: How to Improve Workload Distribution in Your Team
Use each cycle to make the next one easier. The goal is fewer red bars, steadier delivery, and a team that trusts the plan. That’s how ClickUp uses Workload views to keep people healthy and projects predictable.
💡 Pro Tip: You can turn ClickUp Brain into your weekly “capacity risk scan.” When I’m staring at a few red bars in Workload View, I don’t want to open 20 tasks just to figure out what actually changed.
I use it to:
Late evening work has become the new normal across industries. Microsoft’s Work Trend Index shows a 16% rise in meetings after 8 p.m., with more messages landing outside work hours too.
This tells me balanced planning is more than a wonderful idea. It is a requirement if I want steady delivery and a healthy team. And here are the best practices I follow when I use Workload views for this purpose:
✅ Set fair daily capacity first, then fit work into it, not the other way around. This ensures your plan respects real energy and prevents late-night spillover that shows up as after-hours meetings and weekend email checks
✅ Keep Workload view and a simple dashboard side by side during standups. This can help you rebalance in the moment and avoid the “work about work” tax that eats half the day in many teams
✅ Use one unit of effort per team hours, points, or task count. Stick with it for a full cycle so trends are readable and you can show stakeholders how ClickUp uses Workload views to keep weeks predictable
✅ Color by status or priority and include subtask rollups so hidden effort is visible. Then make small moves early: split a task, pull a due date forward by a day, or reassign to the first green row you see
✅ Close the loop on Fridays by comparing planned versus actual in a dashboard. You can then update default estimates where they ran tight, and make adjustments in your team’s workloads so you can hit your weekly targets better
Here are two quick snapshots from real teams to ground the concept in everyday work. They show how ClickUp Views create one shared plan first, then how Workload view balances capacity so the plan actually holds.
Seequent’s teams plan work in estimated hours and need to balance availability with stakeholder expectations week by week.
With ClickUp’s Workload view, managers monitor capacity and allocate tasks based on each person’s skills and remaining hours, then use comments and task updates to keep everyone aligned.
The view makes it obvious when a day is full and when a small shift will prevent a crunch, so deadlines hold without late nights.
Because the same capacity picture rolls up into timelines, stakeholders get honest dates instead of optimistic guesses. The net effect is steadier throughput and fewer fire drills.
📖 Also Read: How to Manage a Team: Skills, Strategies, Tools
QubicaAMF adopted ClickUp to organize complex, multi-team projects and saw a 35% increase in on-time delivery with 40% less time spent creating reports and charts.
Centralizing schedules and status in ClickUp gave managers a clear line of sight into what was due next and who had room, which is exactly the point of checking Workload view alongside timelines.
When reporting takes less time, teams can use Workload view during standups to identify red days early and reassign work before deadlines drop.
📽️ See how to turn the capacity signals you’ve been tracking in Workload view into clear, executive-friendly dashboards.
If this piece had one message, it would be this: plans work when people do.
In order to organize tasks and manage workloads and increase my team’s productivity, I’ve often relied on using ClickUp’s Workload view. It easily helps catch overdue tasks and is ideal for capacity planning and effective workload management.
So, why ClickUp over the rest?
ClickUp gives you a live picture of who can take what and keeps timelines, goals, and dashboards close, so every tweak makes sense in the overall project, whether it is client work or internal processes.
Keep internal meetings short and purposeful so the plan stays clear. Use your ClickUp Workspace to stay organized as priorities shift and the week unfolds.
If you want a great, focused start on your next Monday, sign up for ClickUp for free!
ClickUp’s Workload view is a live people-by-time view that shows who is doing what and how much room each person still has. You can look by day, week, or month and plan fair weeks without guesswork. This is how ClickUp uses workload views to keep schedules clean.
You set a healthy daily capacity for each person, then watch colors and totals to spot overload early. If someone tips into yellow or red, you can move a task, split it, or shift a date in seconds so no one is pushed past a fair day.
Yes. You can measure work in hours, task count, points, or a custom field. If your team estimates in hours, Workload view adds those up against each person’s daily capacity so you always see how much time is left.
Use Workload for the daily shuffle and a dashboard for the story behind it. Dashboards track trends like overdue items and upcoming milestones, while Workload shows today’s capacity. Together they make status calls short and decisions clear.
Yes. Group by assignee to see total load across lists and spaces, filter by project or priority, then drag tasks to even out the week. It is a simple way to keep multi-project teams steady while showing stakeholders real availability.

© 2026 ClickUp

There’s an easier way. Try a free AI Agent in ClickUp that actually does the work for you—set up in minutes, save hours every week.