


Still downloading templates?
There’s an easier way. Try a free AI Agent in ClickUp that actually does the work for you—set up in minutes, save hours every week.
Sorry, there were no results found for “”
Sorry, there were no results found for “”
Sorry, there were no results found for “”


During your standup, someone asked if the sprint is on track. You opened a chart, nodded confidently, and read off a chart. Halfway through lunch, you realize that you might’ve just lied to everyone. Yep, that happens to the best of us.
The burnup chart vs. burndown chart mix-up has derailed more sprint reviews than anyone admits out loud. They look similar: lines that move (simply put, of course). But they tell wildly different stories about whether you’re winning or slowly sinking.
Let’s fix that confusion for good. As a bonus, we’ll also show you how ClickUp makes tracking both bearable. 🤩
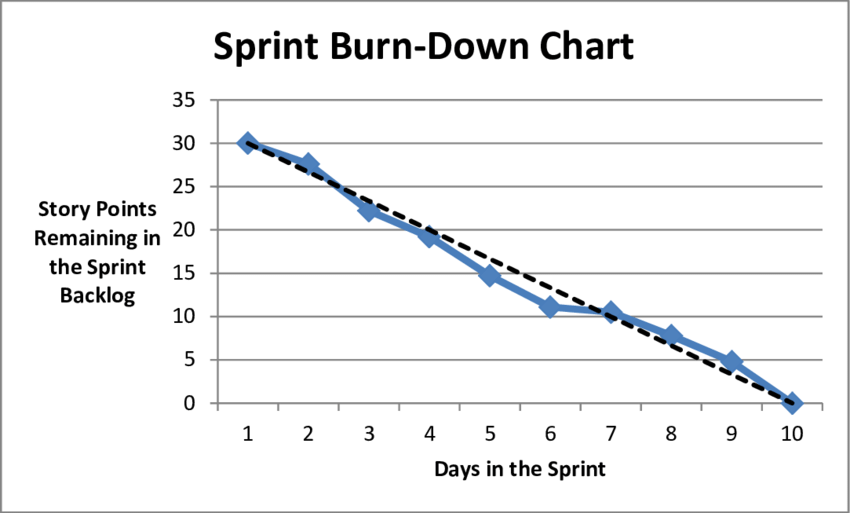
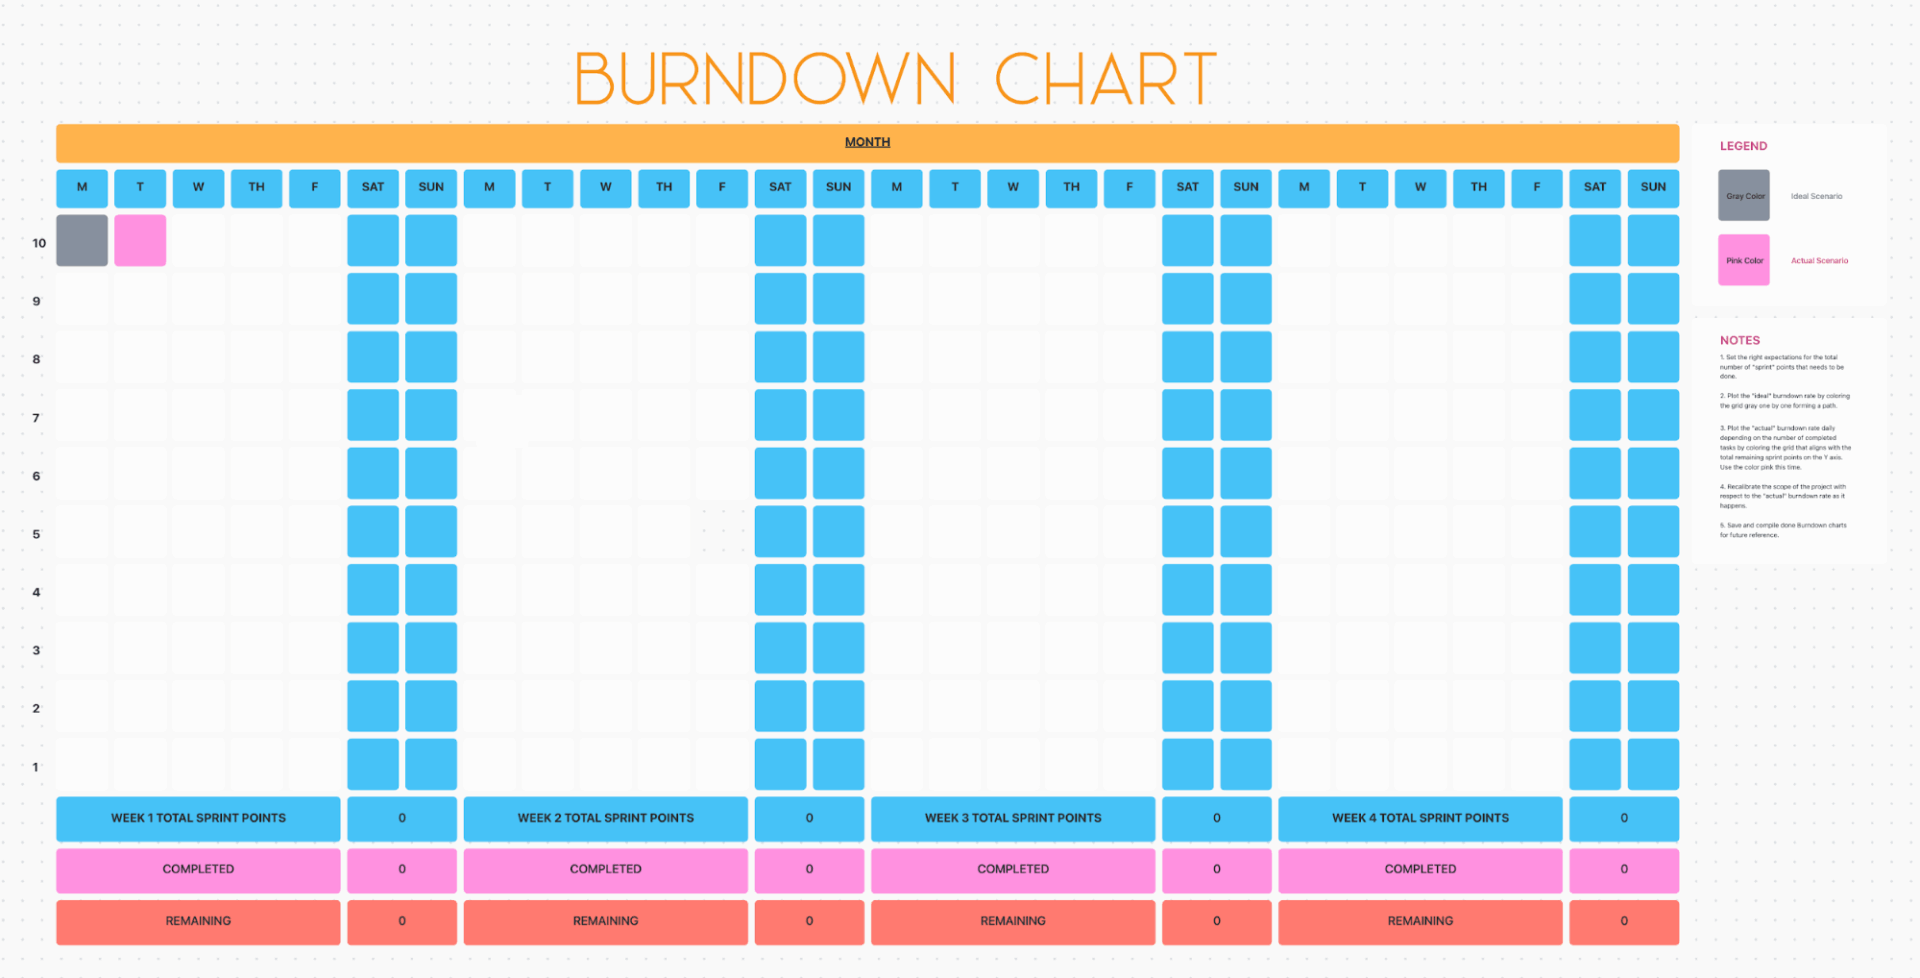
A burndown chart is a visual tracker that shows how much work remains in a sprint or project over time. The line starts high and ideally slopes down to zero by your deadline.
For instance, your team starts a two-week sprint.
On day one, the chart shows 80 points remaining; by day five, you’ve completed 35 points, so the line drops to 45. And by day 10, you’re down to 15 points remaining. If all goes well, that line hits zero on day 14, and everyone celebrates.
🔍 Did You Know? Scrum’s name actually comes from a 1986 Harvard Business Review paper comparing innovative teams to a rugby scrum: tight, coordinated, and moving as one unit.
The vertical axis shows the amount of work left, measured in agile story points, hours, or tasks, and the horizontal axis shows time, broken down by days or weeks.
As your team completes work, the line moves downward. Most burndown charts include an ideal trajectory line that represents perfect pace. If your actual line sits above this ideal line, you’re behind schedule, and if it’s below, that means you’re ahead.
📮 ClickUp Insight: 45% of workers have thought about using automation, but haven’t taken the leap.
Factors like limited time, uncertainty about the best tools, and overwhelming choices can hold people back from taking the first step toward automation. ⚒️
With its easy-to-build AI agents and natural language-based commands, ClickUp makes it easy to get started with automations. From auto-assigning tasks to AI-generated project summaries, you can unlock powerful automation and even build custom AI agents in minutes—minus the learning curve.
💫 Real Results: QubicaAMF cut reporting time by 40% using ClickUp’s dynamic dashboards and automated charts, transforming hours of manual work into real-time insights.
Here’s why teams keep coming back to these agile project management charts:
Burndown charts come with blind spots that can mislead your team:
🔍 Did You Know? Our brains rely heavily on visual cues. When progress is shown visually (charts, boards, trackers), it activates the same reward systems linked to game progress, even if the overall workload hasn’t changed. Hence, why burnup and burndown charts ‘feel’ motivating.
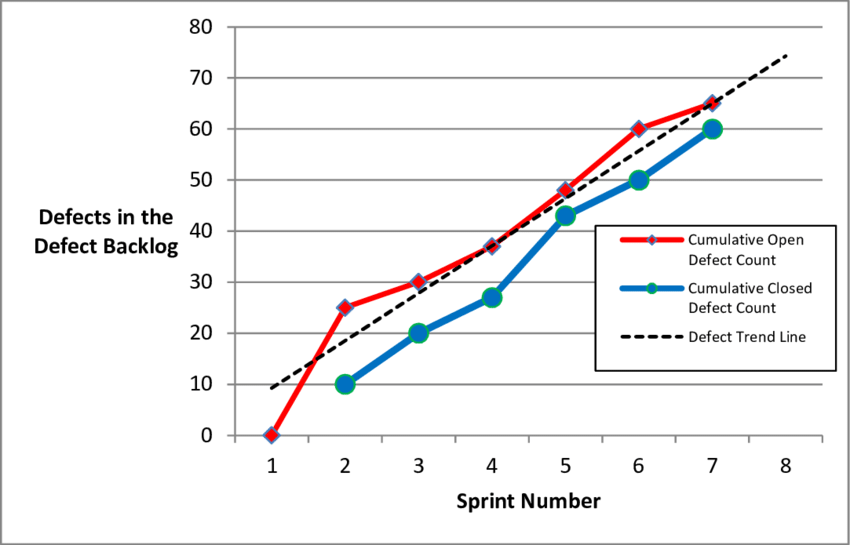
A burnup chart is a visual tool that shows both completed work and total scope over time. Two lines move upward: one tracking what’s done and the other tracking the full workload.
Take that same example sprint. Day one starts with the completed work line at zero and the total scope line at 80. By day five, your completed work line climbs to 35 while the scope line stays at 80.
Then on day seven, a stakeholder adds 20 points of urgent work. The scope line jumps to 100, but your completed work line keeps climbing steadily to 50. Everyone can see exactly what happened: the team’s moving at the same speed, but someone just moved the finish line.
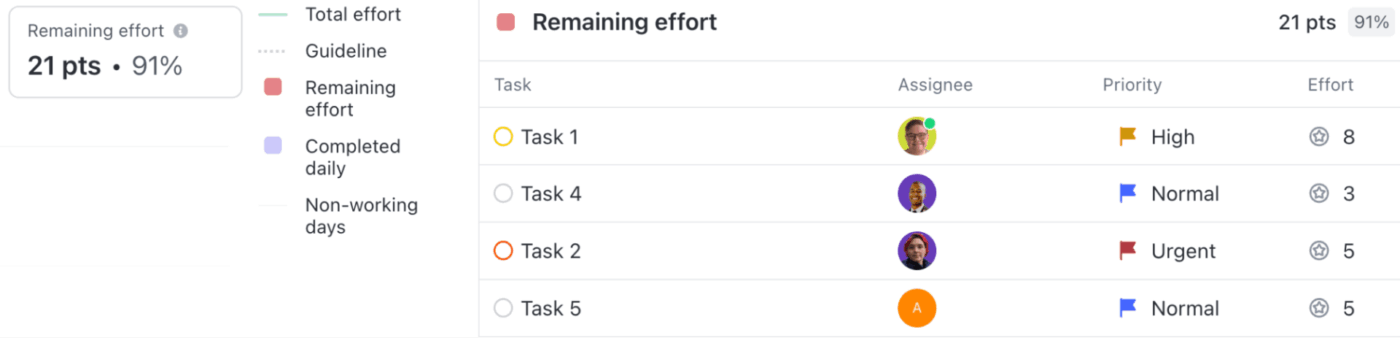
🚀 ClickUp Advantage: Teams lose time when they cannot tell what needs attention in the sprint. ClickUp Brain, the platform’s built-in AI assistant, surfaces the few tasks slowing progress so the team focuses on the right fixes instead of scanning the entire board. Since it’s integrated in your workspace, it knows your docs, tasks, project progress, and work better than you.
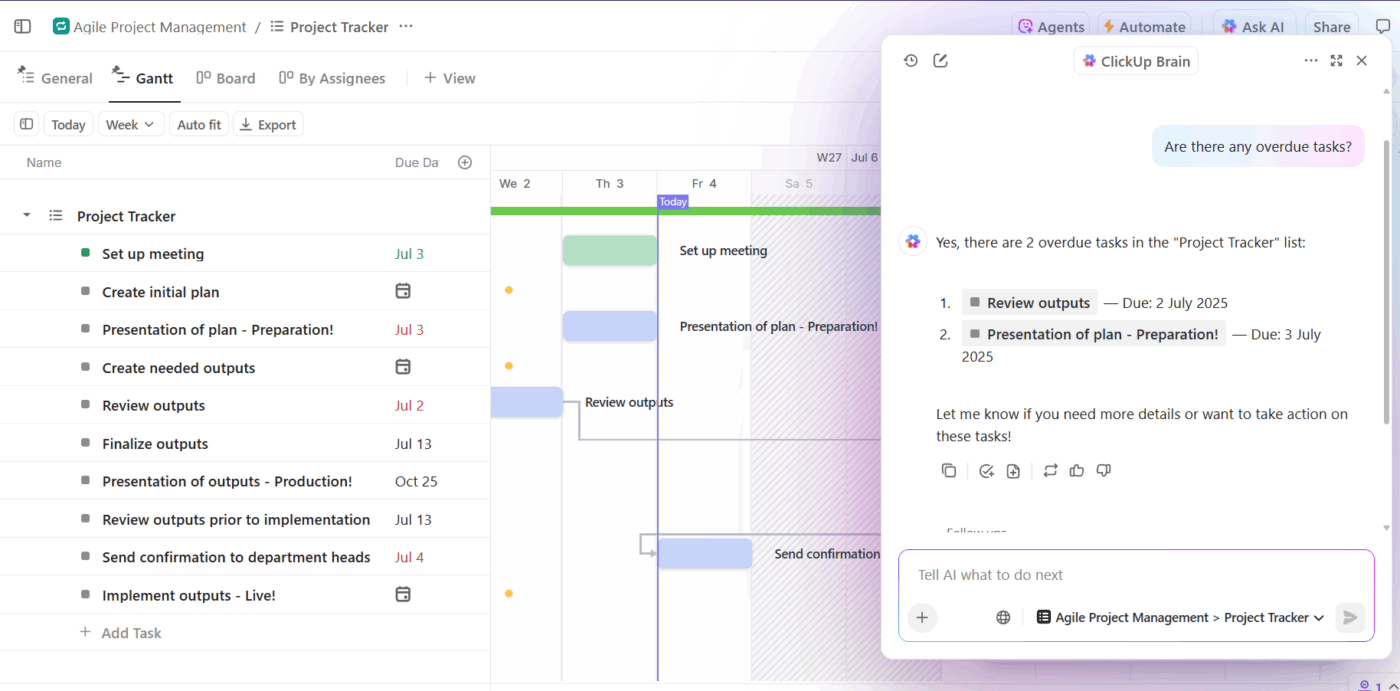
📌 Example Prompts:
Here’s where burn-up charts have the edge:
🔍 Did You Know? Humans perceive progress in an ‘S-curve.’ Early work feels slow, mid-project feels fast, and the end feels slow again. Burnup charts often reveal this natural pattern more clearly than burndown charts.
📖 Also Read: Scrum vs. Kanban: Which One Is Best for You?
Using burnup charts has its downsides:
📖 Also Read: Gantt Chart Resources – Examples, Templates & Tools
Project managers often confuse burnup and burndown charts because they look similar, but each one answers a different question as work moves through the project life cycle.
Here’s a clear, simple breakdown to help you choose the right one for your workflow. 👀
| Feature | Burnup chart | Burndown chart |
| What it shows | Completed line for work rising toward the total scope | Remaining work that is decreasing toward zero |
| Purpose | Show progress and scope in one view | Show how quickly the team is reducing work |
| Scope visibility | Displays scope changes clearly with a separate scope line | Hides scope changes, which can make trends misleading |
| Progress insight | Helps teams see whether they’re approaching completion even if requirements shift | Helps teams assess if they’re on track to finish within the sprint timeline |
| Visual structure | Two lines: one for completed work and one for total scope | One line: remaining work over time |
| Best suited for | Work where requirements may evolve | Fixed-scope sprints with predictable workloads |
| Strength | Clear representation of scope creep and total progress | A simple and easy way to track burn rate day by day |
A burndown chart works best for fixed-scope projects where the workload is clearly defined at the start.
It’s simple, focused, and pairs well with sprint planning without overwhelming the team with extra data. Since the goal of a sprint is to finish a fixed amount of work within a short window, seeing the remaining workload drop toward zero helps everyone stay aligned and adjust quickly if progress slows.
🔍 Did You Know? In 1995, when Scrum was first officially introduced, the average sprint length was 1-4 weeks. The maximum duration was one month. Today, most teams use 2-week sprints because shorter cycles boost dopamine from faster feedback loops.
A burnup chart works better when requirements keep shifting because it shows completed work and total scope on separate lines. It gives leaders a transparent view of how work is progressing across the entire project.
When teams reference a broader project roadmap, the burnup chart gives a clearer picture of how progress compares to the evolving target. It makes scope creep immediately visible and keeps conversations grounded in facts rather than assumptions.
🔍 Did You Know? Workers gain motivation from ‘psychological momentum‘ – the sense that progress is continuing steadily. Even small forward movement creates momentum, which is why tracking velocity and cumulative work helps teams push through complex sprints.
Using both charts gives teams a rounded, more accurate view of progress. The burndown chart highlights short-term velocity, while the burnup chart shows long-term movement toward the goal and any possibility of a scope shift.
This combination strengthens project tracking because teams can catch issues early, understand the ‘why’ behind changes, and communicate status confidently with stakeholders.
Once you understand how progress is tracked, the next challenge is keeping those insights visible across your workspace—which is where ClickUp comes in.
🚀 ClickUp Advantage: When your work sprawls across apps, documents, tickets, chats, and research, finding answers becomes slow and fragmented. ClickUp BrainGPT, a desktop AI companion, unifies search and reasoning across:
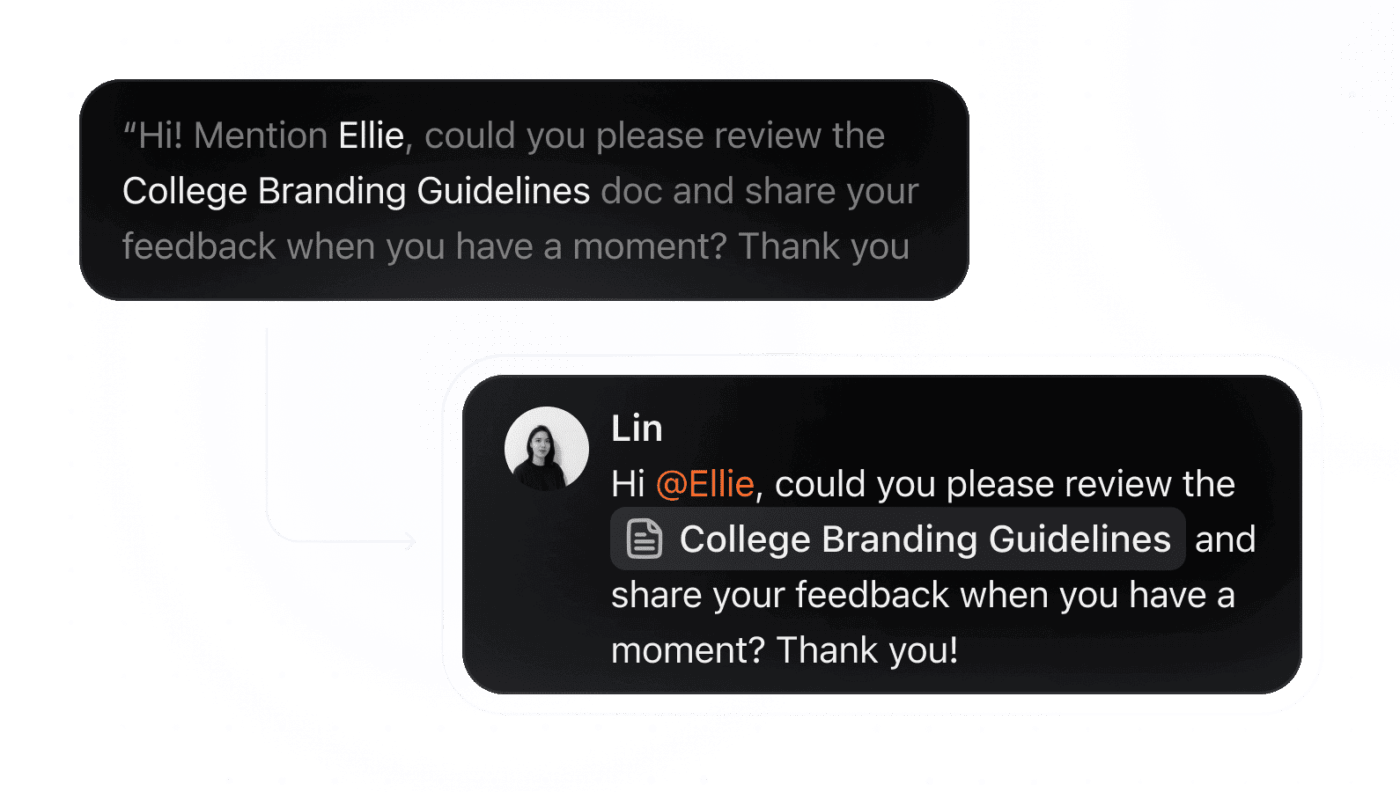
And when you’re moving fast, Talk to Text in ClickUp Brain MAX helps you work 4x faster. You simply dictate valuable insights or requirements, and the tool will format them for you, ready to be added to a task.
Here’s how it helps eliminate AI sprawl:
Teams often switch between burnup and agile burndown charts depending on the type of work, the level of uncertainty, and how closely they need to monitor progress.
Here are practical scenarios that show when each chart makes the most sense. 📈
Your team starts a two-week sprint with a fixed set of tasks and no expected mid-sprint changes. You want a simple daily view that shows whether you are reducing work at the right pace.
A burndown chart fits this because the remaining-work line shows if the team is ahead or behind. This works well in an agile scrum workflow where predictable delivery is the focus.
You are building a new user-facing feature and stakeholders keep requesting small enhancements after each demo. The scope grows slightly every few days, and the team needs clarity on whether progress is real or only feels slow because the target keeps shifting.
A burnup chart is better here because it shows completed work and total scope as separate lines. This helps when you maintain a detailed work breakdown structure that continues to change.
🔍 Did You Know? People often overestimate how long difficult tasks will take (called ‘impact bias’), which makes them procrastinate. But once they begin, they usually complete tasks faster than predicted. This is one reason why breaking complex work into smaller chunks increases follow-through.
Your team is preparing a customer-facing launch that involves engineering, design, marketing, and legal. Each group follows its own timeline, and approvals can delay certain tasks.
Since the overall timeline is not fixed, a burnup chart gives leadership an honest view of progress and how changes affect scope. This way, you can explain why timelines move, especially when the project schedule shifts due to cross-team dependencies.
🧠 Fun Fact: People feel more motivated when they see visible progress, even small wins. This is called the Goal-Gradient Effect. Your brain speeds up effort as you get closer to completion (which is exactly why burndown charts work!).
ClickUp acts as a Converged AI Workspace, which means your tasks, docs, updates, sprint data, reporting, and AI assistance sit in one system, which eliminates tool sprawl.
Here’s a closer look at how the agile tool supports you. 👇
The ClickUp Burndown Chart Template gives you a solid starting point. Define each KPI as a ClickUp Task. Then layer on ClickUp Custom Fields like Target Value, Actual Value, Progress, and even Previous Period or Variance. This way, you capture the number and context around it: how it compares to your goal, whether you’re trending up or down, and which team owns it.
The template offers ClickUp Custom Statuses, such as On Track, At Risk, Completed, and Not Started, to define each KPI’s state.
Let’s say you’re running a 12-day sprint for a payments update. You load ‘Sprint 14’, drop in your 60 estimated story points, and map everything to meaningful Statuses. Day two rolls in, your backend engineer ships a 5-point story, QA closes a 3-point Task, and the remaining-work line drops right away.
Hear from Dayana Mileva, Account Director at Pontica Solutions:
With ClickUp, we went one step ahead of the game and created dashboards where our clients can access and monitor performance, occupancy, and projects in real time. This allows clients to feel connected to their teams, especially given that they are located in different countries, and sometimes even on different continents.
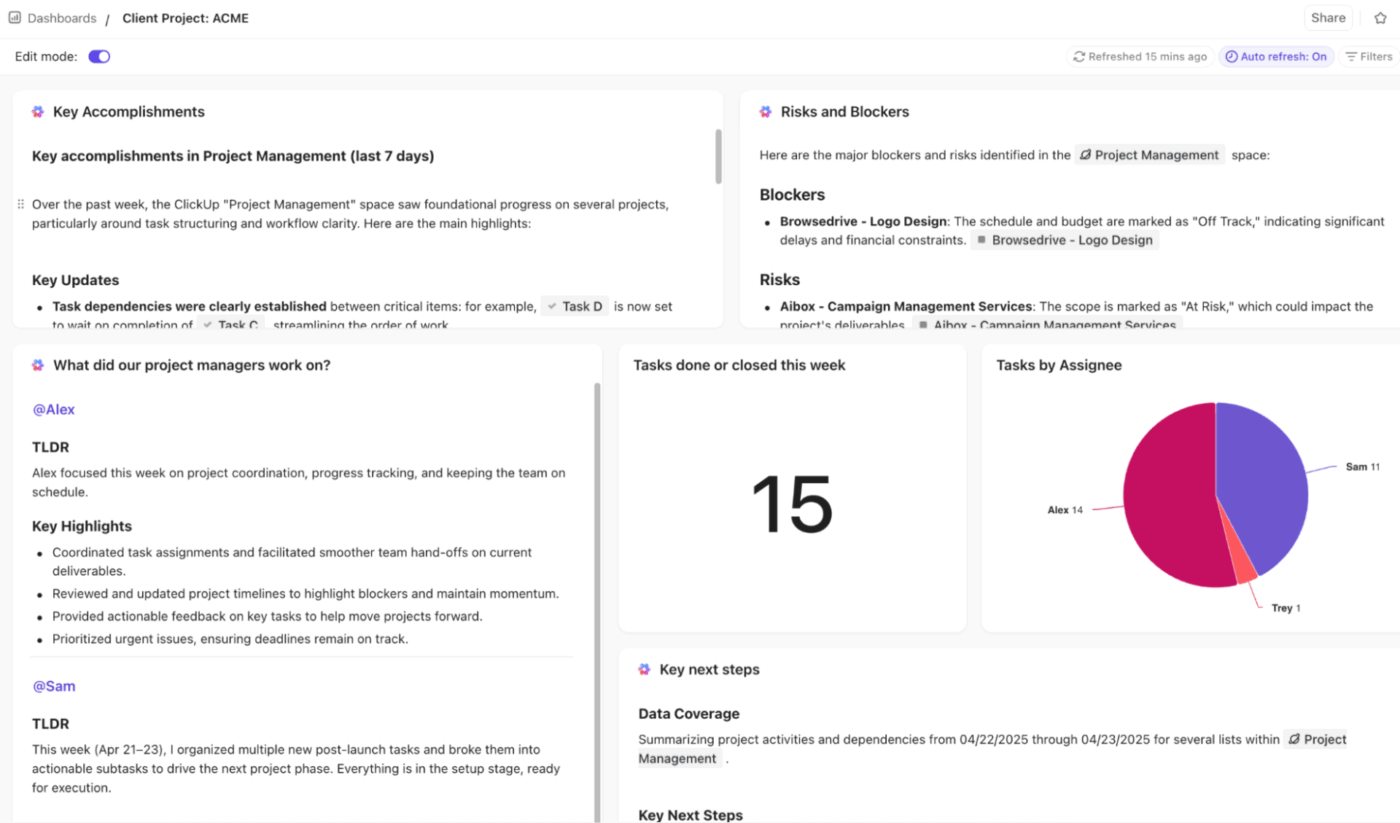
Built within the platform (and integrated with ClickUp Templates!), ClickUp Dashboards let you create customizable hubs that visualize information from across teams or departments. You can use bar charts, line graphs, gauges, or number tiles depending on the story: sales performance, marketing reach, operational efficiency, customer service metrics, or employee-related KPIs.
Dashboards work best when you focus them on the two charts that guide sprint decisions: burndown for pace and burnup for scope.
Suppose you build a ‘Sprint 22 Control Panel’. You add a Sprint Burndown Card on the left and a Sprint Burnup Card on the right. That pairing makes it easier to spot the real reason pacing slips.
When you’re halfway through the sprint, your dashboard shows:
Those two charts, sitting next to each other, tell a very different story from velocity issues. The team didn’t slow down; the sprint changed. That gives you a clear next step: drop a nonessential story and move the new polish tasks into Sprint 23 instead of forcing unrealistic pacing.
Sprint Burndown Cards update whenever someone moves a Task. If the ideal line expects 12 completed points on day two and your actual line shows only 6, you check your board and find three tasks stranded in review.
A quick nudge during standup gets them moving again.
💡 Pro Tip: Configure a KPI dashboard with AI Cards that pull in data from multiple sources. As the data updates, ClickUp Brain highlights trends and anomalies (e.g., a sudden drop in sprint velocity or a spike in defect count. You avoid sifting through raw numbers manually.
Combine this with Talk-to-Text. Dictate your updates, trigger an AI Card to recalculate metrics, and refresh charts: burndown, burnup, scope-vs-velocity, etc. You’ll have an up-to-date dashboard before the next stand-up or leadership check-in.
Burnup charts matter when the sprint refuses to stay still.

The Sprint Burnup Card separates completed work from the total scope, so changes show up instantly. Let’s say QA adds four accessibility scenarios worth 10 points. The scope line lifts, the progress line stays steady, and you immediately know you’re aiming at a moving target.
Watch this video to learn how to create a PM dashboard:
Sprint charts make work feel clearer when teams move fast and manage shifting goals.
Burndown charts keep everyone focused on today’s pace, while burnup charts help you understand how the scope evolves. The right choice depends on the level of change around your project, but both charts give your team more confidence and fewer surprises.
ClickUp gives you both views without extra effort because every task already carries the data your charts need. You track progress, catch scope changes early, and run sprints with fewer detours. Dashboards, Sprint Cards, and ClickUp Brain turn your workspace into a control room that updates in real time as your team moves a Task. Sign up for ClickUp today! ✅

© 2026 ClickUp

There’s an easier way. Try a free AI Agent in ClickUp that actually does the work for you—set up in minutes, save hours every week.