


Still downloading templates?
There’s an easier way. Try a free AI Agent in ClickUp that actually does the work for you—set up in minutes, save hours every week.
Sorry, there were no results found for “”
Sorry, there were no results found for “”
Sorry, there were no results found for “”
65% of projects fail due to poor estimation and risk management, and 35% because of poor planning and user documentation.
You can avoid joining that number and execute projects properly by investing in a reliable project reporting tool. It keeps everyone in the loop, shows you what’s working, and gives you enough warning before anything significant blows up.
We’ve rounded up the best project management reporting software to help you plan better, work together more smoothly, and stay on top of your project’s progress.
Project reporting tools are software applications that help project managers and teams collect, organize, and present data about a project’s progress, timelines, resource usage, budgets, and potential risks.
They are essential to any project management software, turning complex data into clear, actionable insights through dashboards, charts, and status reports.
A good project management tool with reporting features will help you answer important questions like:
In short, they support everything from team management to risk tracking. They provide an accurate view of project health, help identify problems early, adjust plans as needed, and streamline client management.
This ultimately increases your chances of delivering a successful project on time and within scope.
Did You Know: 55% of employees don’t have access to real-time project KPIs. In fact, 50% report spending one or more days manually sifting through project data and compiling reports.
Here’s our project reporting software comparison based on features, USPs, and pricing:
| Tools | Best for | Key features | Pricing* |
| ClickUp | Reporting templates, Google Analytics, and BigQuery integration | Built-in AI for automatic report generation, customizable dashboards, time tracking, goal monitoring | Free plan available; Custom pricing available for enterprises |
| Jira | Technical teams in mid to large-scale companies | Backlog tracking, sprints, customizable dashboards | Free plan available; Paid plans start at $8.60/month per user |
| Power BI | Large companies with complex data needs | Real-time data streams, DAX formulas, integration with Microsoft 360 | Free plan available; Paid plans start at $14/month per user |
| Tableau | Large and mid-sized companies needing advanced reporting capabilities | Graphical data reports, AI agents, ML Code integration | No free plan; Paid plans start at $15/month per user |
| Looker Studio | Small to mid-sized businesses and agencies creating reports for others | Mid-sized and large-scale businesses that need reporting along with task management | Free plan available; Paid plans start at $9/month per user |
| Wrike | Small businesses and marketing agencies that need basic reporting | Real-time collaboration, workflow automation, customizable dashboards | Free plan available; Paid plans start at $10/month per user |
| Microsoft Project | Large-scale IT and construction companies tracking multiple projects | Portfolio management, stakeholder reports, project snapshots | Free plan available; Paid plans start at $10 /month per user |
| Celoxis | Large-scale enterprises building advanced project reports and dashboards | Risk management, custom reports, team performance analysis | No free plan; Paid plans start at $25/month per user |
| Basecamp | Small businesses and marketing agencies who need basic reporting | Workforce sentiment analysis, task reports | Free plan available; Paid plans start at $15/month per user |
| Trello | Freelancers and small agencies needing lightweight tracking of projects | Kanban boards, progress tracking, customizable charts | Free plan available; Paid plans start at $5/month per user |
| Zoho Projects | Enterprises looking to track budgets and milestones of multiple projects | Project milestones, custom reports, budget tracking | Free plan available; Paid plans start at $5/month per user |
| Rippling Analytics | Startups, mid-sized businesses, and enterprises focusing on workforce analysis | Workforce analytics, OKR monitoring, budget tracking | Custom pricing |
| Forecast.App | IT companies, non-profits, and research teams seeking workload and time tracking | Rate cards, billing automation, AI-assisted timesheets, risk trackers | Custom pricing |
| TeamGantt | Agencies, product and planning teams, and mid to large-sized companies seeking data visualization tools | Gantt charts, workload tracking, task dependencies | No free plan; Paid plans start at $59/month |
| Asana | Small to mid-sized businesses looking to manage and report on tasks | Blocker detectors, trend and project health tracking, built-in AI | Free plan available; Paid plans start at $13.49/month per user |
Here are some of the best project reporting tools to help you stay on top of project progress and keep every task on track. We will discuss their features, limitations, pricing, and more to help you choose the best one for your business.
Our editorial team follows a transparent, research-backed, and vendor-neutral process, so you can trust that our recommendations are based on real product value.
Here’s a detailed rundown of how we review software at ClickUp.
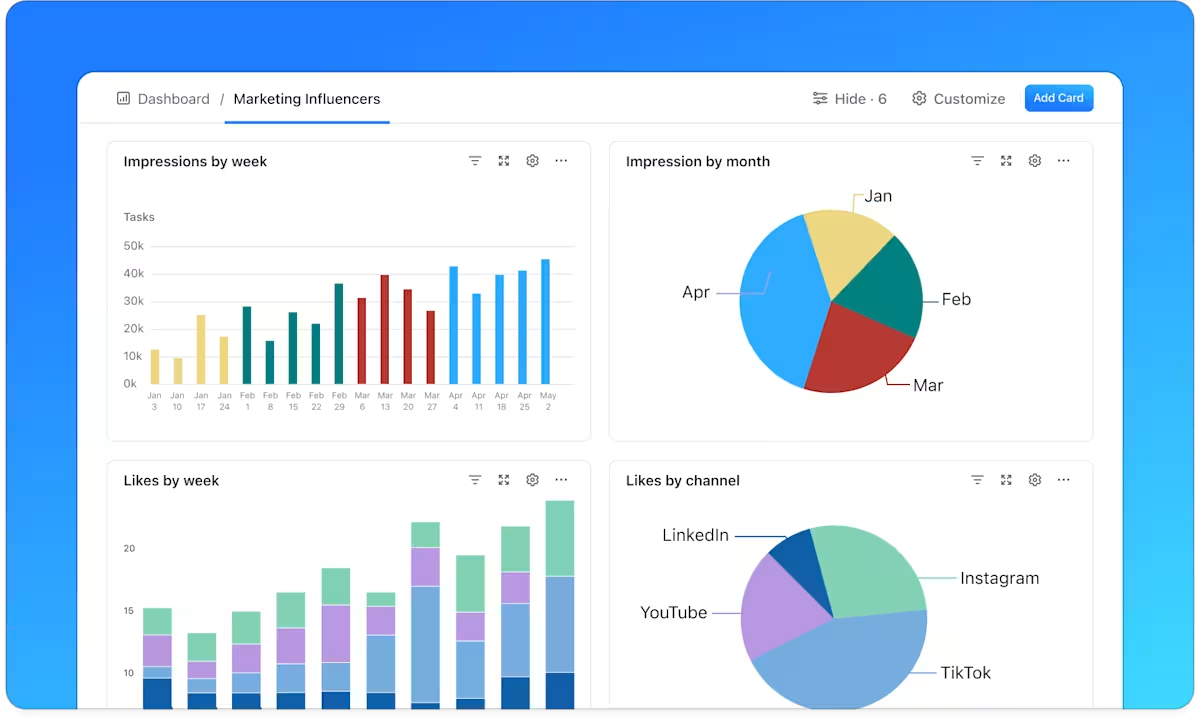
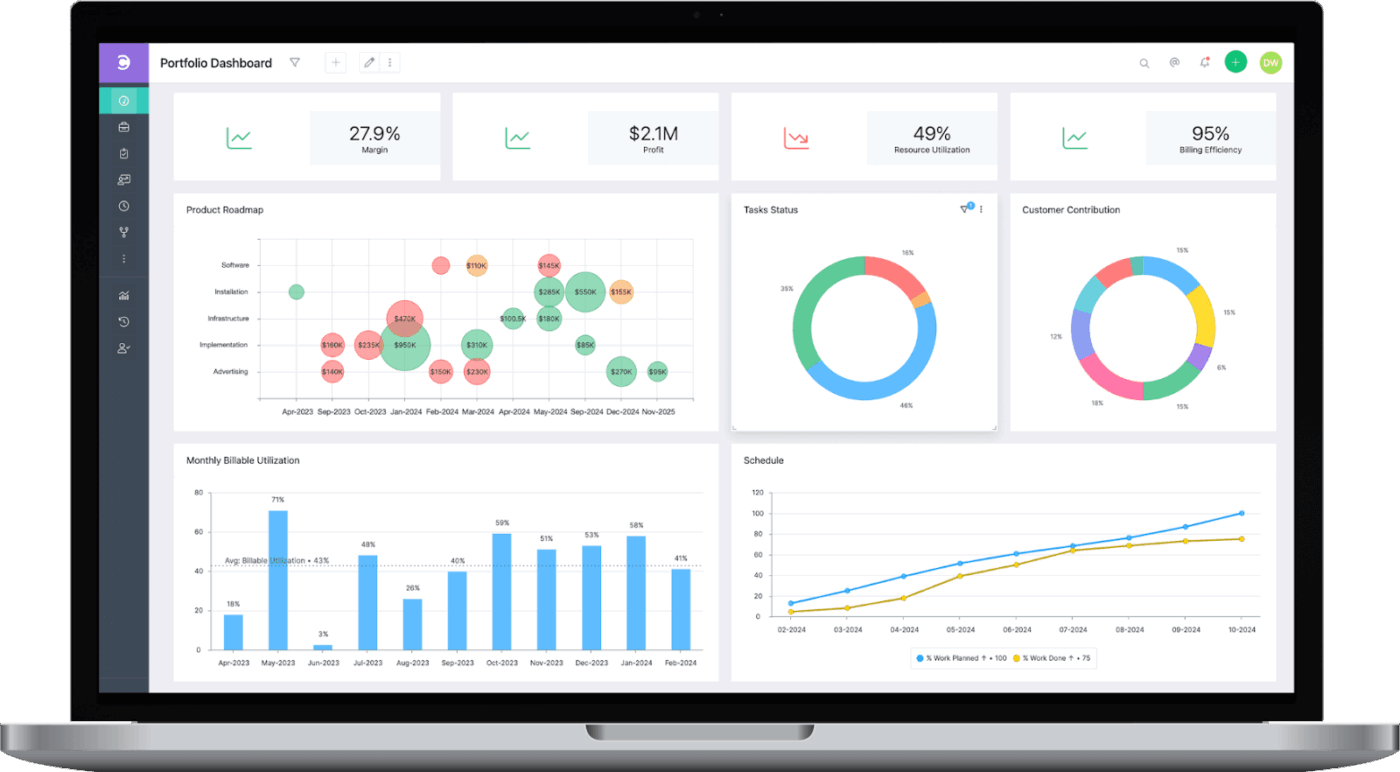
ClickUp is the everything app for work, built to handle everything from daily to-dos and big-picture planning to project reporting. With customizable dashboards, AI-powered summaries, workload charts, and goal tracking, you will always stay on top of your projects.
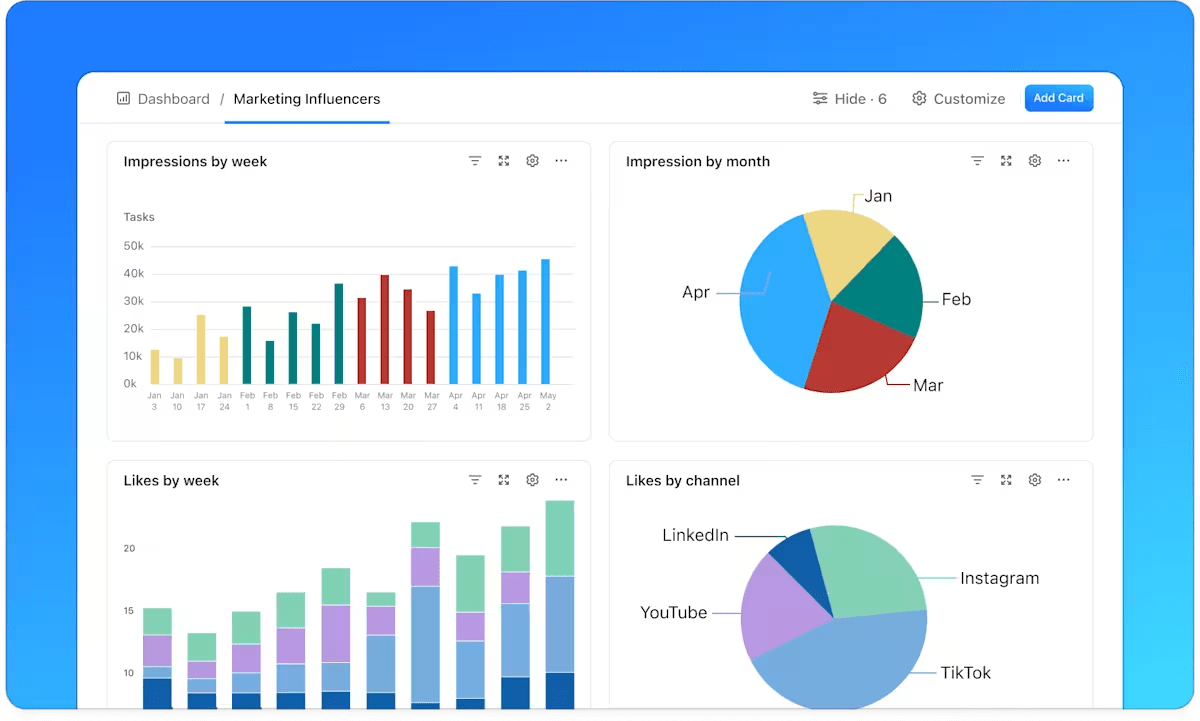
ClickUp Dashboards give you project insights in real-time from multiple angles.
For example, say you’re managing a marketing campaign. With ClickUp Dashboards, you can set up widgets to display tasks by status, track time spent on each activity, and monitor your team’s workload.
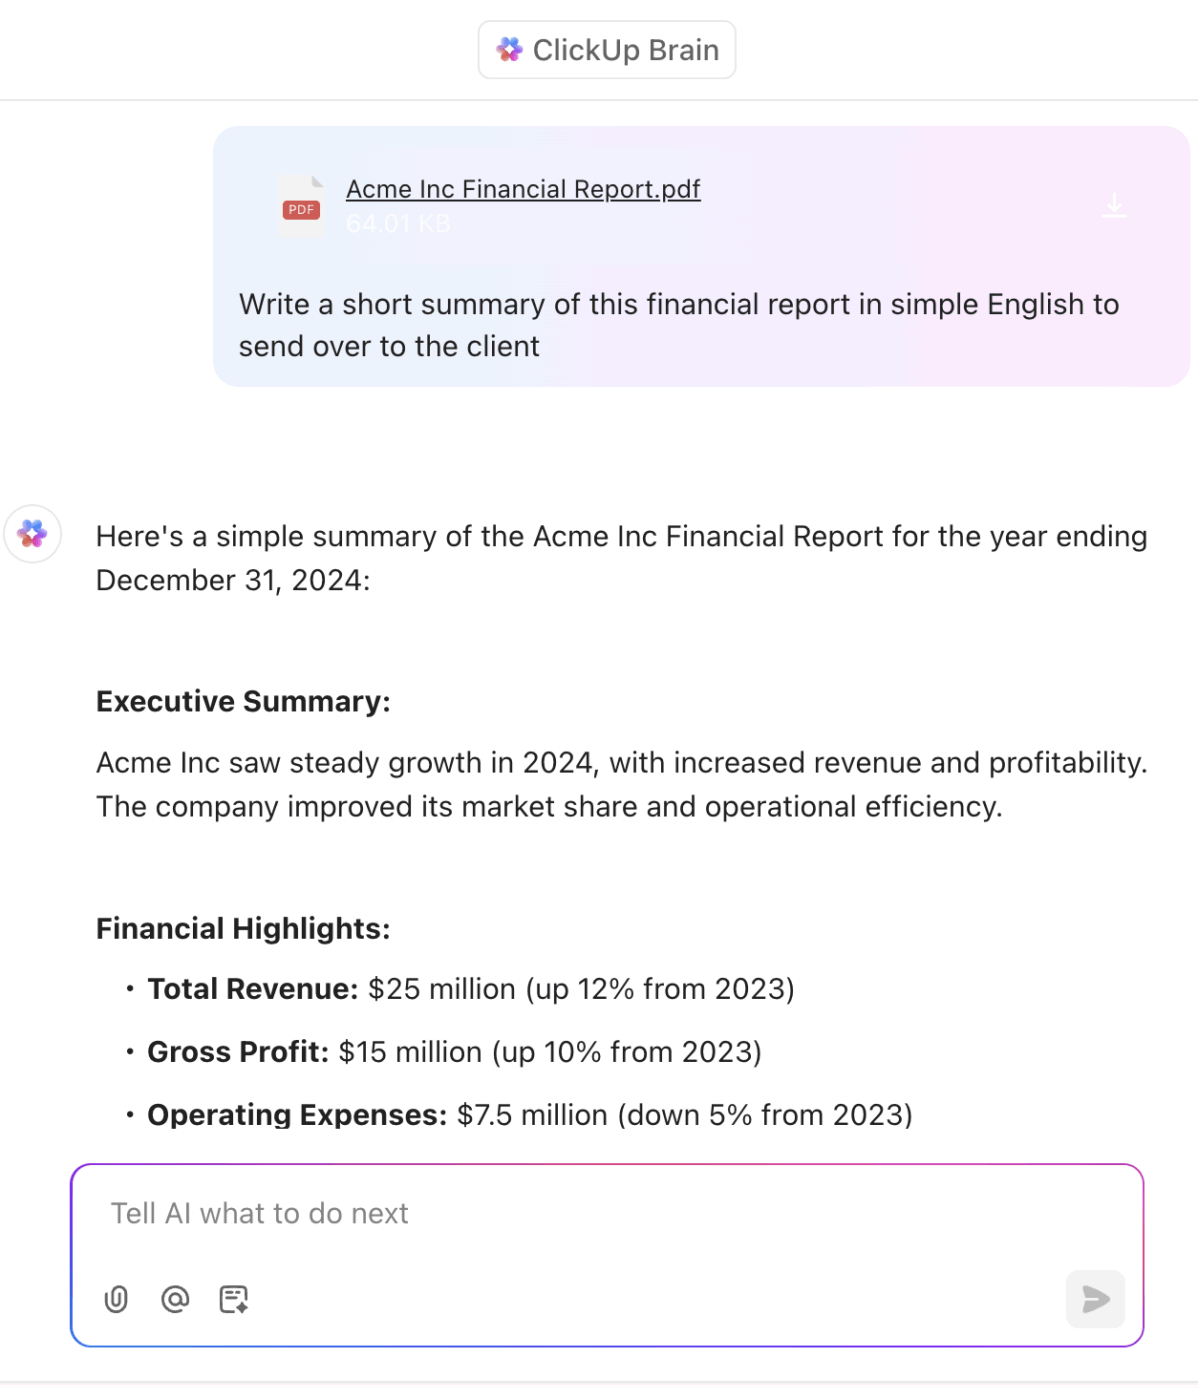
Then you have ClickUp Brain, the integrated AI assistant that can generate project summaries, team performance insights, and more in just a few seconds. It collects relevant data from your Workspace and connected apps and turns it into comprehensive status reports.
For example, after completing a project sprint, you can ask ClickUp Brain to “Summarize the sprint’s progress and outcomes.” It’ll generate a concise report covering achievements, blockers, next steps, and task completion details—specifically, who did what and when.
While ClickUp Brain simplifies the creation of reports and summaries, ClickUp Goals helps you stay laser-focused on your key project objectives.
Whether you’re working with team OKRs, sprint targets, or weekly KPIs, ClickUp Goals makes it easy to track progress and keep everyone aligned.
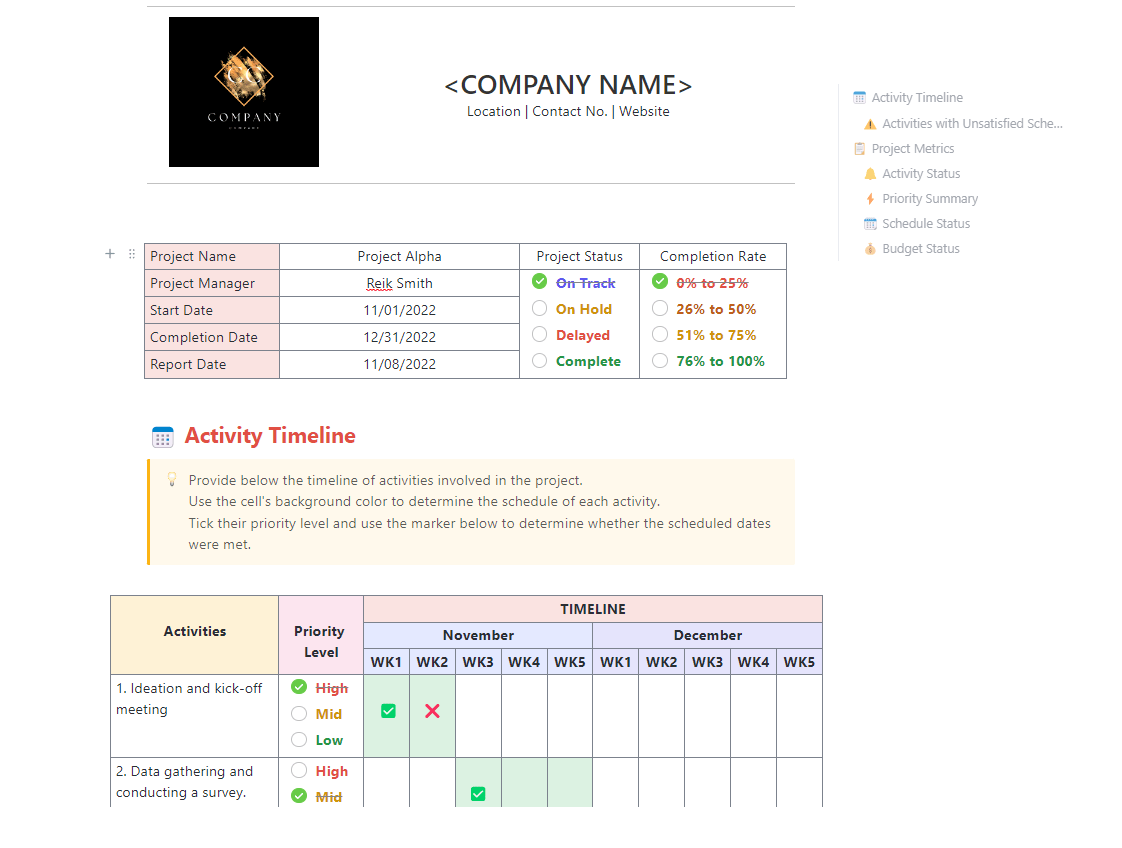
Not sure where to start? Grab one of ClickUp’s free project reporting templates to hit the ground running.
For example, the ClickUp Project Report Template will help you track project progress, expenses, and outstanding action items. You can visualize project status against timelines, set priority levels, and track completion rate in one place.
A G2 reviewer says:
What’s most useful is how flexible ClickUp is. It adapts to different ways of working, whether it’s simple to-do lists or more complex project management. That flexibility means it fits around how I work, rather than forcing me to change my workflow.
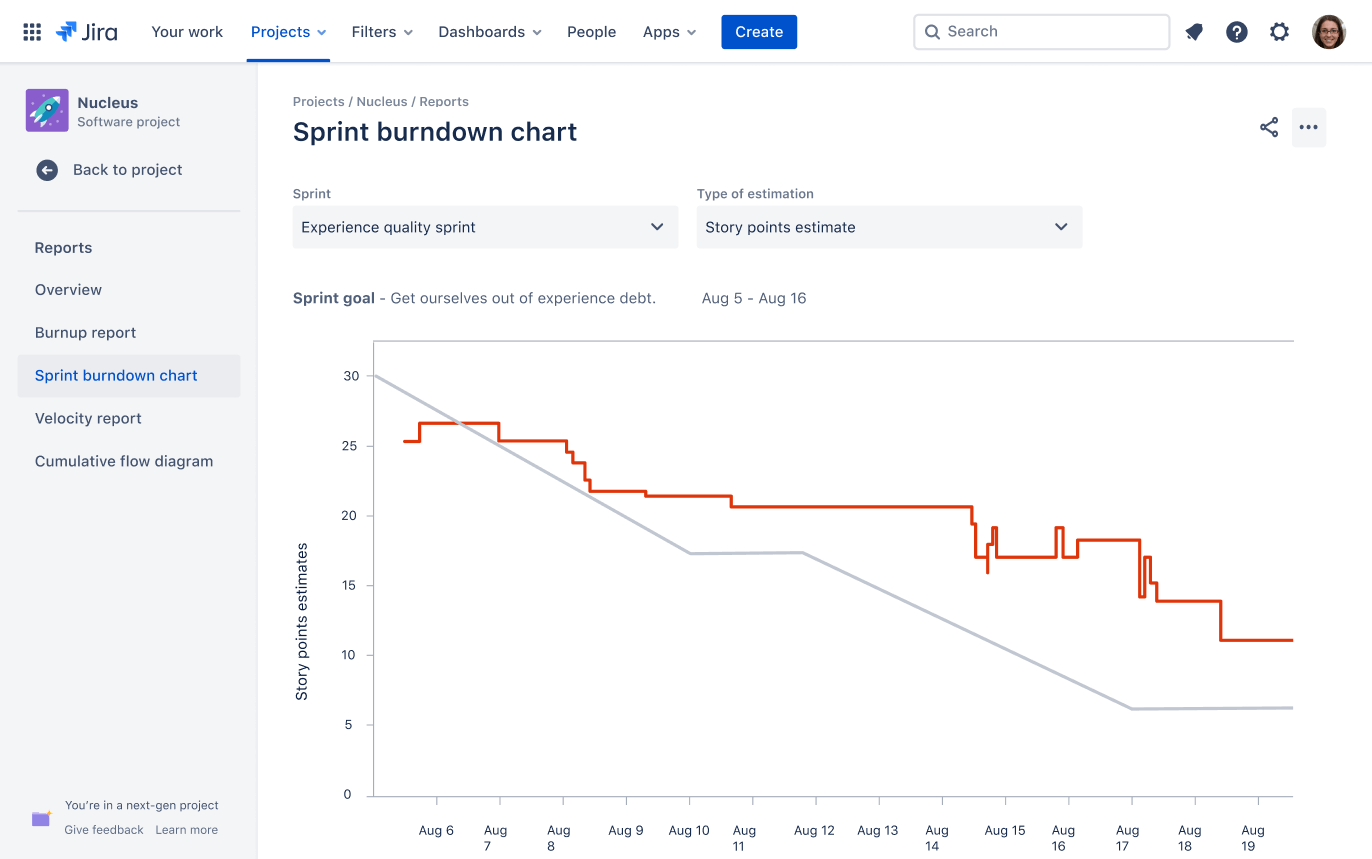
Poor requirements management is a common reason projects fail to meet their objectives. Jira helps IT leaders and development teams address this by offering clear visibility into tasks, timelines, and project requirements.
Teams can monitor sprint progress, identify and resolve blockers, and generate reports that show what’s on track and what needs attention.
Automation features also reduce the need for manual updates, allowing teams to focus more on execution and less on reporting.
A G2 review says:
What I like most is how customizable and structured Jira is for managing projects and tickets. It supports detailed task tracking, allows us to create custom workflows, and gives visibility into progress with Kanban or Scrum boards.
📖 Also Read: Best Jira Alternatives & Competitors for Agile Teams
🧠 Fun Fact: The term ‘Milestone’ comes from the milestones used by the ancient Romans along their roads.
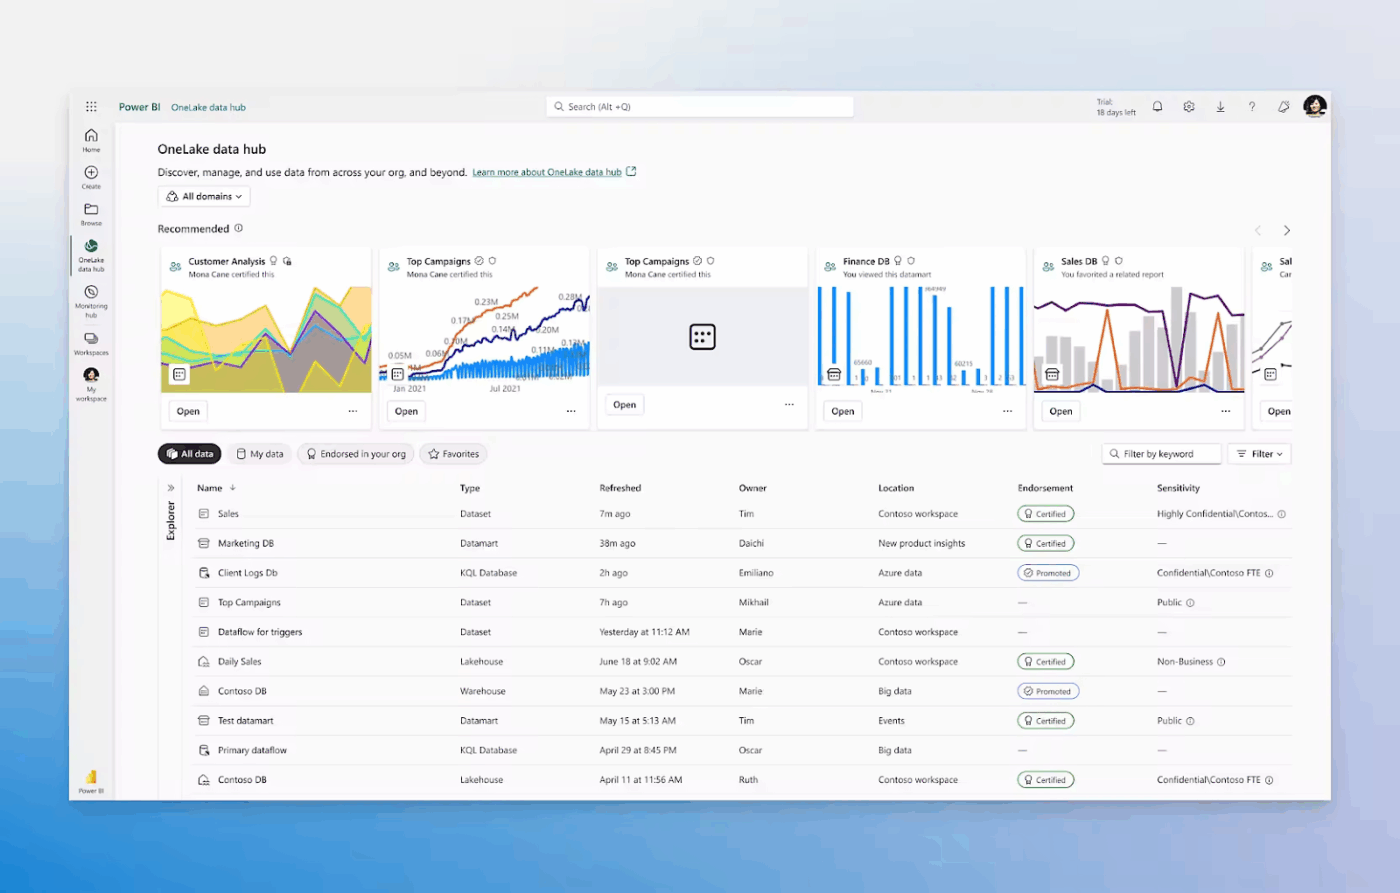
Power BI is a business intelligence software built to handle complex project management. It integrates with hundreds of data sources to get you the most up-to-date insights.
The AI-driven analytics lets you spot trends and anomalies automatically with rich data visualizations. You can keep projects on track from anywhere with mobile access and automated report updates.
It also lets you sync with Microsoft tools like Excel, Teams, and Azure to create a centralized project management ecosystem.
A G2 review says:
It’s super easy to use. The program has a lot of implementation where I can see how I am trending, active student, what items are missing and just help you to stay on top of your work.
📖 Also Read: Best Goal Tracking Apps (Free & Paid)
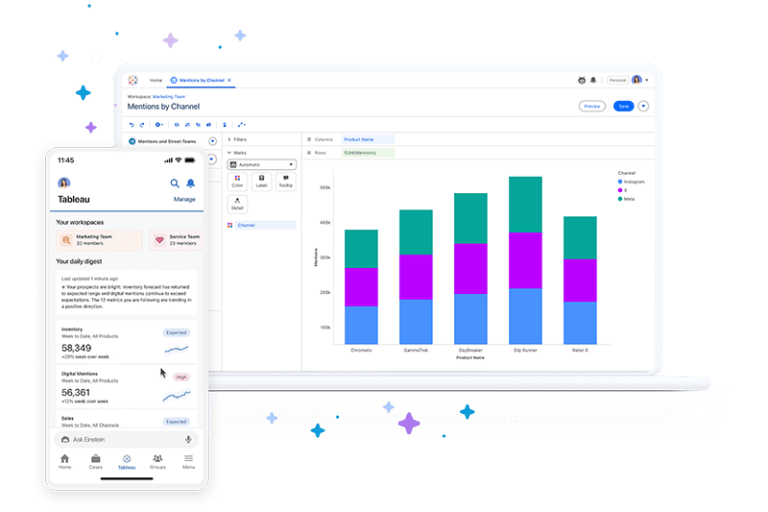
Tableau is designed to help teams track their projects, predict strategy gaps, and identify bottlenecks to keep tasks moving forward. Its intuitive drag-and-drop interface makes complex data easy to visualize, while real-time updates ensure everyone stays aligned with the latest insights.
You can visualize key project management metrics, such as timelines, budgets, and resource allocation, and access dashboards on mobile to monitor tasks and data from anywhere.
A Capterra reviewer says:
I’ve used Tableau for creating dashboards tailored to the unique needs of different teams within the company. Most data sources used by Tableau were SQL Server databases, local Excel files, and Box files. What people used to create locally, in some very elaborated Excel files, was transferred in Tableau, shaped into interactive dashboards showing the important KPIs, visualizations on trends, etc. This way, the same dashboard could be shared to more people, so that each can explore data as per provided filters.
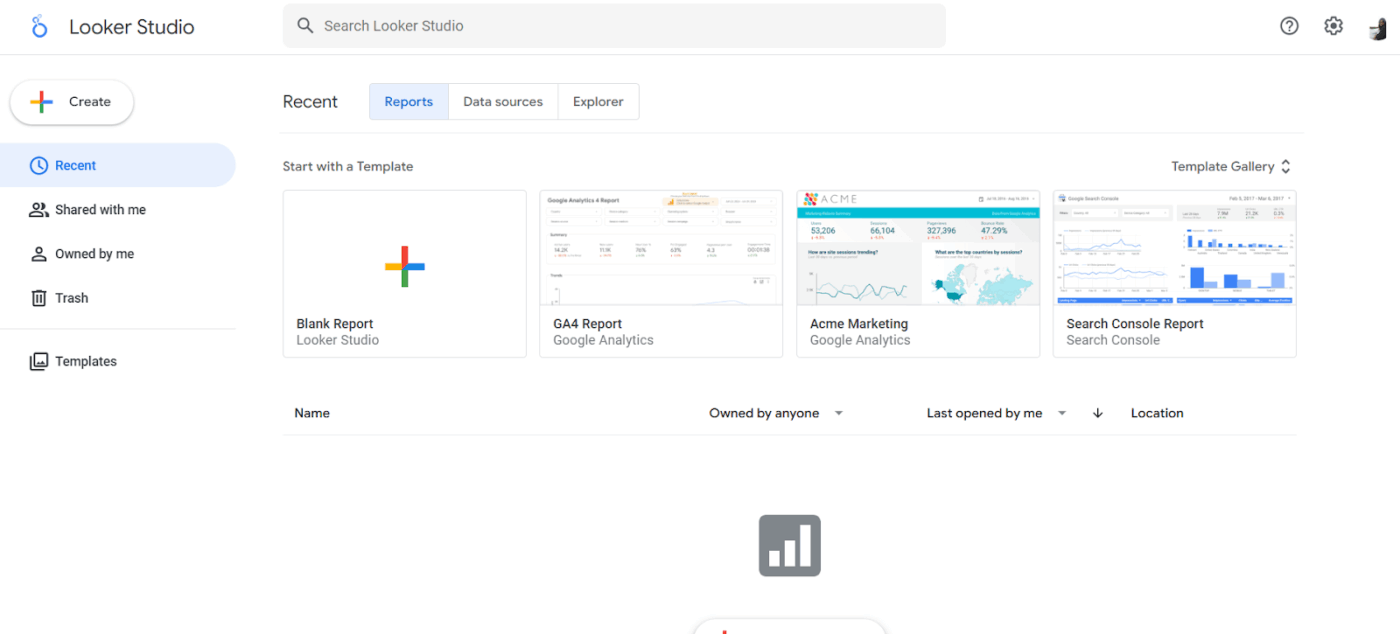
Looker Studio, formerly Google Data Studio——helps teams track, analyze, and present project data through interactive dashboards.
With its user-friendly drag-and-drop interface and seamless integrations with Google tools like Google Analytics, BigQuery, and Sheets, it turns raw data into clear, actionable insights—no technical expertise needed.
A G2 review said:
It’s pretty easy to use and set up, I would say it is an ideal solution for small and mid-size businesses as it is easy to adapt and change to a business’ growing needs.
📮 ClickUp Insight: Knowledge workers send an average of 25 messages daily, searching for information and context. This indicates a fair amount of time wasted scrolling, searching, and deciphering fragmented conversations across emails and chats.
😱 If only you had a smart platform that connects tasks, projects, chat, and emails (plus AI!) in one place. But you do:
Keeping projects on track is challenging—especially when communication is fragmented and priorities shift.
Wrike combines project management with detailed reporting to give teams clear visibility, even in complex workflows. Its customizable dashboards, workflow automation, and real-time collaboration tools help streamline daily operations.
Teams can assign ownership, monitor progress, and reduce manual updates. With support for over 400 integrations and flexible reporting options, Wrike adapts to various team structures and scales with evolving project demands.
A G2 review says:
I really like how Wrike helps our team stay aligned across multiple projects and deadlines. The customizable dashboards and task views make it easy to see who’s working on what, and the built-in collaboration tools (like comments and file sharing) reduce the need for endless email threads. It’s also super helpful that we can track time and set up workflows that match how our team actually works – less jumping between tools, more getting things done.
📖 Also Read: We Tested the Best Wrike Alternatives & Competitors
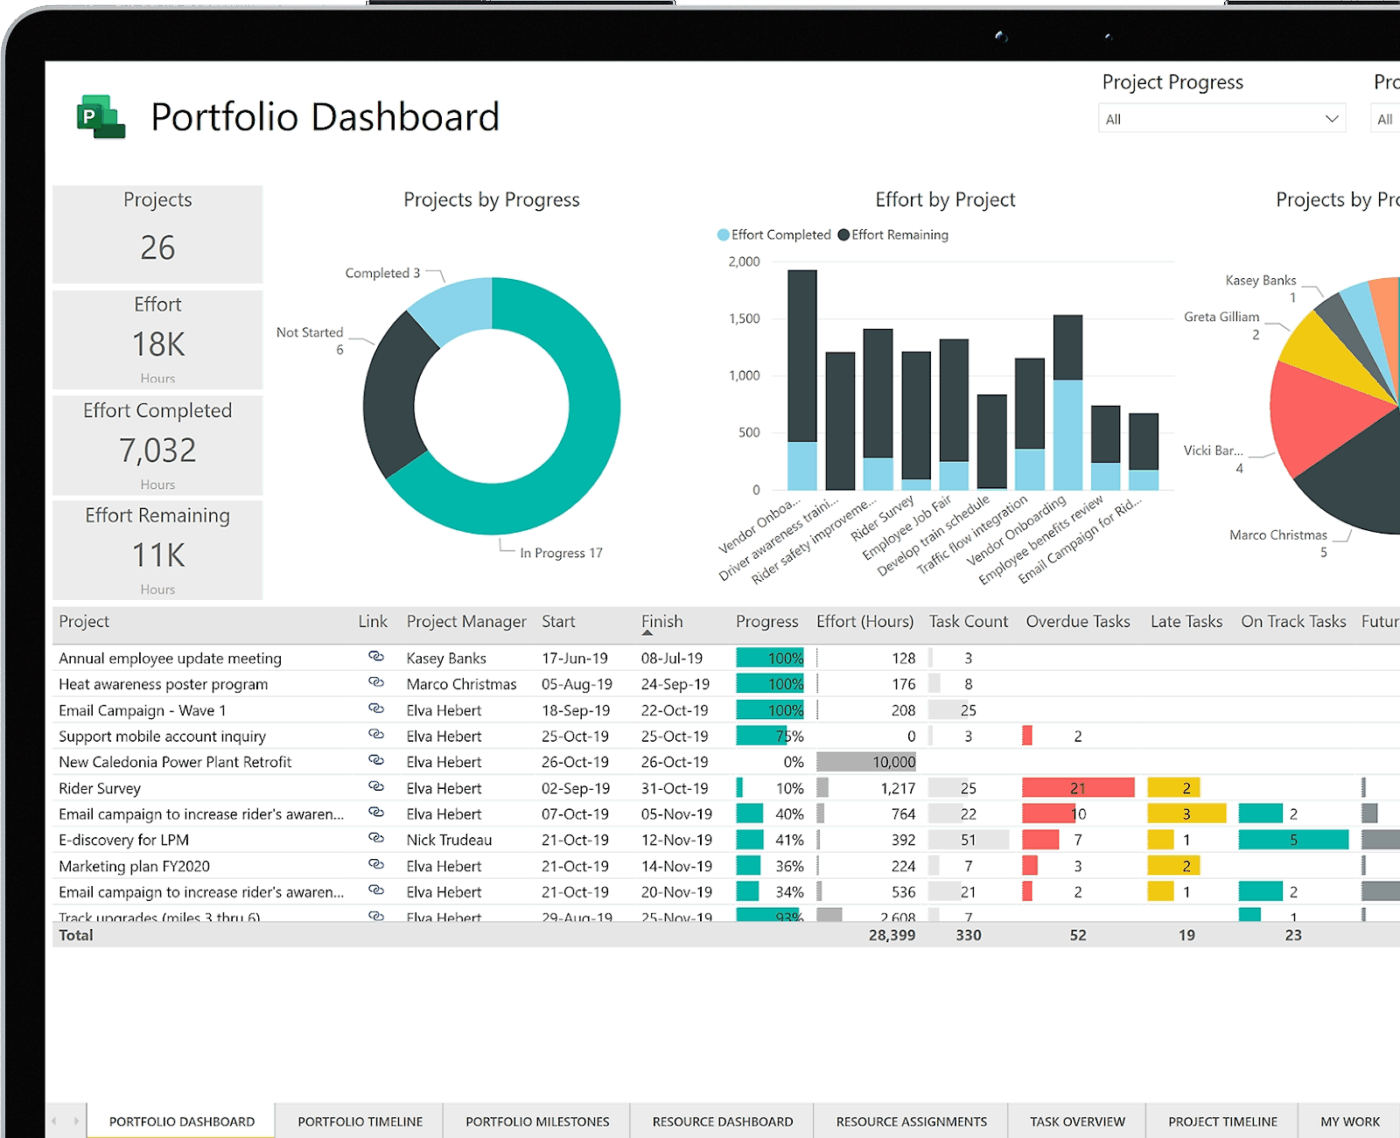
Large organizations manage dozens of overlapping initiatives, making visibility and control difficult. Microsoft Project addresses this with portfolio management tools that help you plan, prioritize, and track multiple projects in one place.
Its native integration with Microsoft 365 supports real-time collaboration, while built-in project reporting tools with data visualization give decision-makers a clear view of progress.
From IT upgrades to product launches, teams can monitor project timelines, resources, and deliverables across the board.
A Capterra reviewer says:
Microsoft Project is an excellent project management software that can be used to create visual representations of project timelines quickly. The software is thorough and plays well with the other Microsoft products that I regularly use in my career.
📖 Also Read: Best Microsoft Project Alternatives (Free & Paid)
Over half of businesses now use AI in at least one area of operations. If your team is among them, Celoxis brings AI into project reporting with practical features. Its forecasting tools help identify potential risks and resource constraints early, supporting better planning and decision-making.
Automated project report generation provides timely updates without manual input, while its data visualization tools make complex metrics easier to interpret and share with stakeholders.
A Capterra reviewer writes:
Wonderful software for creating big impact in terms of productivity and task management in a big team as well as small. It has been cut to cut very efficient for us and helps us present correct data reporting and scheduling as well.
🧠 Fun Fact: The construction of the Cologne Cathedral in Germany is the longest project ever recorded and lasted over 1,000 years!
Burnout often stems from unclear priorities and uneven workloads—issues that surface too late without proper visibility.
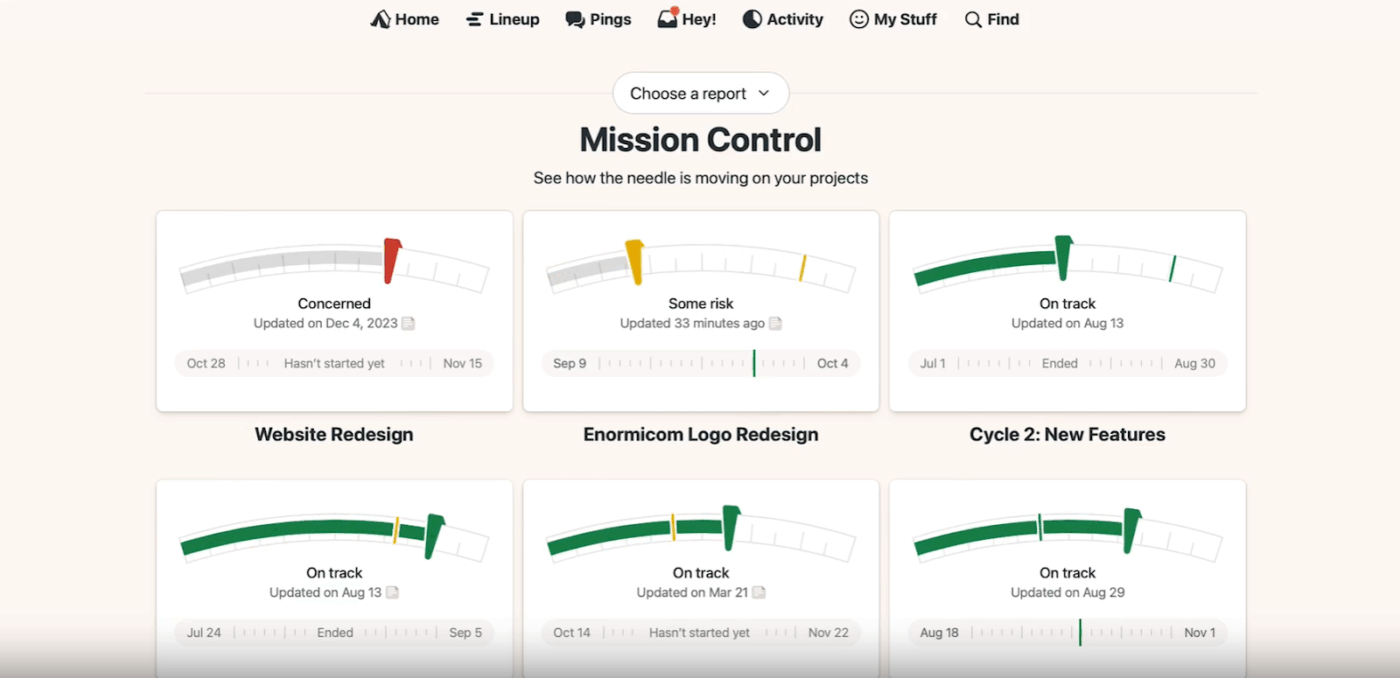
Basecamp helps by combining real-time reporting with project management, giving you a clear picture of what’s on everyone’s plate.
It offers tools to track progress, monitor workload, and prevent your team from reaching a breaking point.
A G2 review says:
Basecamp does a great job making it easy for others to complete tasks and network. It significantly cuts down on meeting time and creates transparancy where silo’s often exist in a manufacturing and production environment. Implementation is simple and straight forward. Customer support has always been great. We use the software on a daily basis for items that would normally have been done with pen and paper.
📖 Also Read: Top Basecamp Alternatives
If you don’t need complex, enterprise-level tools, Trello provides a simpler option better suited for small teams and straightforward projects.
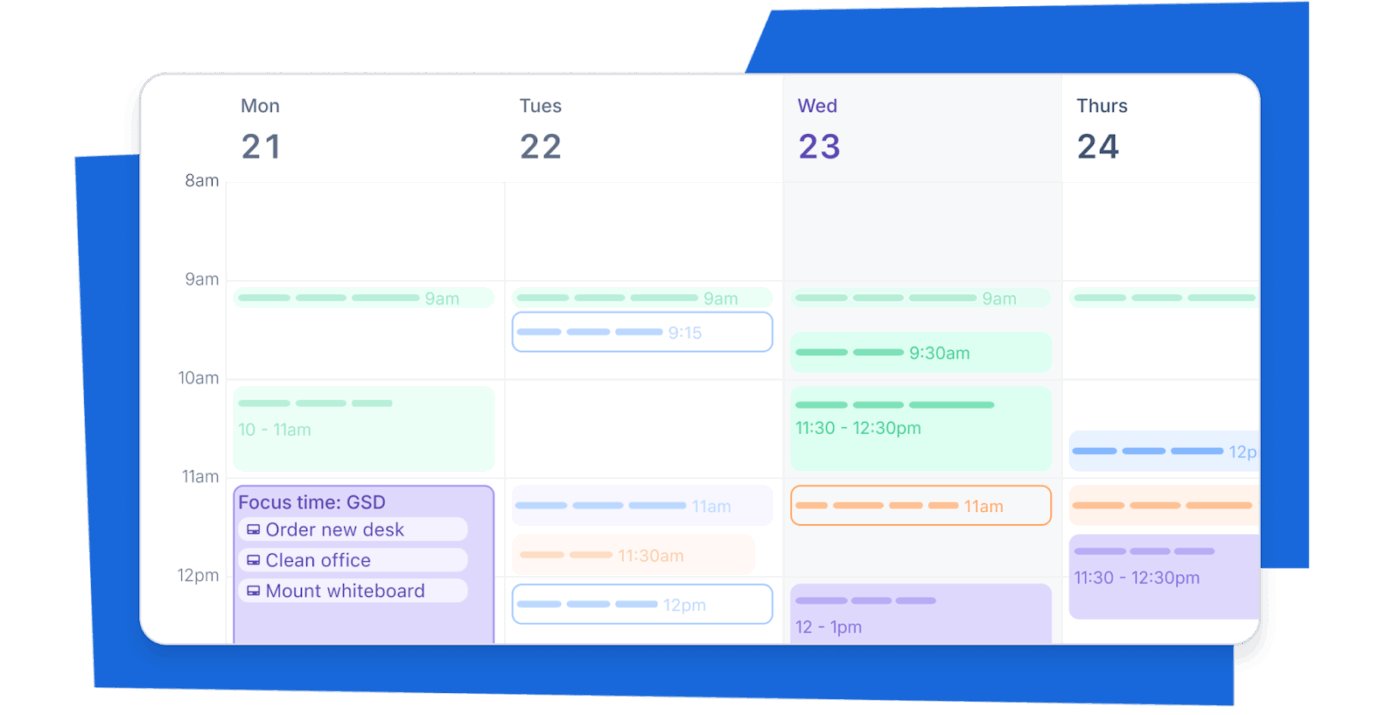
This free project management software uses customizable Kanban boards and real-time updates to help teams stay organized and track tasks with ease. It also integrates with Slack, allowing you to view and share project status directly within your team’s workspace.
A Capterra reviewer says:
I use Trello to organize myself, alone or in a team, to control deadlines when necessary and to monitor daily, weekly, fortnightly and monthly activities. The tool is easy to use and I feel comfortable recommending it to anyone interested in optimization.
📖 Also Read: Best Trello Alternatives and Competitors
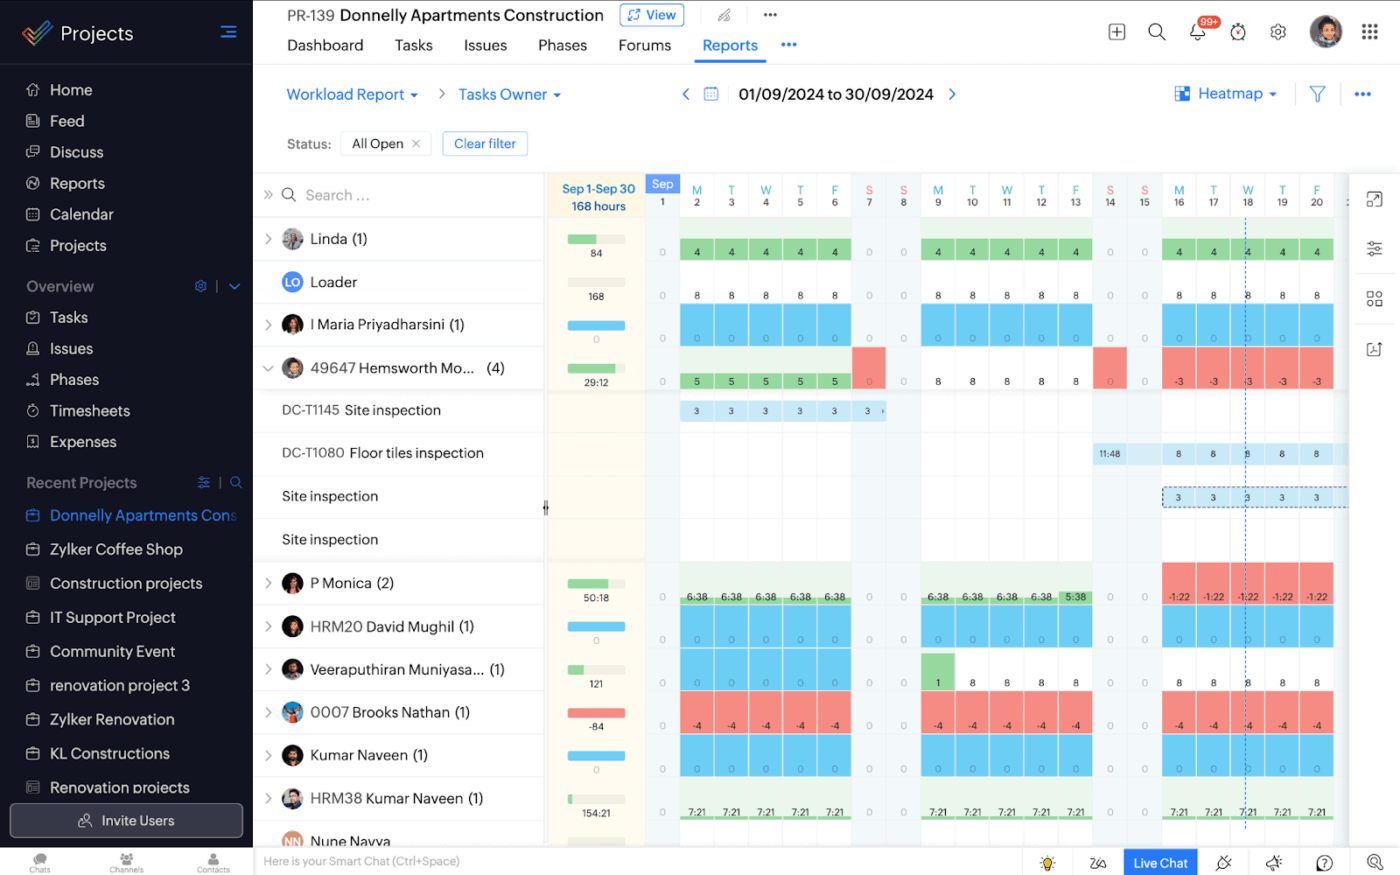
With built-in issue tracking, Zoho Projects stands out by identifying and resolving common project pain points, such as delayed bug fixes, unclear task ownership, and a lack of visibility. This helps teams stay on top of problems before they become blockers.
Additionally, you gain access to Gantt charts, advanced time tracking, and customizable dashboards, providing you with complete control over your project lifecycle.
By integrating with Zoho Analytics, you can also access over 50 additional charts and reports that can be shared and exported.
A G2 review said:
It is the best platform for people with varying needs in their projects that want to tie in with a crm for a low, affordable price, and has been a deciding factor in looking into Zoho further vs other crm products on the mark
💡 Pro Tip: Set up conditional formatting to flag tasks delayed beyond a set threshold or resources overused past 80%. This creates a live visual cue for hidden risks—so you catch issues early, not just when they blow up.
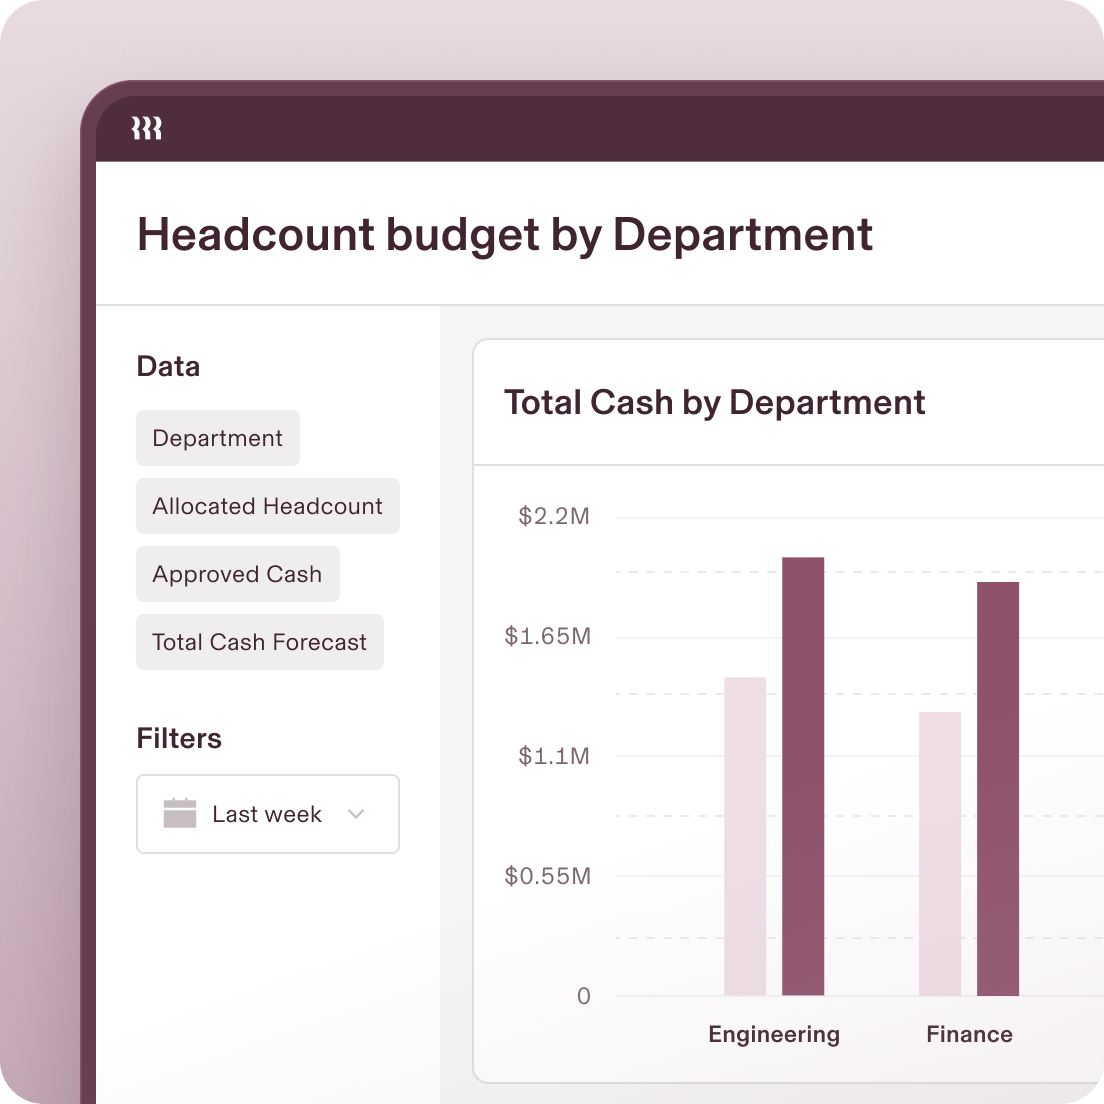
Teams looking for software to generate project progress reports and manage team capacity might want to consider Rippling Analytics.
If you’re struggling to get a clear view of your team’s capacity, this project reporting tool tracks workforce expenses, monitors bandwidth, and helps plan headcount for upcoming projects.
It also functions as OKR software, enabling teams to set goals, track productivity, and forecast resource needs with real-time dashboards and reports.
With role-based permissions and flexible access to reports, you never have to worry about information security.
A G2 reviewer writes:
The biggest benefit is the time saving and increased efficiency. With automated tax filings, onboarding workflows, and compliance tracking, I can focus more on my work rather than administrative tasks. Plus, the reporting and analytics tools provide valuable insights that help my company make better strategic decisions financially.
Forecast streamlines project tracking for beginners and experts with thoughtful resource planning, AI-driven forecasting, and real-time collaboration.
You can use it to manage budgets, track time, allocate resources dynamically, and generate insightful reports that keep stakeholders informed at every step. Set project milestones, track them on Gantt charts, sequence tasks efficiently, and even identify your best revenue-driving channels.
A G2 review said:
I love how forecast combines useability with data analysis. it provide a quick and easy route to find work and log time for anyone using the system but gathers a range of useful data metrics that can be manipulated to give powerful BI insights
Teams shouldn’t have to lose time manually tracking project KPIs—that time is better spent on actual work. For teams that need a reporting tool built around visual workflows, TeamGantt offers a practical solution.
Features like task dependencies, collaborative comments, file sharing, and time tracking support both creative initiatives and project logistics. Its clean, intuitive interface also makes it a good fit for visual thinkers who prefer clarity over clutter.
RACI role assignment to tasks enables transparency, while always-updated milestones and dependencies keep stakeholders aligned.
A G2 review says:
The speed with which I can organize tasks, set priorities and modify deadlines is a before and after when it comes to planning activities that are understandable by the whole team; I’d also like to point out that in the visual schedules allows us to immediately identify tasks by category, status or urgency and thus improve their follow–up.
📖 Also Read: Best TeamGantt Alternatives and Competitors
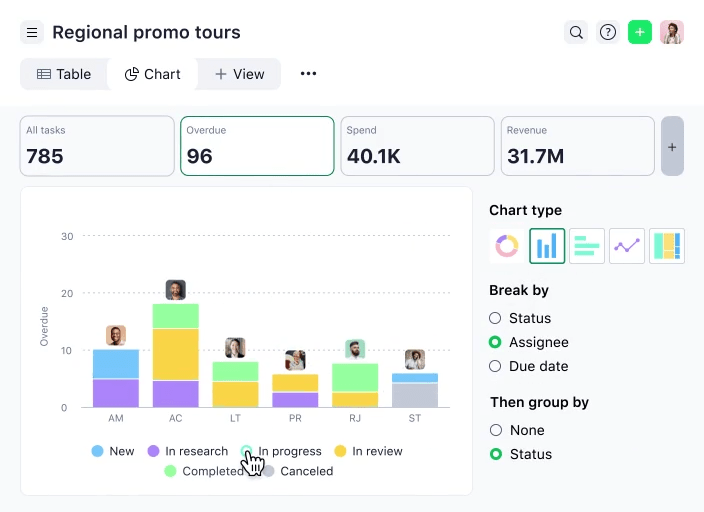
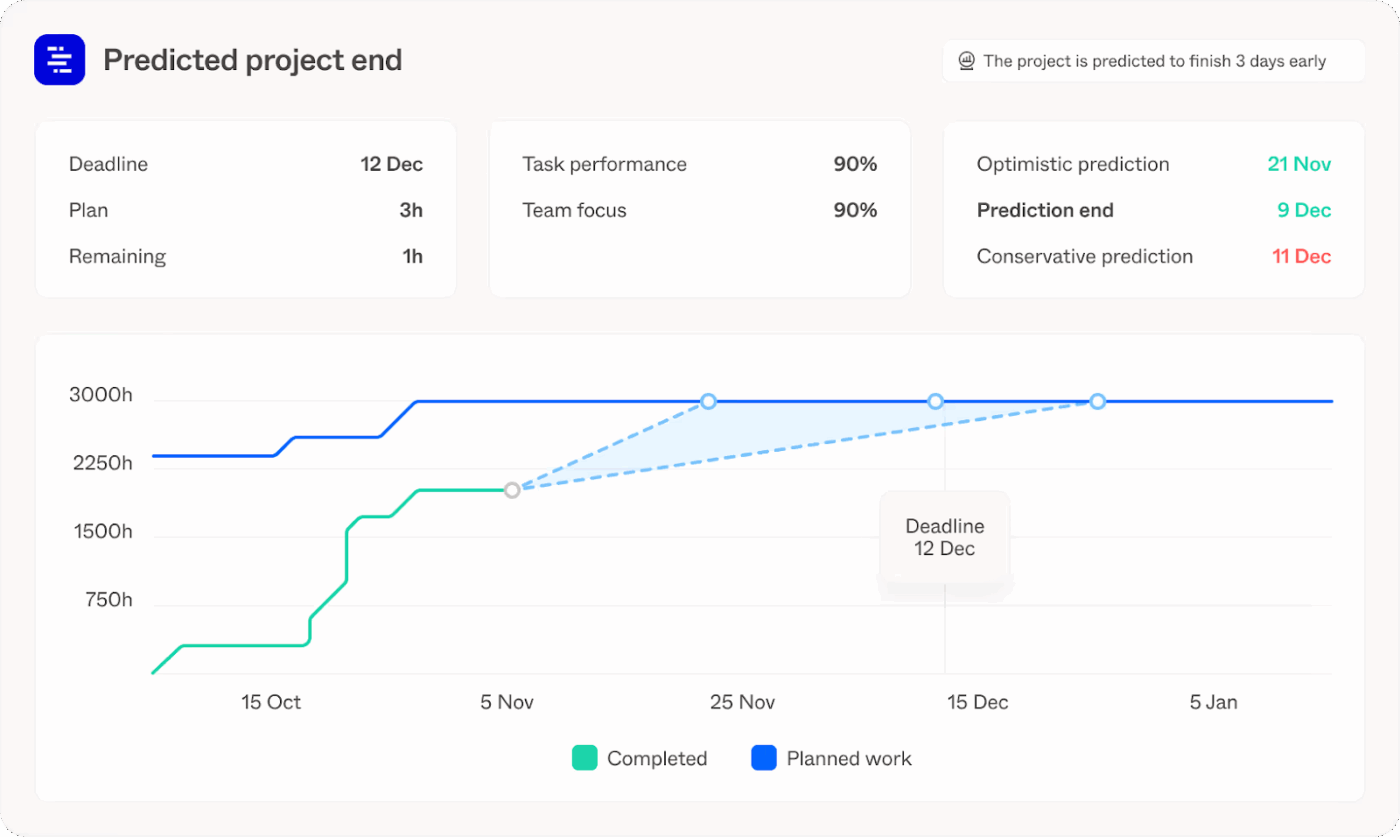
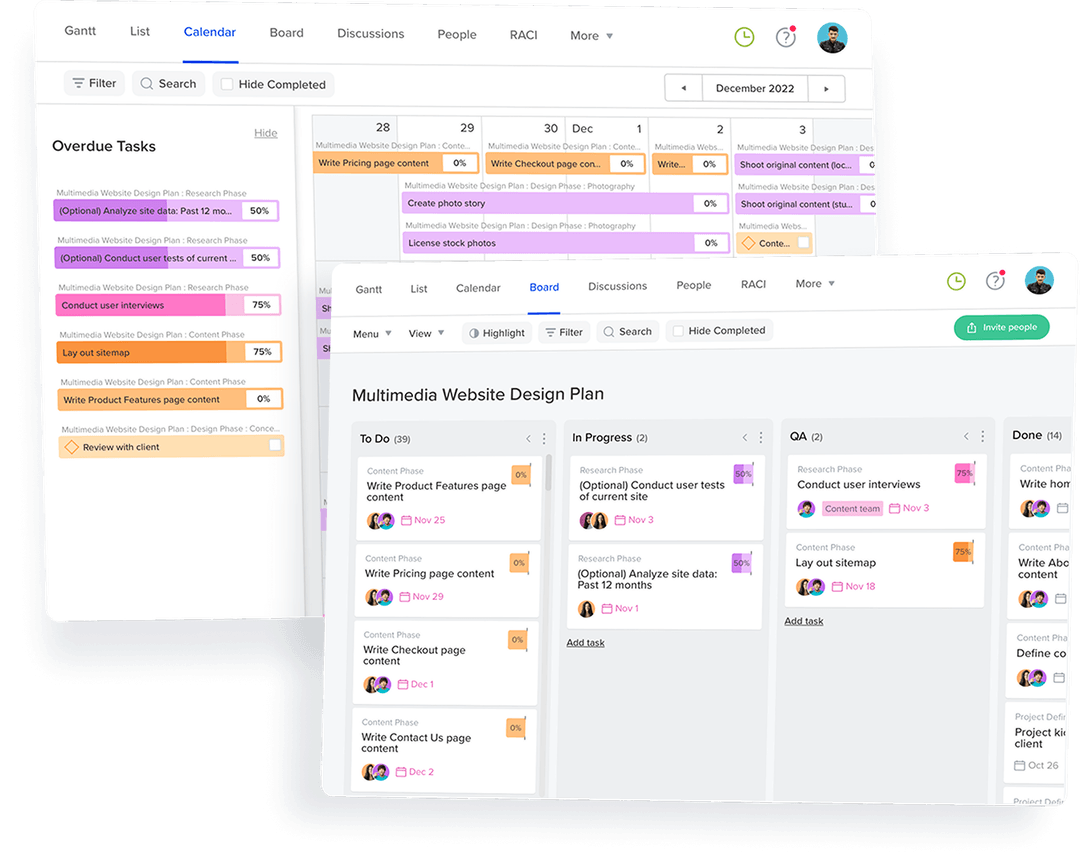
Asana is a task management tool that seamlessly connects project updates to real-time project data. It’s highly customizable and easy to use, yet it incorporates all essential project reporting features. You can spot blockers, visualize team workload, estimate project budgets, and track project timelines in one place.
Asana also offers portfolio management, allowing you to set business goals and display real-time KPIs to keep your team on track.
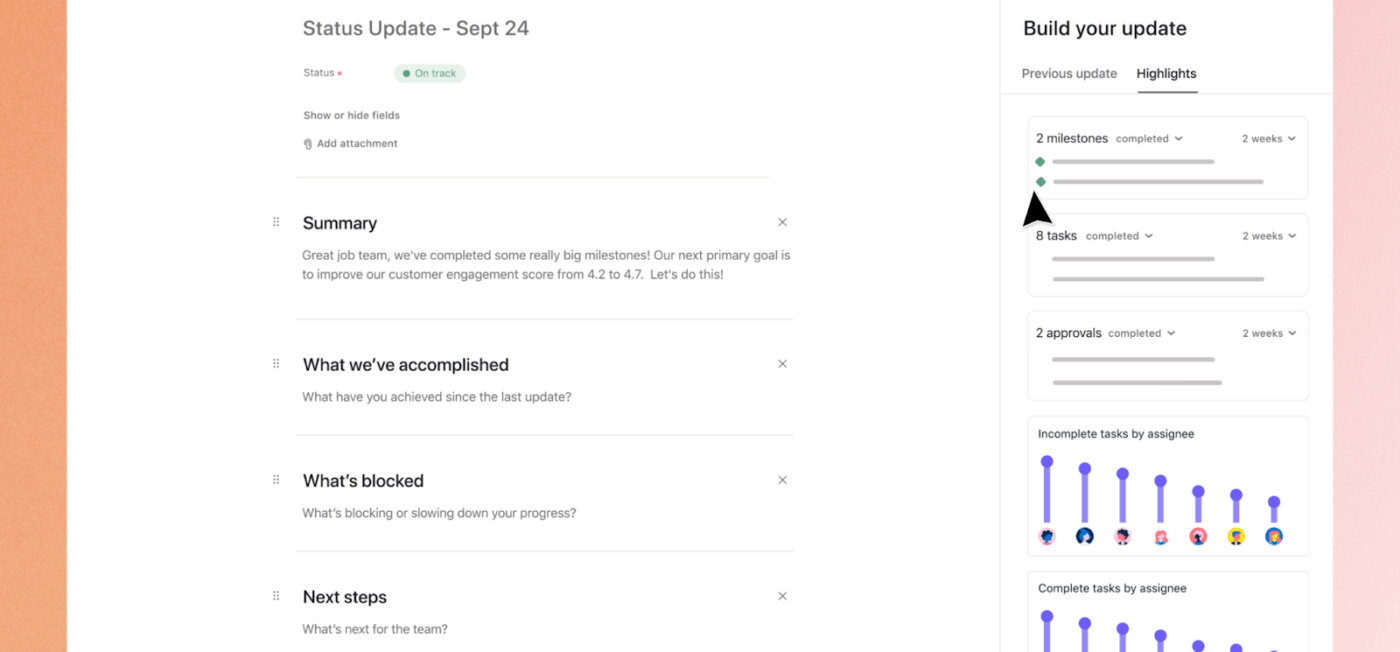
You can also use Asana AI to automate workflows, generate project summaries, and create status reports.
A G2 review said:
Asana is very versatile! We love that we are able to use the project settings to create real time settings that multiple people can track and work in at the same time. We also love that we are able to use Asana as an overall task tracker for individuals and groups, as well as having the ability to track employee performance.
Here’s a quick checklist of capabilities to look for when choosing a reporting tool in project management:
Here are some project reporting best practices for project managers:
👀 Did You Know? The lack of access to necessary information negatively impacts the morale of 88% of employees.
While all the project management reporting software tools we listed offer impressive project tracking features, each comes with its limitations. Some offer advanced progress updates but lack automation. Others provide solid reporting but have a steep learning curve. A few provide real-time data but overlook customization options.
If you want a project reporting tool that combines speed, simplicity, and accuracy in project reporting, choose ClickUp. It gives you automated updates, customizable dashboards, and real-time insights, all in one place.
Build detailed reports, track goals, visualize workflows with ClickUp Brain, and monitor time spent on tasks. Moreover, the built-in collaboration features make working with distributed teams and completing your projects on time even easier.
Sign up for ClickUp today and take control of your project reporting!

© 2026 ClickUp

There’s an easier way. Try a free AI Agent in ClickUp that actually does the work for you—set up in minutes, save hours every week.