


Still downloading templates?
There’s an easier way. Try a free AI Agent in ClickUp that actually does the work for you—set up in minutes, save hours every week.
Sorry, there were no results found for “”
Sorry, there were no results found for “”
Sorry, there were no results found for “”
Imagine you’re compiling a detailed project report and need to organize your data clearly in Google Sheets. A few years ago, setting up a functional table might have been a chore, but since May 2024, Google has introduced simpler methods to create tables within Google Sheets.
This update has made it easy to transform raw data into structured, understandable formats. It helps users experience streamlined data management, enhanced readability, and improved collaboration features.
In this blog, we’ll outline the steps of how to make a table in Google Sheets to help you tidy up your data.
Creating a table in Google Sheets for your project management needs is straightforward.
Using a few Google Sheets hacks, you can speed up table creation and enhance data organization without needing advanced skills.
Let’s break down how you can create a table in Google Sheets in just a few steps:

To begin, open the Google Sheets website. You can create a new blank spreadsheet or open an existing document to add a table.

To structure your table, type the categories you need as column headers in the first row of your spreadsheet. These headers serve as the foundation of your table, helping to categorize and define the type of data each column will hold.
Fill in the rows beneath each header row with the relevant data. Ensure your data aligns correctly under each header to maintain the table’s organization.
Enhance the visual appeal and utility of your table by formatting.


Explore Google Sheets add-ons for more functionality, as they provide additional features like advanced formatting and data integration.

Adding filters to your table allows you to manipulate and view specific subsets of your data:

For larger datasets, collapsing sections of your table can be useful:
Creating a searchable table significantly speeds up how you interact with your data:
💡 Pro Tip: If you’re working with multiple datasets, merge two Google Sheets to consolidate and manage your data more efficiently. This way, all your Google Sheets work is combined into one document.
While Google Sheets is a versatile tool for many spreadsheet tasks, it has limitations, especially when it comes to creating complex tables:
Given these limitations, you might want to explore other Google Sheets Alternatives for faster and more productive data management solutions.
Also Read: Create a Pivot Table in Google Sheets
ClickUp goes beyond simple task tracking by integrating advanced table creation capabilities, which are crucial for managing and visualizing project data efficiently. This includes using ClickUp’s Editable Spreadsheet Template, which streamlines data management across various functions.
This makes ClickUp an excellent alternative for those seeking a more dynamic and feature-rich environment compared to traditional spreadsheet tools.
It features advanced functions, such as AI features for Google Sheets, customizable dashboards, collaboration through documents and whiteboards, and detailed project tracking across various industries.
Users can manage tasks, set goals, track time, and use database templates for effective data and project management. Let’s look at some of its prominent features:
ClickUp offers flexibility with its 15+ views, each tailored to different work styles and requirements. These views enable teams to switch perspectives from detailed lists to broad overviews with just a few clicks. The views include List, Board, Calendar, Gantt, and more.
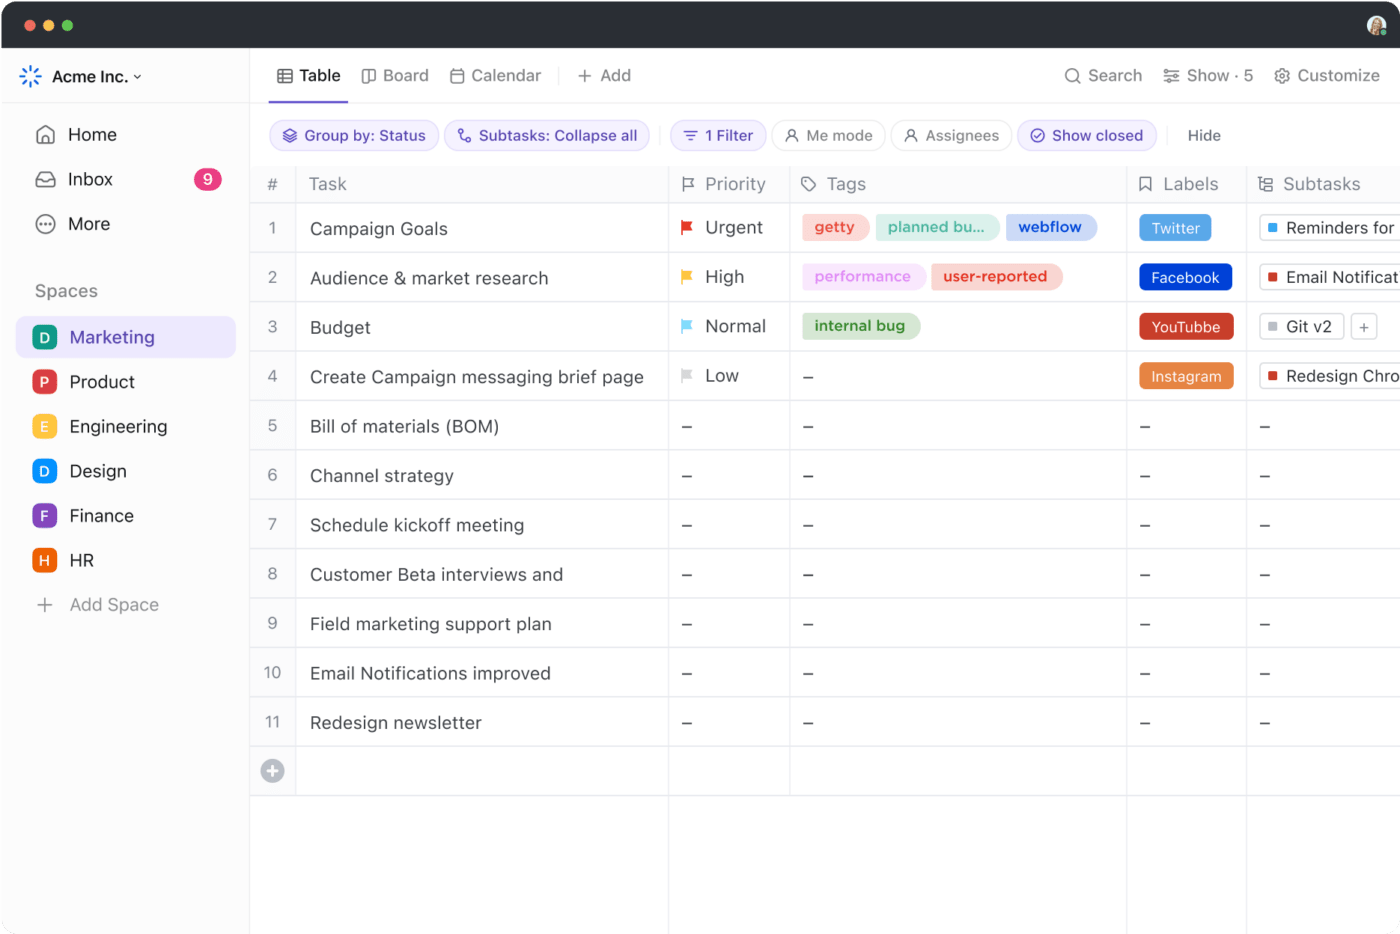
ClickUp Table View simplifies data management across various projects and workflows. It allows users to create and manage databases without any coding, offering a clear, grid-like structure that is easy to navigate and update.
This view supports various data types and custom fields, making it versatile for different business needs. With this feature:
The ClickUp Spreadsheet Template is designed to help you efficiently collect and manage crucial customer information. This feature-rich, fully customizable template offers a structured way to organize and track data, making it ideal for businesses focused on customer relationship management.
With its easy-to-use format, adapt the spreadsheet template to suit your needs, whether it’s tracking sales leads or maintaining detailed customer profiles. This template helps you:

In ClickUp’s List view, sorting tasks is a flexible and powerful tool for enhancing task visibility and prioritization. Sort tasks by various attributes such as start date, due date, priority, and more.
This feature is especially useful for managing deadlines and tracking important tasks. ClickUp also allows manual sorting within groups. You can:
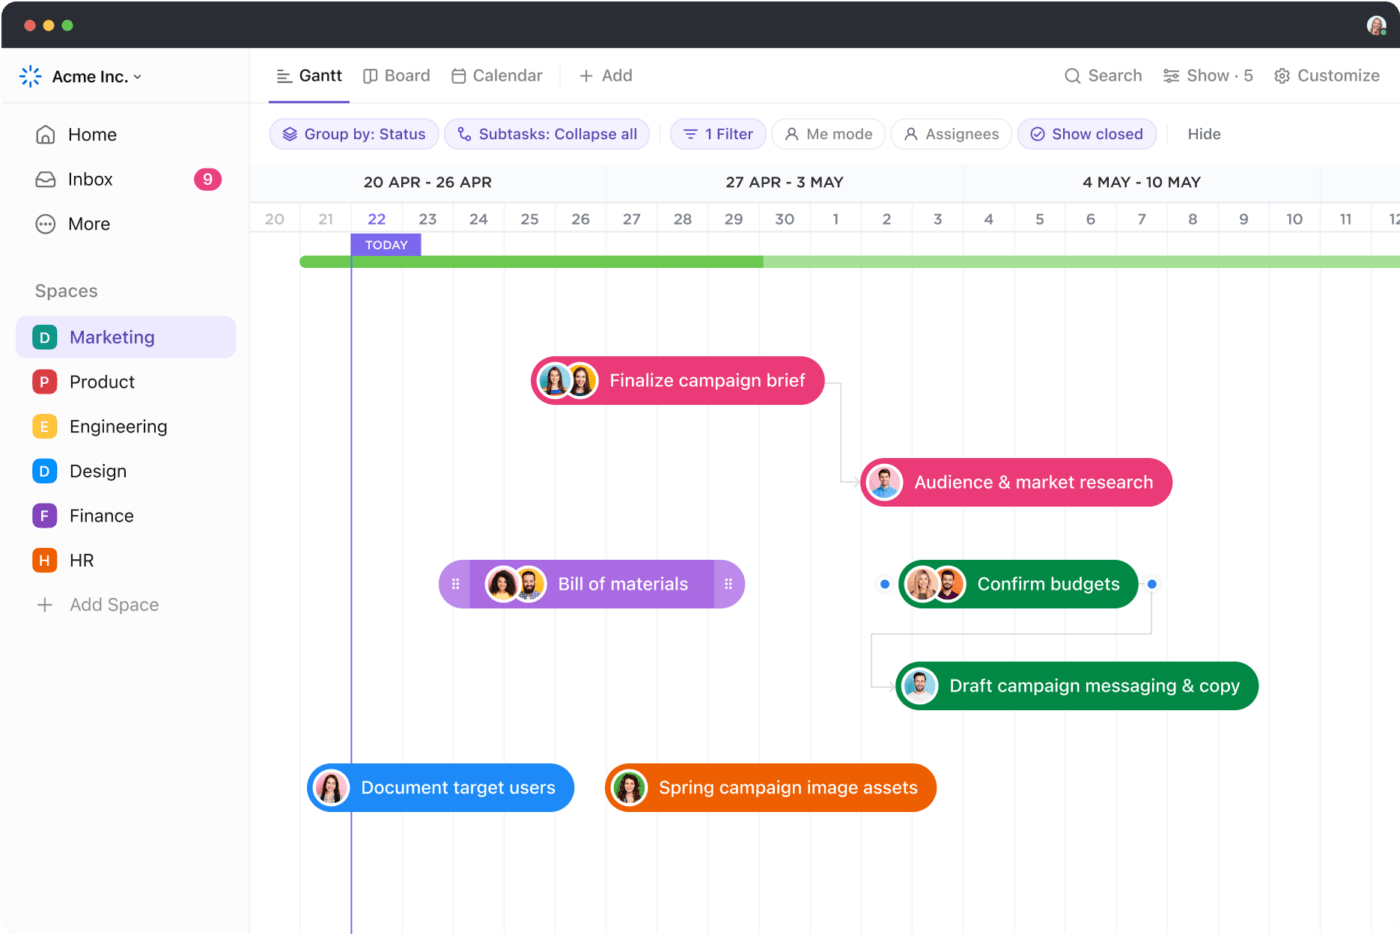
ClickUp’s Gantt Chart offers a visual timeline for project scheduling and progress tracking. It allows users to set dependencies between tasks, adjust schedules with drag-and-drop simplicity, and analyze critical paths to prioritize tasks effectively. This feature helps:
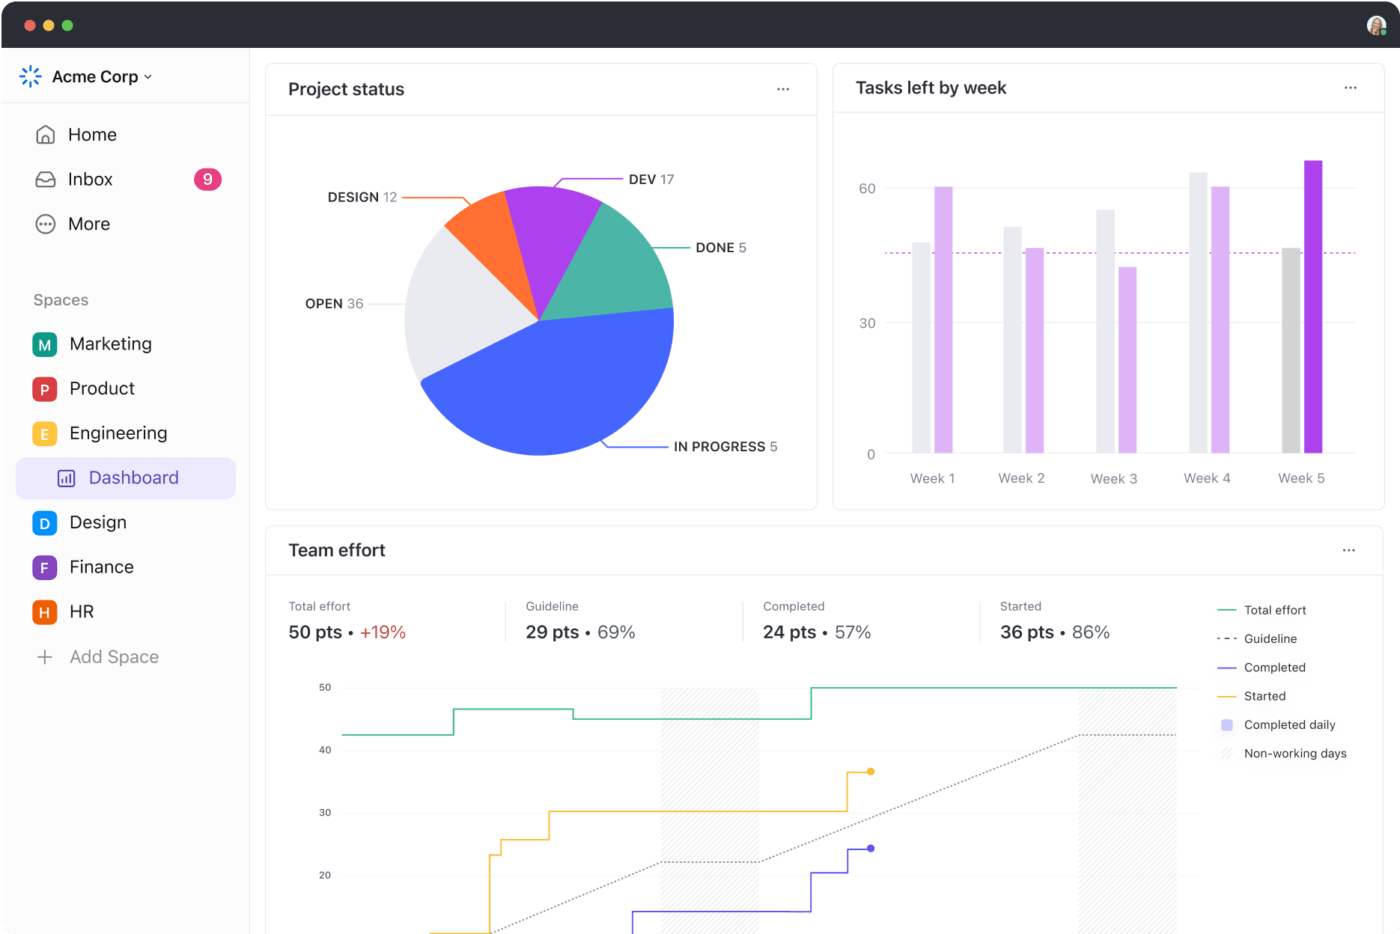
Customizable ClickUp Dashboards provide high-level overviews of your projects, allowing you to monitor key performance indicators, workload, and progress across all tasks and team members. Using ClickUp Dashboards:
With ClickUp’s Native Time Tracking feature, your team members can record the time spent on tasks directly within the app. This feature helps assess productivity and manage resource allocation more effectively. With this feature:
Bonus: Check out this list of free database software to turn your data into actionable insights.
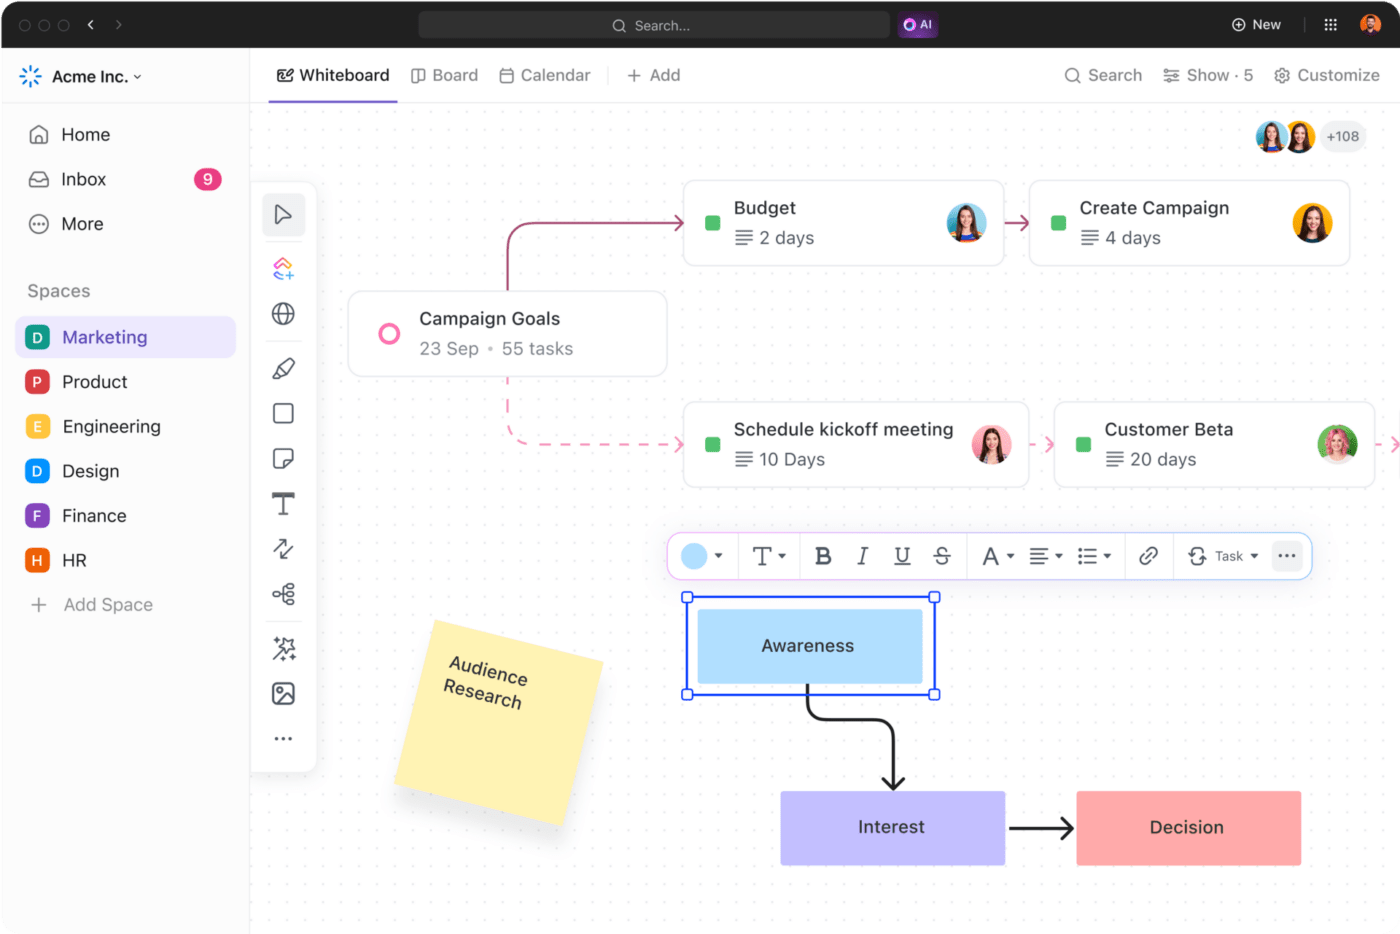
ClickUp Whiteboards revolutionizes visual collaboration, seamlessly turning spontaneous ideas into structured projects and tasks. It provides a dynamic canvas for teams to brainstorm, strategize, and map out agile workflows in real time.
With intuitive drawing, writing, and linking tools, Whiteboards foster creativity and ensure that every team member’s contributions are visually represented. With ClickUp Whiteboards, you can:
Use Whiteboards across all types of projects, from simple brainstorming sessions to complex roadmap creations.

Mind Maps in ClickUp help brainstorm and plan projects by visually organizing thoughts and tasks. This interactive tool enhances creative processes and helps teams conceptualize project structures. With this feature:
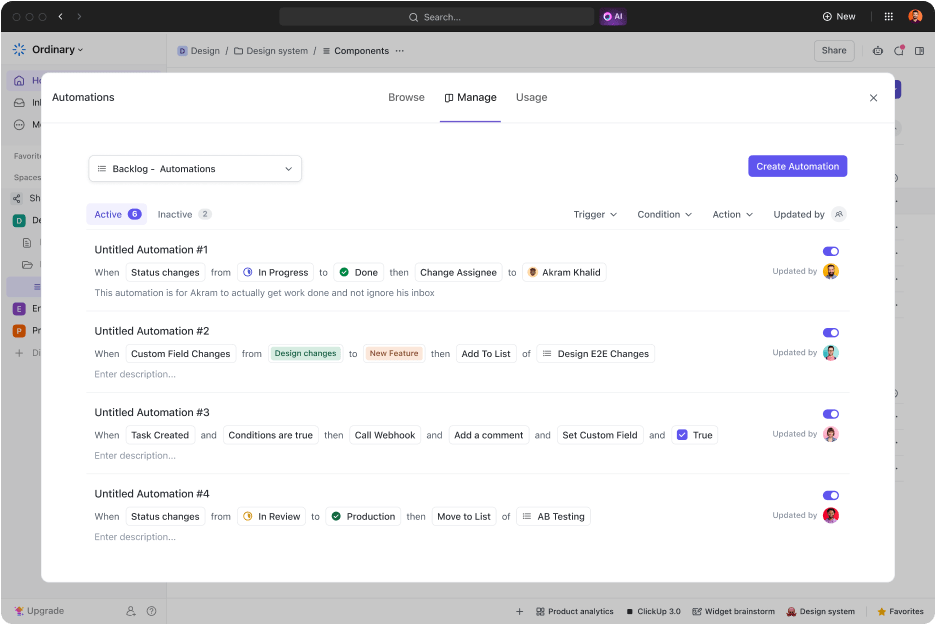
ClickUp Automation removes the need for you or your team to spend time on repetitive tasks by automating routine actions based on triggers and conditions defined by the user. This boosts efficiency and ensures workflow consistency. Using ClickUp automation, you can:
Migrating checklists from Google Sheets to ClickUp involves a short series of steps that ensure your Google Sheet database is transferred accurately and effectively. Here they are
As we’ve seen, while Google Sheets offers a solid foundation for data management, its limitations can hinder your project’s growth—especially when dealing with larger datasets or more complex projects.
The good news is that you don’t have to settle for mediocrity. With ClickUp, you can elevate your data management game to a new level!
Imagine a workspace where you can seamlessly create dynamic tables, customize views, and automate routine tasks—all within one platform. ClickUp’s rich features empower you to visualize data, collaborate effortlessly with your team, and streamline your workflows like never before.
Whether utilizing the powerful Table View to organize your tasks or leveraging the versatility of Whiteboards for brainstorming sessions, ClickUp transforms how you handle data and projects.
So why not make the switch? Experience the efficiency, customization, and scalability that ClickUp offers. Join the countless teams across enterprises that have upgraded their productivity and project management strategies.
Start your ClickUp journey today and unlock the full potential of your data!

© 2026 ClickUp

There’s an easier way. Try a free AI Agent in ClickUp that actually does the work for you—set up in minutes, save hours every week.