Sorry, there were no results found for “”
Sorry, there were no results found for “”
Sorry, there were no results found for “”
Why does measuring training effectiveness matter?
Because what gets measured gets managed. And when an org-wide initiative is managed well, it turns into a data-driven function that drives growth and engagement and ensures a tangible return on investment (ROI).
Yet, many companies struggle to prove the ROI of their training efforts. This is where Key Performance Indicators (KPIs) for training and development come in.
KPIs serve as the critical bridge between training activities and business outcomes, offering a structured way to quantify success, identify areas for improvement, and demonstrate value to stakeholders.
Ready to turn your training efforts into measurable wins? Let’s dive into how KPIs can elevate your L&D strategy.
🎉 Fun Fact: Toyota’s famed “5 Whys” method helps trainers uncover root causes of learning gaps by asking “why” five times after training. It’s a quick diagnostic that reveals deeper gaps, not just surface issues.
For example:
Root cause: Lack of ownership in the translation process—not the trainee’s ability!
In the context of learning and development, KPIs are specific, data-driven metrics that help HR and L&D teams assess the effectiveness, efficiency, and impact of training programs.
By now, we’re all familiar with the definition of KPIs: they are quantifiable measures used to evaluate an organization’s success in achieving key business objectives.
Training KPIs provide an objective basis for decision-making, allowing you to track progress toward goals such as improved employee performance, higher engagement, reduced turnover, or increased ROI.
While the terms “KPIs” and “metrics” are often used interchangeably, they serve distinct purposes:
📌 Example: While “number of employees trained” is a metric, “percentage of employees who applied new skills to improve project delivery time” is a KPI.
KPIs matter because they drive continuous improvement. By regularly monitoring these indicators, you can:
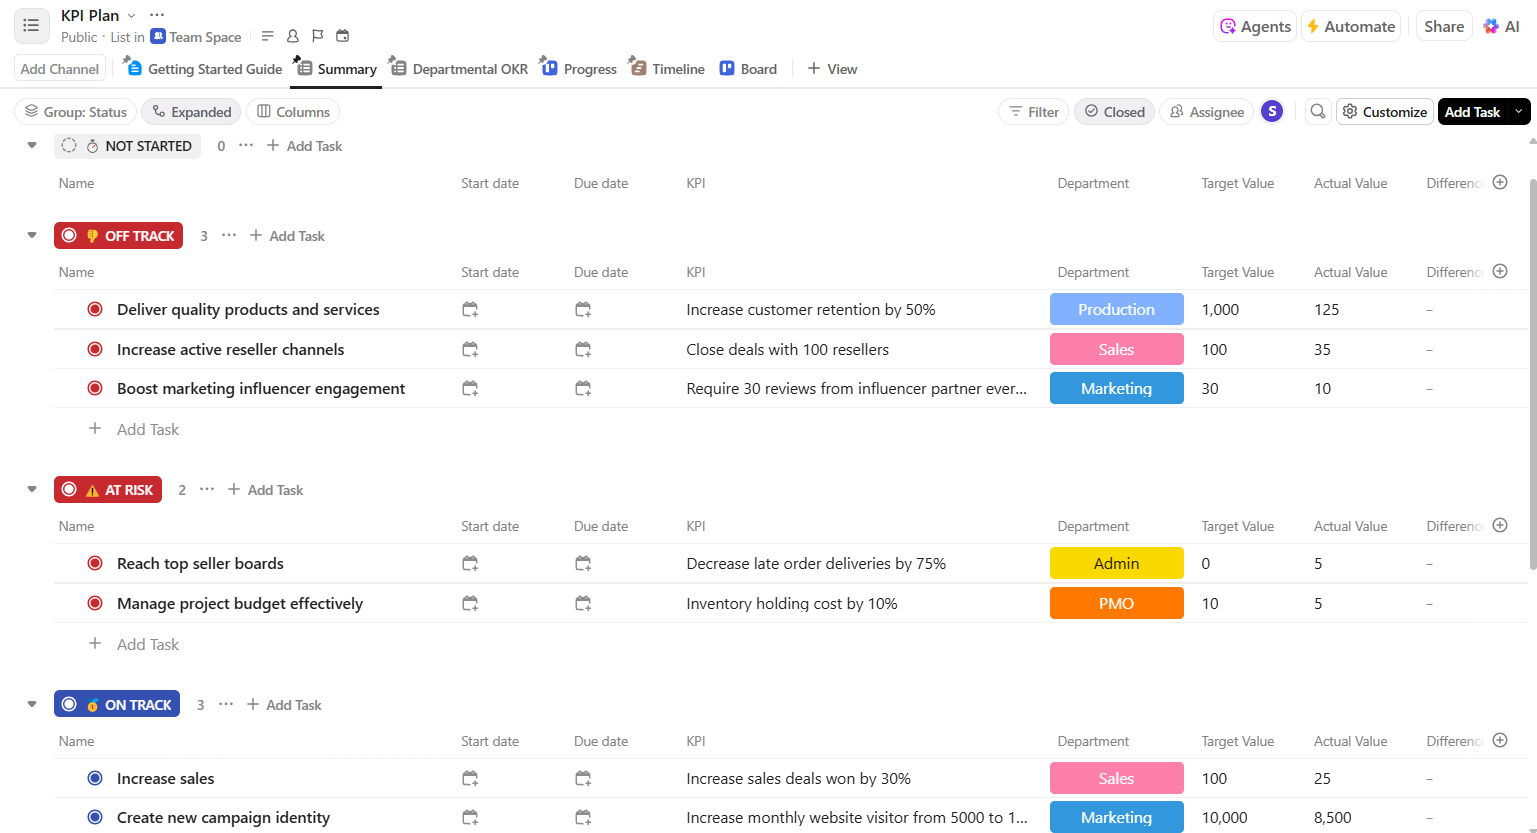
From startup to enterprise, growth hinges on one habit: stay on top of your KPIs, double down on what works, and fix what doesn’t. ClickUp’s KPI Template makes it easy to track and visualize key performance indicators that are crucial for business success.
An AI-led all-in-one platform like ClickUp makes it easier than ever to track, visualize, and act on these metrics in real-time, maximizing the impact of your training and development opportunities.
Tracking the right KPIs transforms your employee training programs from an expense into a strategic investment. These 15 essential metrics will help you measure what matters most in your L&D initiatives, directly linking them to improved job performance and overall training success.
💡 Pro Tip: Start with the end in mind. Define what success looks like for your training program before it begins—this will make selecting and tracking the right KPIs much easier.
This fundamental metric measures the percentage of employees who complete assigned training courses. High completion rates typically indicate accessible, relevant content and proper scheduling—key factors in employee engagement. Low rates may signal issues with your training initiatives or logistical barriers.
📌 Imagine this scenario: A technology company tracks that 85% of engineers complete their cybersecurity training, while only 60% complete leadership development courses. This discrepancy could indicate the need to make the leadership training program more relevant or accessible.
Track completion rates by department, location, and job role to identify patterns and address specific gaps in your program’s effectiveness, which are crucial employee training metrics.
You can set target completion rates and track progress automatically across departments and locations with ClickUp Goals. As employees finish their training, progress updates are made in real-time, giving you a clear view of how close you are to your targets for all your training initiatives.
Goals in ClickUp let you break down your overall training objectives into smaller, measurable targets—such as completion rates for each team or location. As employees finish their training, progress updates are made in real time, giving you a clear view of how close you are to your targets.
You can also organize Goals into folders for different programs or time periods, and visualize progress on Dashboards for easy reporting and quick action if targets aren’t being met.
This metric calculates the average time employees spend on training activities, helping organizations optimize resource allocation and identify efficiency opportunities within their training initiatives.
📌 Imagine this scenario: A retail chain discovers their customer service training takes 12 hours on average, while competitors achieve similar results with 8-hour programs. By analyzing this data, they can streamline content and reduce training time without compromising quality.
Monitor this metric across different training formats (e-learning, in-person, hybrid) to determine the most time-effective delivery methods for your organization’s specific needs.
ClickUp Time Tracking capabilities allow you to monitor training duration across different programs and formats.
ClickUp, the Everything App for Work, offers robust reporting features that help you see if certain courses are taking longer than expected while still delivering results. With tools like Dashboards, Time Tracking, and Custom Fields, you can monitor course durations, compare them across teams or programs, and spot trends.
This comprehensive metric measures how actively employees participate in training beyond simple completion. Track video watch time (including replays of key sections), forum participation rates, assignment submission timeliness, and interaction with quizzes or simulations. This is a direct indicator of employee engagement.
To boost engagement, consider implementing microlearning modules, incorporating gamification elements, enabling social learning features, and personalizing content based on individual learning patterns and role requirements.
Measure how much information employees retain weeks or months after training concludes. Use pre-training and post-training assessments with identical questions, spaced repetition testing, and practical application exercises. This KPI is fundamental for linking learning to improved job performance.
📌 Imagine this scenario: A healthcare organization implements monthly knowledge checks for its compliance training and discovers that retention drops after 60 days, prompting it to add quarterly refresher courses.
This KPI helps identify which training methods yield the best long-term results and where reinforcement might be needed.
ClickUp Docs can host assessment materials, while its task dependencies and recurrence features help schedule spaced repetition testing. ClickUp Custom Fields allow you to track retention scores alongside other performance metrics, creating a comprehensive view of long-term learning impact.
Also, Automations at ClickUp help trigger reminders, assign refresher courses, or update statuses based on assessment results or time intervals.
Gather immediate feedback through structured post-training surveys measuring content relevance, instructor effectiveness, delivery method satisfaction, and overall experience. Use Likert scales (1-5 or 1-7) or net promoter score questions. This score is a crucial pulse check on employee satisfaction.
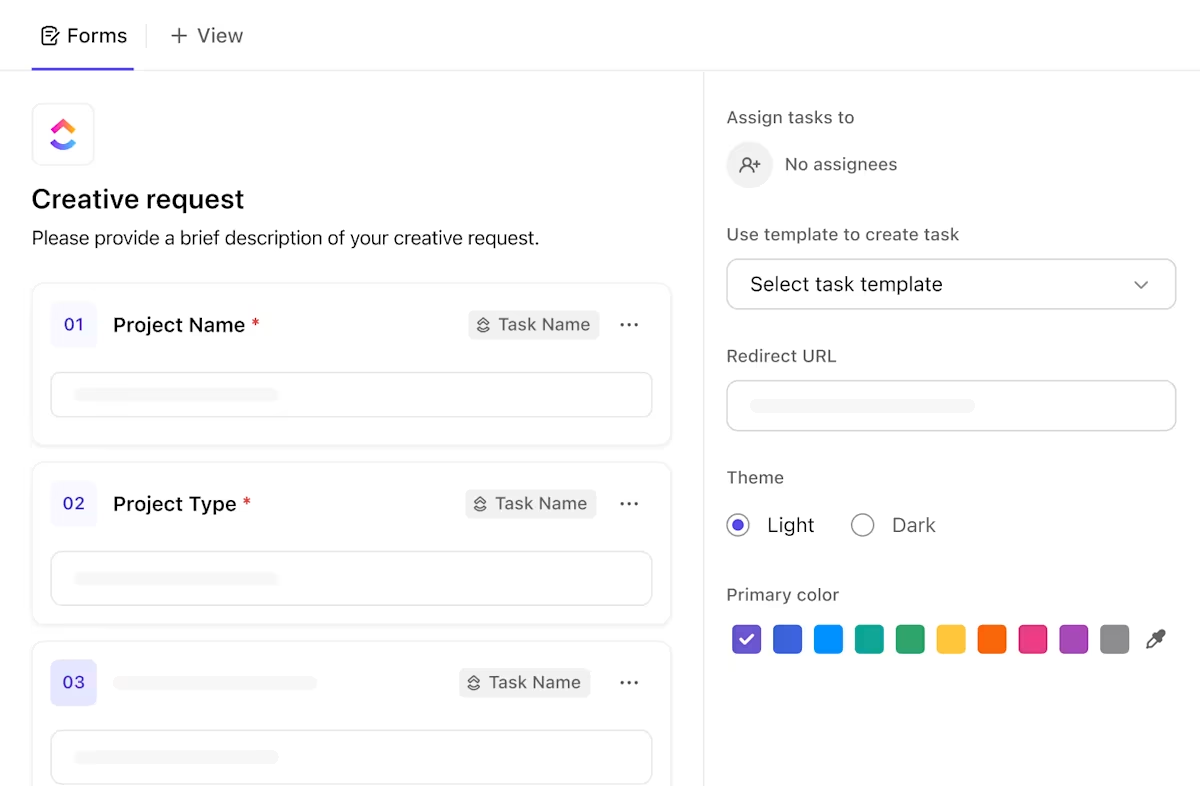
Analyze satisfaction data regularly to identify trends and make data-driven improvements to your training programs. Modern online learning platforms often have built-in tools for this, making it easy to gather and act on feedback quickly. You can use ClickUp Forms to create and distribute satisfaction surveys, with responses automatically organized and analyzed.
ClickUp Forms make it easy to design custom post-training surveys with Likert scales, NPS questions, and open-ended feedback fields. Each response is automatically turned into a task, so you can track, review, and analyze satisfaction data in one place.
With Forms, you can also segment responses by course, instructor, or department, making it simple to spot patterns and take targeted action to improve your training programs.
Track the percentage of employees who successfully demonstrate new competencies through practical assessments, supervisor evaluations, or skill demonstration sessions.
📌 Imagine this scenario: A software company can measure skill acquisition rate by having developers complete real coding challenges after training.
This KPI moves beyond knowledge testing to verify actual capability development, ensuring your training delivers tangible skill enhancement.
ClickUp’s Custom Statuses and progress tracking help monitor skill development milestones.
Measure observable workplace behavior changes through manager observations, peer feedback, performance data analysis, and self-assessment surveys. This metric directly connects training to practical workplace application and cultural impact.
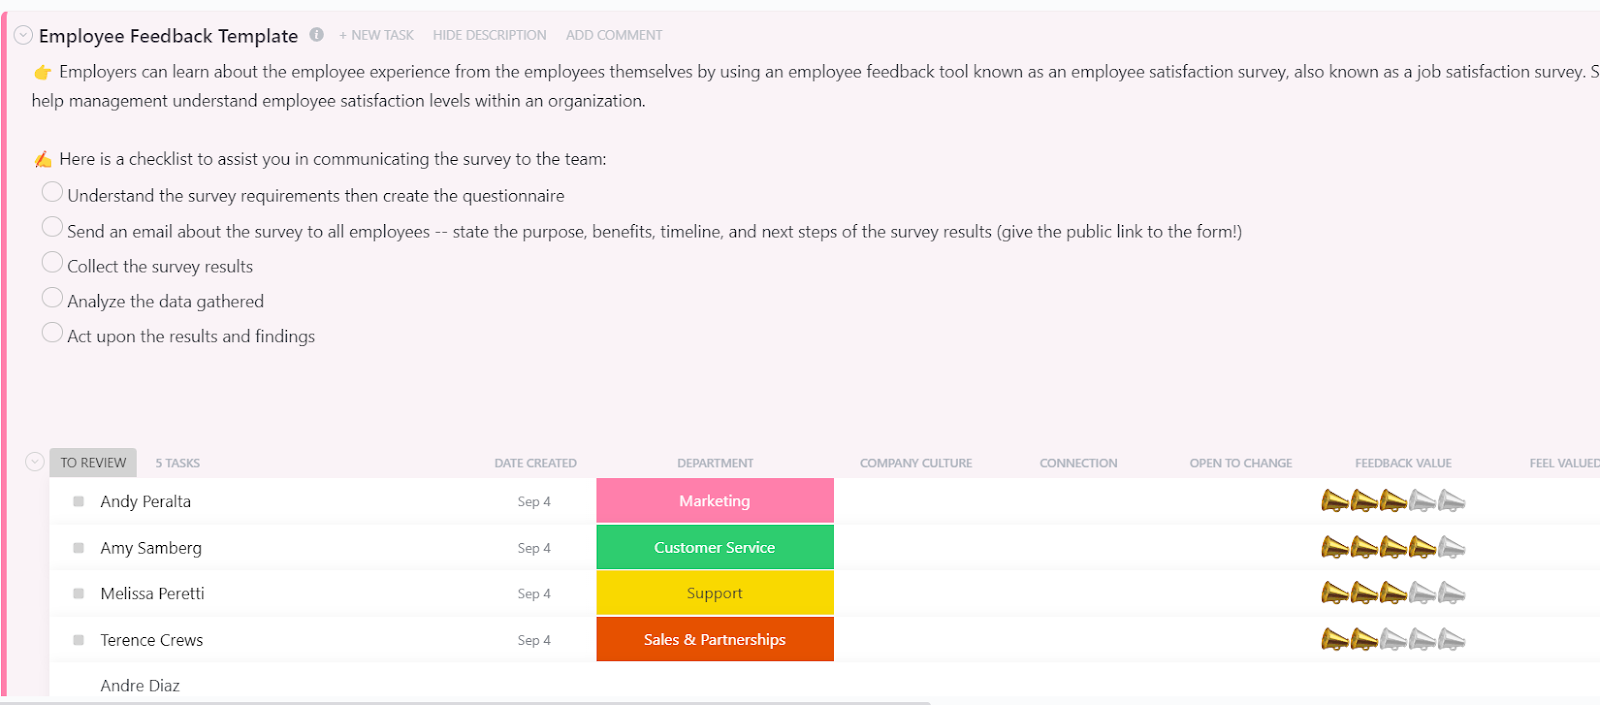
ClickUp’s workflow templates, like the Employee Feedback Template and the Performance Review Template, standardize behavior observation processes. Its reporting features help quantify behavioral changes over time.
ClickUp’s comment threading and @mentions make it easy for managers to provide specific, actionable feedback tied to training objectives.
Again, ClickUp Forms can be used for self-assessment surveys or structured peer/manager feedback, with responses automatically tracked as tasks.
Calculate total training investment divided by the number of employees trained, including content development, instructor fees, facility expenses, technology costs, and employee time. This analysis helps optimize budget allocation and compare cost-effectiveness across different delivery methods and program types.
ClickUp’s Table View and Custom Fields excel at tracking financial metrics across multiple training programs. ClickUp’s formula fields make it easy to track costs for each employee and see how your spending compares to your budget as you go. Everything updates automatically, so you always know where you stand.
Measure how quickly employees reach full proficiency after training completion. Track the time from training end to meeting performance standards or productivity benchmarks. This KPI is particularly valuable for onboarding programs and role-specific training where rapid proficiency directly impacts operational efficiency.
ClickUp’s Gantt Chart View helps visualize the journey from training completion to full productivity. With dependency tracking, you can ensure support resources are available when needed, while its progress metrics will help you identify bottlenecks in the transition from learning to application.
Connect training to tangible employee performance metrics, including quality rates, error reduction, productivity output, customer satisfaction scores, and sales conversion rates. When possible, compare pre- and post-training performance data using control groups.
📌 Imagine this scenario: A customer service center documents a reduction in call handling time and improvement in customer satisfaction scores after implementing new communication training, demonstrating clear return on training investment.
With ClickUp Goals, you can set targets and track progress. You can also build custom dashboards to see how training completion lines up with things like work quality, productivity, or customer satisfaction. Plus, ClickUp connects with other performance tools you might already use.
Track retention rates for trained employees compared to untrained cohorts at 6-month and 12-month intervals. This metric helps quantify the impact of development opportunities on employee loyalty and retention, particularly for high-potential employees.
ClickUp Automation can trigger retention surveys at 6-month and 12-month intervals, while its reporting capabilities help identify the correlation between specific training programs and employee longevity.
Calculate financial return using the formula: [(Monetary benefits – Training costs) / Training costs] × 100. Include both quantitative benefits (increased productivity, reduced errors) and qualitative benefits (improved morale, better customer service) converted to monetary values.
📌 Imagine this scenario: A logistics company calculates the ROI of their safety training program based on reduced workplace accidents and associated costs, providing concrete evidence of training value to stakeholders.
ClickUp Dashboards provide executive-friendly visualizations of training ROI, making it easier to demonstrate program value to stakeholders.
ClickUp Forms with standardized rating scales and open-ended questions help collect structured manager feedback.
Automations ensure feedback tasks are created and assigned consistently. Use Custom Fields to capture manager ratings and comments. Visualize and analyze trends across teams and programs with Dashboards and Table View, making it easy to spot strengths and areas for improvement.
📮ClickUp Insight: A typical knowledge worker has to connect with 6 people on average to get work done. This means reaching out to 6 core connections on a daily basis to gather essential context, align on priorities, and move projects forward.
The struggle is real—constant follow-ups, version confusion, and visibility black holes erode team productivity. A centralized platform like ClickUp, with Connected Search and AI Knowledge Manager, tackles this by making context instantly available at your fingertips.
Collect structured feedback from managers on observable performance improvements, team impact, skill application, and overall value perception. Use standardized rating scales and open-ended questions.
Track the percentage of employees who receive promotions or role changes after completing development programs. This measures how effectively training prepares employees for advancement and supports talent pipeline development, particularly for leadership and specialized roles.
ClickUp’s career progression tracking capabilities help monitor internal mobility patterns. Goal alignment features ensure that training programs develop skills that align with organizational growth opportunities.
Connect training to organizational-level outcomes, including revenue growth, operational efficiency, innovation metrics, market share changes, and strategic goal achievement. These high-level metrics demonstrate training’s contribution to overall business success and help secure executive support for future L&D investments.
📌 Imagine this scenario: A pharmaceutical company links their research methodology training to a reduction in the time-to-market for new drugs and an increase in successful clinical trials.
Connect training to organizational outcomes using ClickUp’s strategic goal tracking and OKR features.
🔎 Did You Know? Businesses or work units that scored the highest on employee engagement also scored higher on productivity and showed higher levels of profitability.
Choosing the most relevant KPIs for your organization requires aligning measurement with your specific business objectives, training goals, and available resources. The most effective KPI strategy focuses on metrics that directly connect to your organization’s priorities rather than tracking everything possible.
Begin by identifying your organization’s top priorities. If customer satisfaction is a key goal, focus on KPIs that measure service quality improvements. For companies prioritizing growth, metrics around sales performance and productivity gains will be most relevant. Organizations focused on innovation should track skill acquisition and application rates.
Always ensure your selected KPIs directly support your company’s strategic direction.
Different training types require different measurement approaches:
Be realistic about what you can effectively track with your current systems. Start with 3-5 KPIs that you can measure accurately, rather than attempting to track numerous metrics poorly.
Consider your data collection methods, analysis resources, and reporting capabilities when selecting your KPIs.
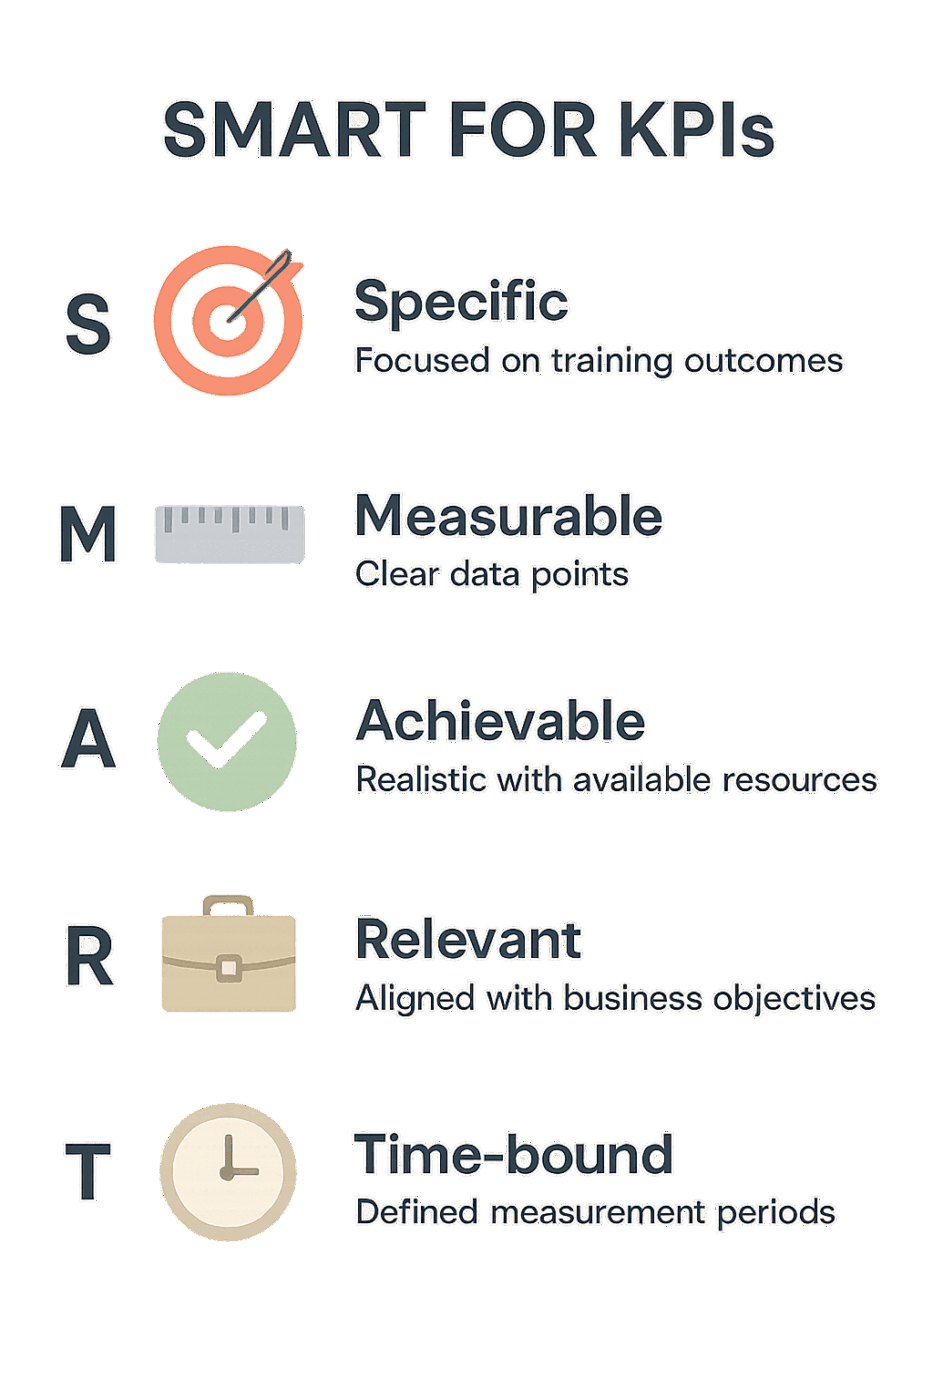
Ensure your selected KPIs are:
Include both immediate training metrics (completion rates, satisfaction scores) and long-term impact measurements (performance improvement, ROI). This balanced approach provides both quick feedback and comprehensive impact assessment.
Engage managers, executives, and participants in KPI selection. Their input ensures the metrics you track align with what various stakeholders consider valuable. This collaboration also increases buy-in when sharing results later.
Your KPI selection should evolve with your organization’s needs. Conduct quarterly reviews to assess whether your current metrics still provide valuable insights and make adjustments as your training programs and business objectives change.
Using a platform like ClickUp can streamline this process through features like:
Example: Microsoft’s “Growth Mindset” Training
Microsoft, under CEO Satya Nadella, was undergoing a massive cultural transformation from a “know-it-all” to a “learn-it-all” culture. A key initiative was company-wide training on the concepts of a growth mindset (the belief that abilities can be developed through dedication and hard work).
The selected KPIs: Instead of just measuring course completion rates (a basic metric), Microsoft’s L&D and People Analytics teams focused on KPIs that could prove the training was actually changing culture and impacting business. They selected:
The results: By tracking these advanced KPIs, Microsoft demonstrated a clear link between its training and tangible business results. Leadership and industry analysts widely credit the strategy as a key driver in improving innovation, engagement, and market performance during the company’s resurgence.
Moving from selecting the right KPIs to actually measuring them requires the right tools, processes, and strategies. Effective measurement isn’t just about collecting data—it’s about creating a system that provides actionable insights and drives continuous improvement in your L&D programs.
Your Learning Management System (LMS) is the foundation for tracking fundamental training metrics. Modern LMS platforms provide built-in analytics for completion rates, assessment scores, time spent on modules, and participation patterns.
When selecting an LMS to measure KPIs effectively, you need to look beyond basic course hosting and focus on its analytical and integration capabilities.
Break down data silos by connecting your LMS with your team’s everyday work platforms.
ClickUp integrates with popular LMS platforms, HR systems, and performance management tools, creating a centralized hub for all your training data. This integration allows you to connect training completion with actual work outcomes—for example, linking sales training completion to CRM performance data or connecting safety training to incident reporting metrics.
This holistic view helps demonstrate how training translates into real workplace impact.
ClickUp Dashboards are powerful tools for transforming raw training data into clear, actionable insights. With fully customizable widgets, you can build dashboards that automatically visualize your most important KPIs in real time—eliminating the need for manual data compilation or spreadsheet updates.
Here are the key ways ClickUp Dashboards support KPI tracking for training programs:
With ClickUp Dashboards, you gain a centralized, dynamic view of all your training KPIs—empowering you to make data-driven decisions, demonstrate program value, and continuously improve learning outcomes.
Shikha Chaturvedi, Business Analyst—Cedcoss Technologies Private Limited, has this to say about the ClickUp Dashboard.
As a business analyst, the dashboard feature of ClickUp has made it a lot easier to depict data in a beautiful and purposeful manner. The comparison feature has customization through which data can be displayed in a meaning complete way and can be understood very easily
ClickUp Automations are powerful tools that eliminate manual, repetitive work from your training management process. By setting up automated workflows, you can ensure that every step of training participation, completion, and compliance is tracked consistently and efficiently—freeing your L&D team to focus on improving program quality rather than chasing down tasks.
ClickUp Automations streamline training tracking with:
With ClickUp Automations, you create a reliable, scalable process for managing training completions and deadlines, and your organization stays compliant and ready for audits or reviews.
📮 ClickUp Insight: 34% of workers say the biggest barrier to automation is uncertainty about which tools to use. While many want to work smarter, they’re overwhelmed by the choices and lack the confidence to take the first step. 😓
ClickUp removes this confusion by offering intuitive, user-friendly AI Agents that can automate your work within a single platform—no need to juggle multiple tools. With features like ClickUp Brain, our AI assistant, and custom AI agents, teams can automate processes, plan, prioritize, and execute tasks without advanced technical expertise or tool overload.
💫 Real Results: Lulu Press saves 1 hour per day per employee using ClickUp Automations, leading to a 12% increase in overall work efficiency.
Go beyond quantitative metrics to truly understand the qualitative impact of your training programs. ClickUp’s suite of AI solutions offers advanced tools for extracting meaning and actionable insights from feedback, comments, and reviews.
Instantly uncover insights from feedback with ClickUp Brain
Collecting feedback from surveys, manager reviews, and performance evaluations is essential—but making sense of all that open-ended input can be overwhelming. ClickUp Brain acts as your AI Knowledge Manager, transforming scattered responses into actionable insights in seconds.
With a quick search or summary prompt, ClickUp Brain will instantly analyze the content, highlight recurring themes (like “collaboration,” “growth opportunities,” or “training effectiveness”), and surface sentiment trends—so you can see at a glance what’s working and where improvements are needed.
Here’s a sample of ClickUp Brain @work👇
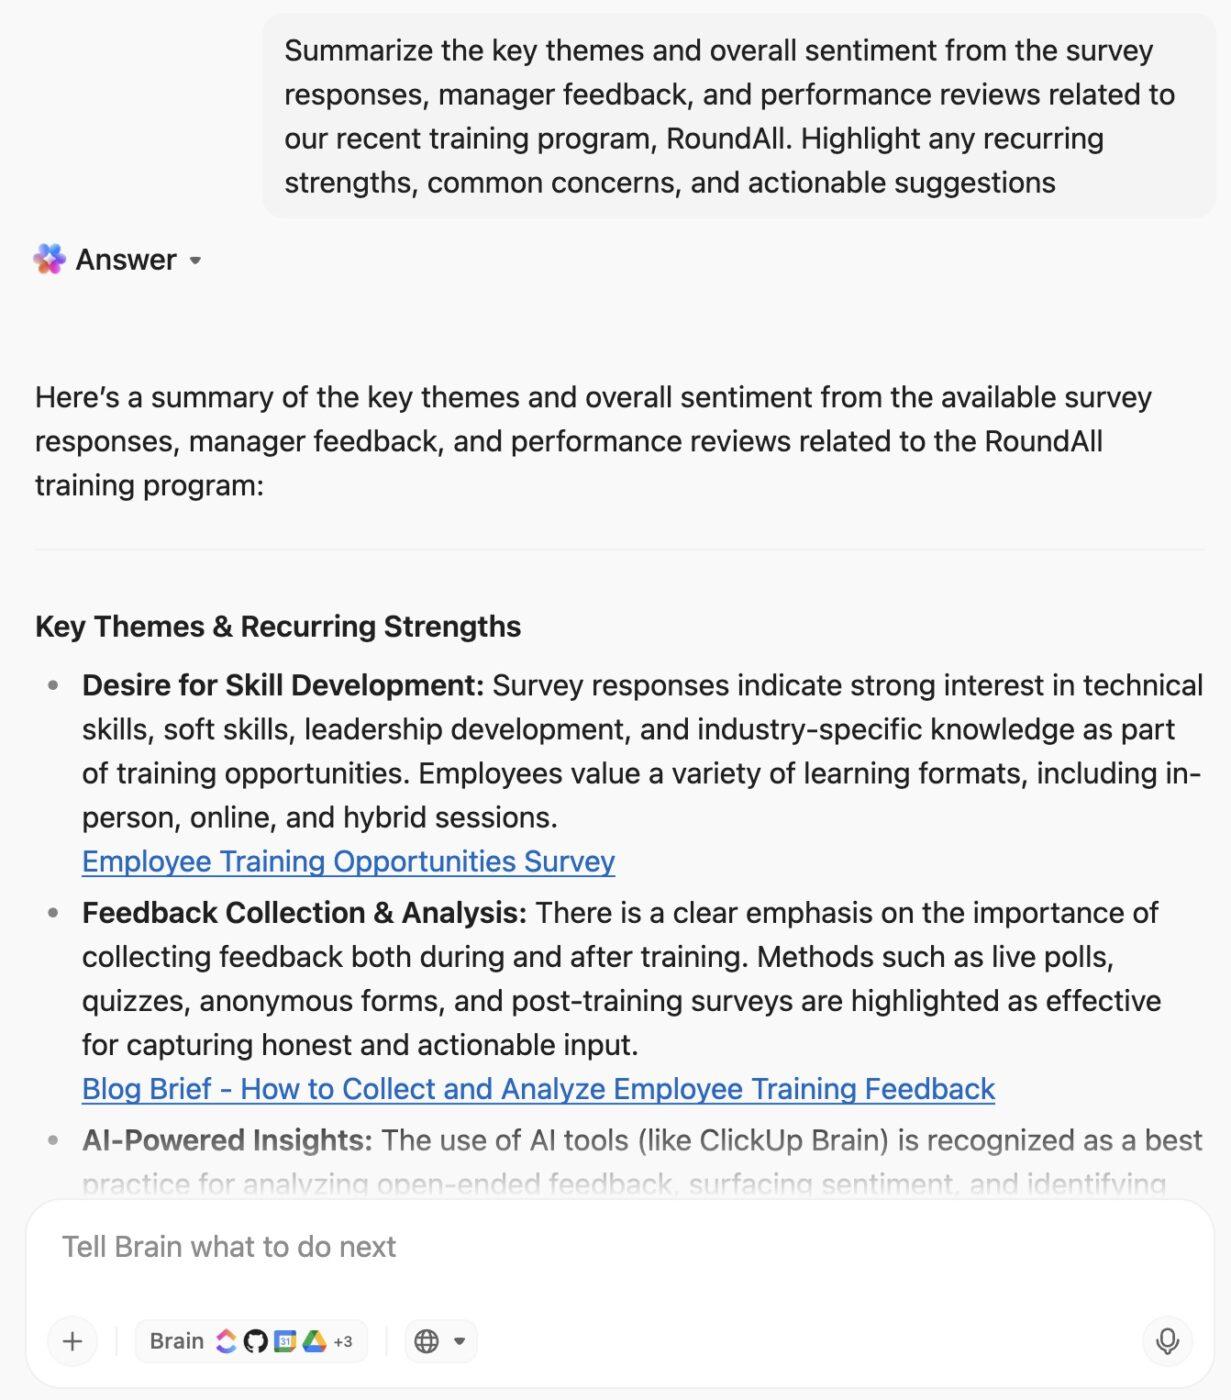
No more manual sifting or missed patterns. ClickUp Brain’s AI ensures you never overlook important feedback, empowering your team to make data-driven decisions and continuously improve your training programs.
Instantly connect feedback sentiment with performance metrics
You can go beyond surface-level feedback with ClickUp Brain MAX. The enhanced AI capabilities automatically identify patterns between the sentiment expressed in survey responses and key performance metrics—such as productivity, engagement, or promotion rates.
For example, if positive feedback about a training module correlates with higher productivity scores or increased promotion rates, ClickUp Brain MAX will surface these insights. This holistic view enables you to measure not just how employees feel about training, but also how those perceptions translate into real business outcomes.
Advanced features like sentiment detection, theme clustering, and correlation mapping provide a deeper, data-driven understanding of training effectiveness.
Forget the hassle of bouncing between scattered apps and platforms with ClickUp Brain MAX. It merges your most important work functions—AI, search, and automation—right inside a single, streamlined desktop experience.
Here’s what you get:
Automate monitoring and reporting with AI Agents
AI Agents in ClickUp can be set up to continuously monitor new survey responses and feedback submissions. They automatically flag any negative sentiment or urgent issues for immediate review, ensuring that potential problems are addressed before they escalate.
Additionally, these agents can generate summary reports for stakeholders on a regular schedule or on demand. This automation saves your team hours of manual analysis and ensures that decision-makers always have up-to-date, actionable insights at their fingertips.
Summarize qualitative feedback effortlessly with AI Fields
AI Fields allow you to automatically summarize open-ended feedback or generate sentiment scores directly within each training task. Instead of manually reading through every comment, you can instantly see a concise summary or a sentiment rating (positive, neutral, negative) for each response.
This makes it easy to review qualitative insights at a glance, spot trends, and quickly identify areas that need attention—all without leaving your ClickUp workspace.
Visualize insights instantly with AI Cards on Dashboards
By adding AI Cards to your ClickUp Dashboards, you can display real-time, AI-generated summaries and trends from your training feedback. These cards highlight key themes, sentiment shifts, and areas for improvement, making it easy for stakeholders to understand the impact of training programs at a glance. With up-to-date visualizations, leadership can make informed decisions faster and track progress over time.
This AI-powered analysis helps you understand what’s happening with your training programs, why it’s happening, and how to improve.
⚡️Template Archive: Ready-to-use employee training checklist templates
Moving beyond simple data collection, AI-powered analysis transforms raw numbers into actionable intelligence. This capability allows L&D teams to identify hidden trends, predict outcomes, and understand the nuanced story behind their training KPIs.
AI-assisted analysis uses machine learning algorithms to process large volumes of both quantitative and qualitative data. It goes beyond traditional reporting by automatically surfacing correlations, patterns, and sentiments that would be impractical to find manually. This isn’t just automation—it’s augmentation, providing a depth of insight that unlocks strategic decision-making.
This technology can be applied across multiple aspects of your training program:
📌 Example: Google’s Project Oxygen
While not a traditional “training program,” Google’s People Analytics team provides a masterclass in using data and machine learning to derive insights that directly inform employee development and management training.
The initiative: Google used sophisticated data analysis to determine what traits and behaviors made their most effective managers. They analyzed performance reviews, feedback surveys, and manager nominations.
The AI/Data role: By processing this massive amount of qualitative and quantitative data, they identified eight key behaviors of high-scoring managers. This analysis moved beyond hunches to data-driven facts.
The L&D impact: Google didn’t just identify these behaviors; they built their management training programs around them. They created workshops focused on coaching these specific, proven behaviors.
ClickUp AI can bring these principles of analysis to any organization. It can help:
This functionality allows modern L&D teams to adopt a “People Analytics” approach, using technology to base their strategies on evidence rather than intuition.
📚 Also Read: AI Tools for Training and Development
The journey from delivering content to driving measurable business value requires a modern approach: moving beyond basic completion rates to KPIs that reveal true behavioral change and performance lift. This means integrating your learning data with the platforms where work actually happens, turning insights into action and proving the undeniable ROI of your programs.
This is where ClickUp becomes your essential command center. It’s the only platform that seamlessly unifies your learning metrics with real-world performance data, empowering you to:
Stop letting your valuable training data live in a silo. ClickUp seamlessly connects your LMS to your operational workflow, giving you the power to demonstrate how learning initiatives fuel business success.
Ready to prove the value of your L&D programs? Try ClickUp for free today and start measuring what truly matters.

Sudarshan Somanathan
Max 20min read
Sudarshan Somanathan
Max 12min read
Sudarshan Somanathan
Max 19min read

© 2026 ClickUp