


Still downloading templates?
There’s an easier way. Try a free AI Agent in ClickUp that actually does the work for you—set up in minutes, save hours every week.
Sorry, there were no results found for “”
Sorry, there were no results found for “”
Sorry, there were no results found for “”
For project management offices and managers who manage multiple projects simultaneously, it’s easy to get lost in the everyday grind. Tracking and measuring progress, ensuring everyone is aligned, and optimizing team workload can be challenging. Nothing puts things into perspective as seeing the whole picture via the project dashboard.
The project portfolio dashboard gives you a complete overview of the project’s health, how the work is progressing for each project, and comprehensive real-time reports on the overall timeline, budget, and status. They guarantee critical project information is available and accessible whenever you or your stakeholders want it.
Building a project portfolio dashboard for the first time can be intimidating owing to the planning and design work involved, and you might even complicate the portfolio dashboard.
What if we tell you advanced project portfolio management software has simplified the process?
Read on to learn how to build dynamic project portfolio management dashboards to optimize your project planning and execution using ClickUp, the best examples, and templates to help you get started quickly.
Project portfolio management is a strategic way to manage an organization’s projects to achieve its business objectives. It includes narrowing down and prioritizing a set of projects that align with the goals of your business.
Project portfolio management aims to maximize the value of your projects by assessing and managing aspects like risks, budgets, and available resources.
The leadership team, portfolio managers, and project managers use a project portfolio management dashboard to visualize all projects and their progress centrally. The dashboard has charts and metrics that allow you to monitor the performance of health indicators and view key milestones, budget information, and resource availability.
In modern organizations, projects are interrelated regarding resources, timelines, and deliverables, and outcomes and success are interdependent; a central portfolio dashboard presents this information in a single pane of view.
You can either build a project portfolio management dashboard or use project portfolio management solutions like ClickUp to make it easier.
ClickUp Dashboards allow you to visualize and analyze your projects from a single control center. Not only do you have an overview of the projects you are working on, but you can share them with key stakeholders. This way, everyone can keep track of how different projects are progressing.
ClickUp dashboard helps us in the depiction of data in a meaningful manner, and it’s a time saver also. I can also create different spaces where I can work with the issues & enhancement part. Moreover, our day-to-day work can also be monitored, and the time tracking which we are spending on a specific task also helps to improve the efficiency of the work.
– Manaswi Dwivedi, Cedcoss Technologies Pvt. Ltd.
As a project management platform, ClickUp allows you to set goals, track the time spent on individual tasks and projects, identify bottlenecks, and resolve them promptly to ensure project completion.
Get real-time visibility into the overall project status, identify bottlenecks, monitor task performance for high-stakes projects, and gauge customer satisfaction.
Since project dashboards are a central hub for everything related to single or multiple projects, they ensure everyone is on the same page about deadlines, tasks, allocated budget, and progress.
Comprehensive and portfolio-level views of the existing and potential projects enable project and portfolio managers to make data-driven decisions for project planning and execution, financial forecasting, and risk management.
Dashboard software helps you visualize crucial metrics at a glance, including team productivity, budget allocation, company goals, and project health status.
Get a complete view of the project activities, budget, workload allocation, resource utilization for various projects, and dependencies to simplify task allocation, avoid employee burnout, and increase the team’s efficiency.
For successful project completion, consider using different project portfolio management software until you find the right one that matches your requirements.
Here are some real-world examples of project portfolio dashboards to help you understand how they can manage multiple projects.
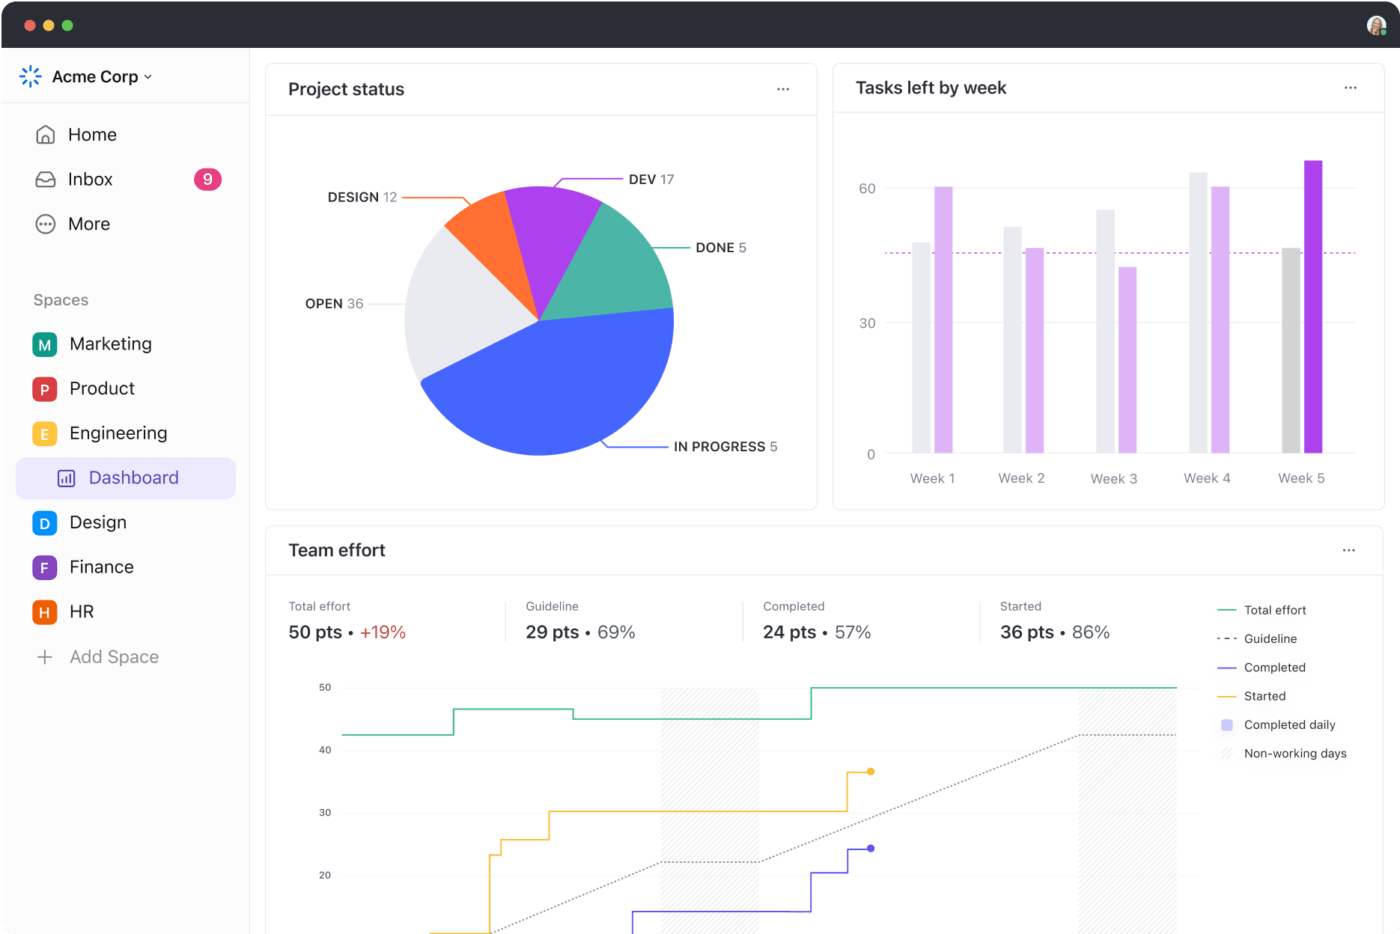
An agile team dashboard brings transparency into your project health and gives you visibility into the team’s performance and sprint progress.
When used in the software development workflow, the agile project portfolio management (PPM) dashboard gives a granular view of the potential bottlenecks, key metrics, progress, and high-priority issues for ongoing projects in a highly visual format.
The elements in the agile dashboard include:
Displayed as a list or Kanban board, it shows the remaining work items, their statuses (to-do, in-progress, done), and estimated workload. With added visibility into the sprint workload, you can see how you progress toward the sprint goal.
This line graph shows story points (the remaining work) plotted against the time remaining in the sprint—to visually track your sprint’s progress and allow proactive adjustments to ensure sprint completion.

The lead time displays the total time from starting a work item to its completion and release. It is used to identify delivery delays, optimize release processes, and improve the time to market.
Pro tip💡: For the burndown chart to be an effective tool for your team, set reasonable goals, learn from past sprints, and make sure you don’t overload your teams.
When you have shared resources working across different projects or planning for resource allocation for a potential project, this project portfolio dashboard displays how resources are distributed across various projects.
ClickUp’s Workload View helps you determine what a team (and team member) has on their plate, where the priorities intersect, what is prioritized, and the tasks that can be pushed—all on a single dashboard.
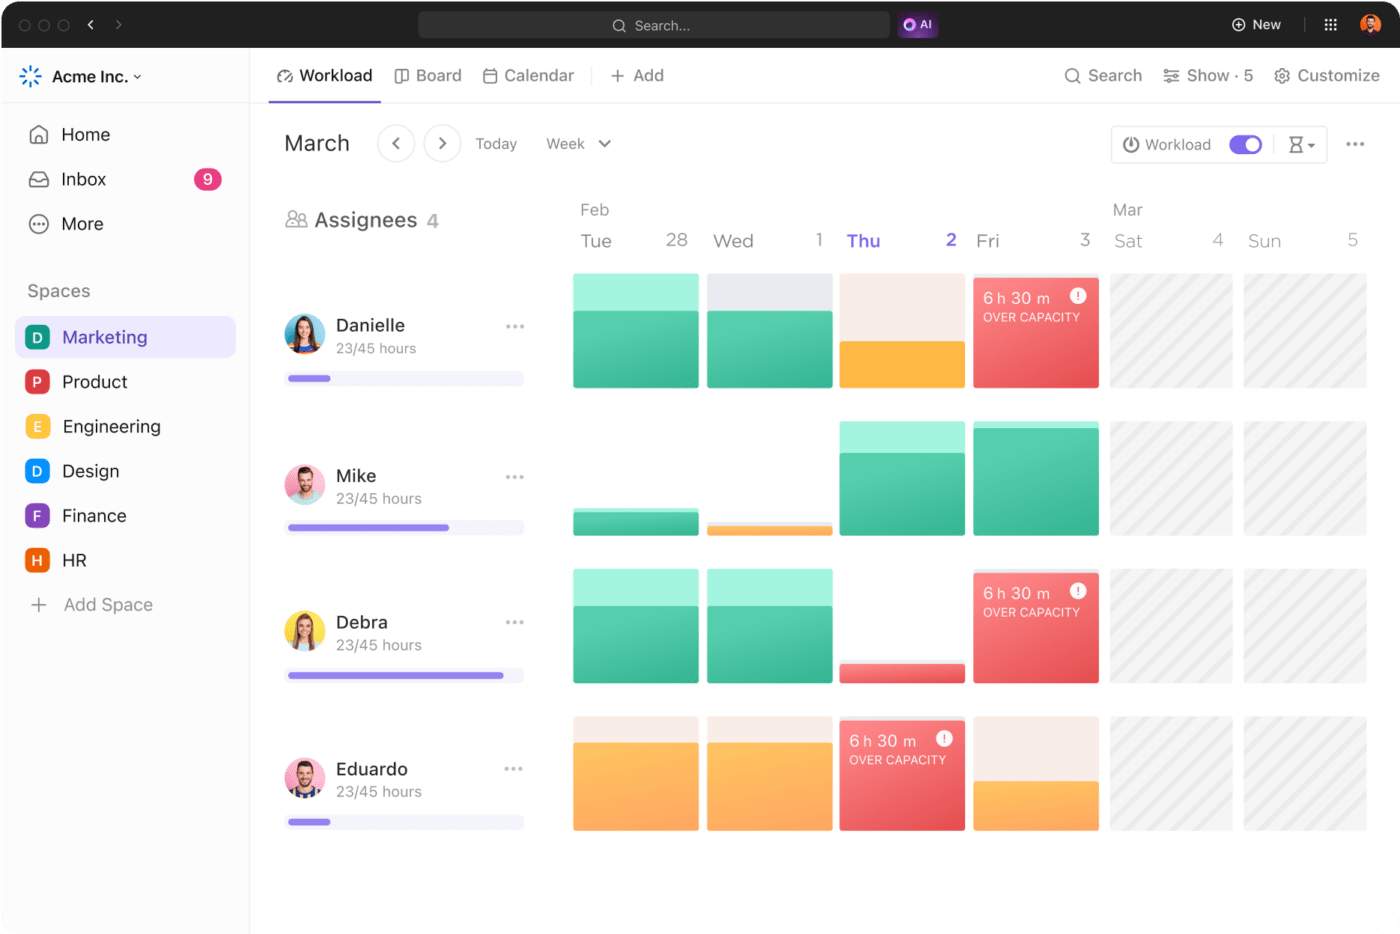
Pro tip💡: Set daily or weekly workload capacity for individual team members. You can set capacities for hours, tasks, and Scrum story points.
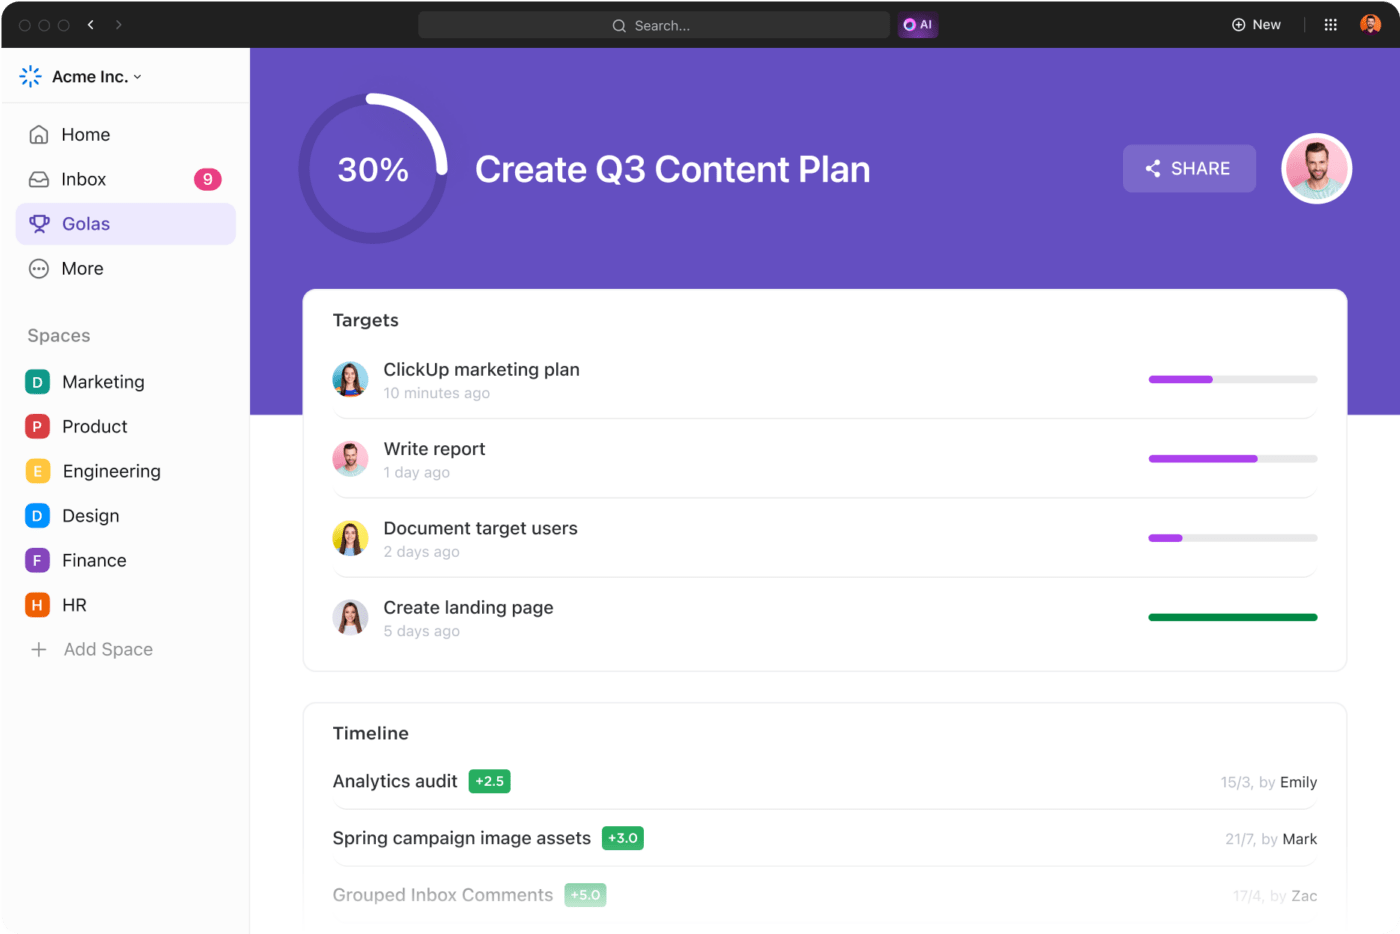
This project portfolio management dashboard shows you the health and progress of your business goals.
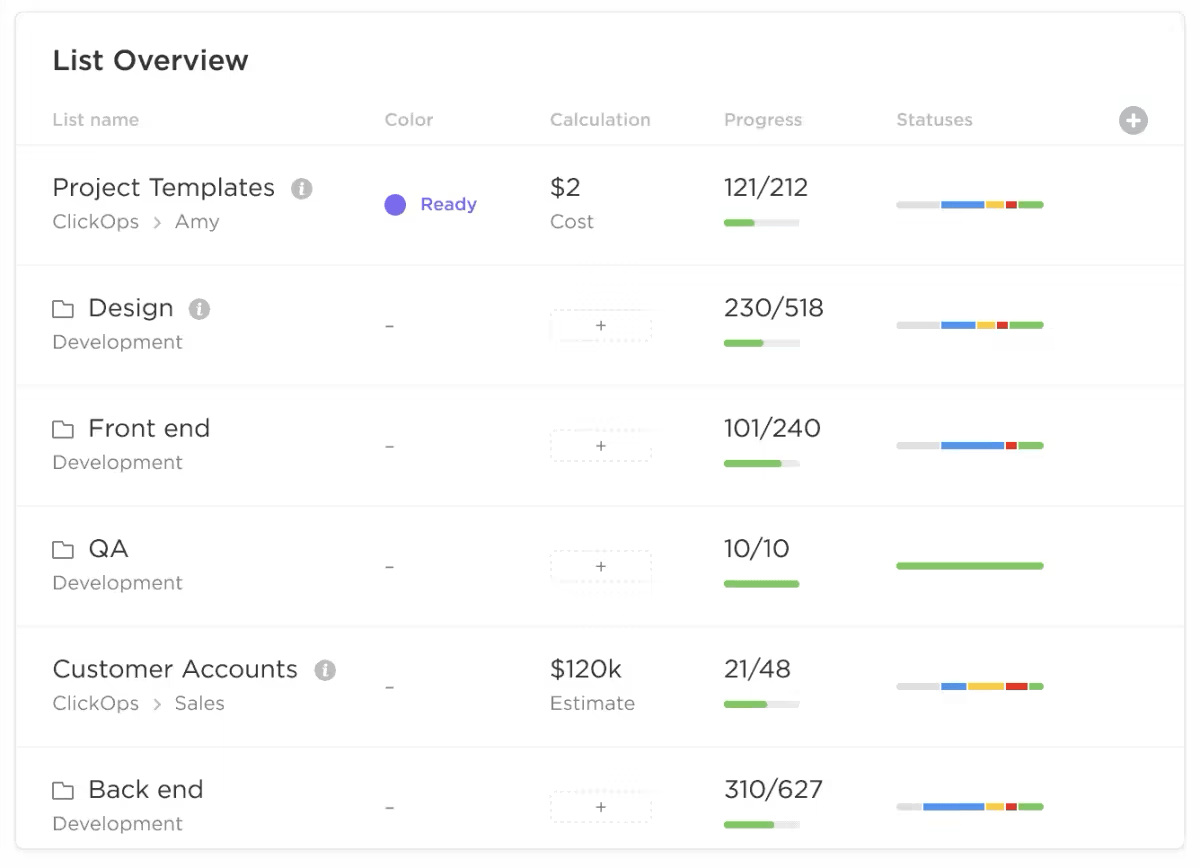
Customize ClickUp Dashboards to plan and track your quarterly business goals easily. When multiple departments are involved in product portfolio management, ClickUp’s list view helps you track the status of each task, the estimated budget, and progress.
Everyone, including the team members, project managers, stakeholders, and leadership, gets insights into their project portfolio’s strategic initiatives and priorities.
Pro tip💡: Use portfolio management templates to track your tasks. After all, PPM dashboards improve a project management office’s efficiency and strategic foresight (PMO).
In project management, an operations dashboard provides real-time insights into how your organization’s different operational processes are proceeding. It allows stakeholders to monitor day-to-day activities, track strategic and operational priorities, and explore data at many levels to analyze and pinpoint your operations’ weaknesses.
Pro tip💡: With role-based access, ClickUp allows you to customize which team members can make changes in the Dashboard and who can view it to track progress.
Share a summary of the project scope and objectives so everyone knows what they’re working on. It will include high-level information such as project names, team members involved, descriptions, total budget, and strategic goals to be achieved.
Set visual indicators on PPM dashboards to easily identify the project status. For instance, red color can indicate incomplete tasks, green indicates completed activities, and orange indicates work in progress.
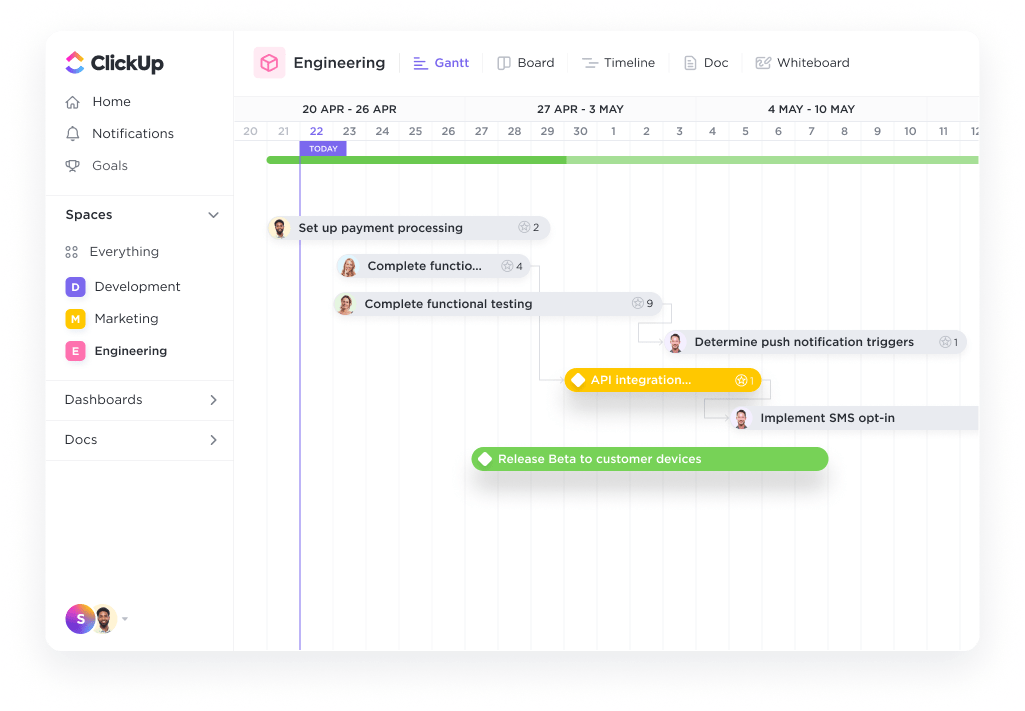
Project management charts are a great way to visualize data, trends, and metrics related to your projects. There are many different types of charts, such as Gantt, project timeline, velocity, burnup, line, work breakdown structure, and line chart.
For instance, ClickUp’s Gantt Chart View lets you see your projects on a timeline. It gives you information such as the tasks and dependencies so you can manage deadlines from a single source of truth.
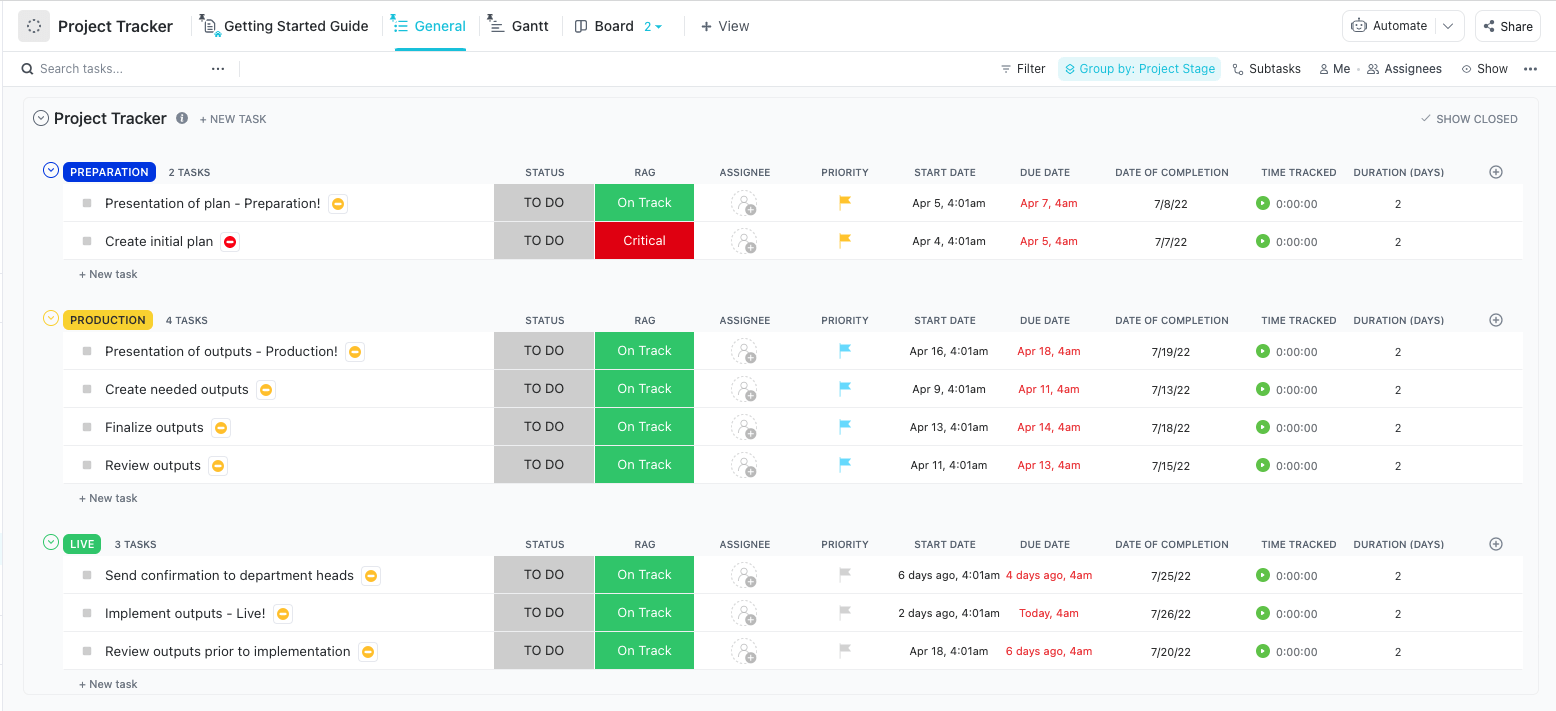
Project trackers measure the progress of tasks and activities throughout a project’s lifecycle, helping team members stay organized, track their respective tasks, see overdue tasks, and monitor timelines.
However, setting up a detailed project tracker can be an effort-intensive process. ClickUp offers project tracker templates that can be customized for any project.
Case in point: ClickUp’s Project Tracker Template is widely used to manage project budgets and deadlines. It helps team leaders see the bigger picture with real-time updates and keeps all projects in one place for easy cross-departmental collaboration.
Pro tip💡: Use this template to create multiple trackers for repeatable projects. This will help you save time after the kick-off call to hit the ground running.
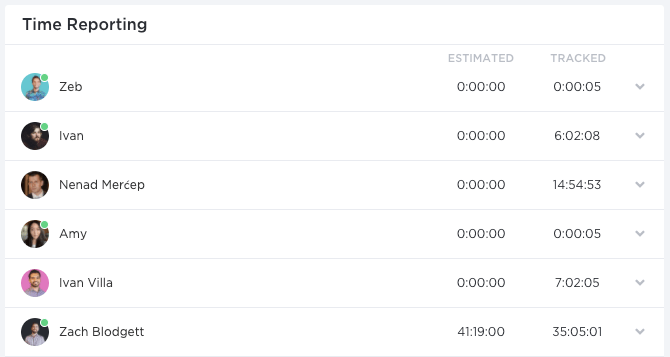
Resource management allows you to see how effectively different resources (employees, budgets, equipment) are distributed for various tasks and if they are utilized effectively.
ClickUp offers several features that can help you manage your resources.
It highlights the potential risks that can impact your project portfolio. Risk management gives stakeholders a better understanding of roadblocks, their likelihood and impact, and how to mitigate them. Additionally, it helps you track and assess whether your risk mitigation efforts are working and ways to minimize the impact of risks on project outcomes.
The earned value represents the total value of all the work completed within a specific time. It is expressed in currency and can be gauged by studying the percentage of tasks and deliverables completed until a certain point in your project timeline.
Financial and budget metrics include measuring the total budget vs. actual spending, cost variance, ROI, and financial performance so that stakeholders can keep an eye on the budget in a one-page view on the dashboard and make decisions regarding resource allocation.
Your project managers should be able to view and manage the project portfolio dashboard on their web browser to monitor the progress remotely across devices. This is especially critical when you have distributed teams.
Before setting up your project portfolio dashboard, you need to understand why you are doing so and identify who will be using it. Then, set up the PPM dashboard to align with the needs, metrics, and requirements your stakeholders will need to track.
For instance, your dashboard aims to give senior management a high-level overview of your project portfolio and how related projects progress. This means your dashboard objectives will include information on the number of active projects, overall progress, key performance indicators, and potential risks.
Gather critical project management data from the tools you use to manage your projects and track and analyze what’s working. Consider including data from your project management tools, databases, spreadsheets, and other third-party business sources the relevant teams use.
Next, you need to decide which metrics and KPIs should be tracked—that align with your business, department, or project objectives and allow you to make strategic decisions regarding the project, business operations, and processes.
Pro tip💡: Selecting the key metrics and performance indicators should be a team activity.
Start by brainstorming on ClickUp Whiteboards, collecting the team’s response with ClickUp Forms, and communicating with the team using ClickUp Chat View without breaking a sweat.
A project portfolio management tool is a centralized system where you can store all the information related to your project portfolio. You can use it to create project plans, document necessary information, manage schedules, assign tasks to team members, and track progress.
For instance, ClickUp’s Project Management Software offers several comprehensive features that can help you assign tasks, view progress, track key metrics, visualize your project information, gain complete visibility into multiple projects with automated real-time reports, and manage your resources optimally—over a single platform.

With all the information you have collected, organize the dashboard into different sections and use charts and visualizations to create different portfolio dashboards.
Creating a comprehensive dashboard is no easy task if you’re short on time or experience.
You can use a project portfolio dashboard template as a starting point. For example, ClickUp’s Project Management Portfolio Template is a plug-and-play tool to ensure projects align across different departments while you monitor their health and progress.
Here are some interesting functionalities of ClickUp’s project portfolio dashboard:
You will need to run a few preliminary tests to ensure your dashboard works as you intended and gather your team’s and stakeholders’ feedback and approval to make necessary adjustments.
Now, you’re all set to deploy your dashboard.
Take everyone involved in the project through your dashboard and what it entails. Provide proper training so that the team knows how to use these dashboards. Ensure these dashboards are regularly updated and stay relevant. You can even make periodic changes to accommodate changing business requirements.
A precise and well-structured dashboard can help you seamlessly manage all of the projects you are working on.
ClickUp takes this one step further and allows you to leverage its features, such as task and resource management, time tracking, KPI tracking, and customizable templates to streamline your project management.
As a project portfolio and project management software, the best part is that ClickUp automates several repetitive tasks, such as task and workload management, progress tracking and reporting, scheduling alerts in case of delays, and being accessible across devices for remote teams.
If you want to drive successful outcomes, regardless of your project complexity, start building interactive project portfolio dashboards by signing up on ClickUp for free.
A project portfolio dashboard is a visual tool for tracking the progress of all the projects you manage. It gives insights into key metrics, performance indicators, and project status—critical to assessing the project’s overall health and ensuring it aligns with your business objectives.
| Portfolio | Dashboard | |
| Definition | A portfolio is a collection of all the different projects that you manage. Instead of managing various projects individually, businesses tend to group related projects. | Conversely, a dashboard is a visual representation of how the different projects in your portfolio are progressing. It has key metrics, milestones, deliverables, resource allocation, and task dependencies. |
| Used to | Optimize resource allocation and prioritize initiatives. | Evaluate how projects are connected and identify how to manage resources without causing a shortage. |
A portfolio includes related projects critical to achieving an organization’s overarching goals. Each project in the portfolio has scope, deliverables, milestones, timelines, and documentation such as plans, schedules, guidelines, and status reports.

© 2026 ClickUp

There’s an easier way. Try a free AI Agent in ClickUp that actually does the work for you—set up in minutes, save hours every week.