Sorry, there were no results found for “”
Sorry, there were no results found for “”
Sorry, there were no results found for “”
Meta’s Threads launched in July 2023 and reached 100 million signups in five days, making it the fastest-growing consumer app at the time. But the launch number hid what came next. By July 31, daily active users had fallen by about 82% from their peak, from 44 million to fewer than 8 million, while average time spent dropped from 19 minutes to 2.6 minutes.
For product OKRs, that gap matters. A KR built around signups could have turned green within days, while actual engagement was collapsing underneath it. The metric was accurate. It counted arrivals and said nothing about whether anyone stayed.
That same problem surfaces in product teams every quarter. A feature ships, a signup target is hit, or a roadmap milestone closes while adoption, retention, or quality stays flat. Strong product OKRs track the change that should follow the work and stay visible long enough to catch the gap.
Product OKRs pair one qualitative objective (the change you want) with two to four measurable key results (the evidence it happened). The fastest test of a KR: if it could hit 100% on launch day, before users do anything meaningful, it’s measuring output, not outcome. Strong KRs track adoption, retention, quality, or conversion against a named baseline and target, with one accountable owner each. This guide walks through a six-step process for writing them, 12 copy-ready examples across activation, retention, expansion, quality, and discovery, and the review rhythm that keeps them honest after kickoff.
Product OKRs (Objectives and Key Results) are a goal-setting framework that product teams use to connect their work to measurable outcomes beyond just output (features shipped, tickets closed).
Here’s how they’re structured:
There is also a third component: Initiatives. They are the work you bet will move those results. Initiatives can live on your product roadmap, but they shouldn’t stand in for your measures of success.
Product OKRs usually track adoption, retention, engagement, conversion, reliability, or customer satisfaction. Company OKRs, on the other hand, sit a level above and cover growth, profit, or new markets. The boundary is soft, though. A product team can own a revenue OKR when its product directly drives that number.
Did You Know? OKRs are older than any product management tool you use. Andy Grove built the framework at Intel in the 1970s, building on Peter Drucker’s Management by Objectives. John Doerr picked it up there and brought it to Google’s founders in 1999.
The easiest way to separate the three is by the role each one plays. KPIs show how the product is performing. OKRs define the change the team wants to make. The roadmap organizes the work intended to support that change.
| Artifact | What it tells you | Typical horizon | Example |
|---|---|---|---|
| Product OKR | What outcome the team wants to improve | Usually quarterly | Raise activation from 34% to 50% |
| KPI | How the product is performing over time | Continuous | Activation rate, churn, weekly active users |
| Product roadmap | Which initiatives the team plans to pursue | Rolling | Onboarding redesign, guided setup, activation experiment |
The same metric can appear in more than one place. Churn, for example, may sit quietly on a KPI dashboard for months. If it rises enough to demand action, the team might turn it into a quarterly KR, such as reducing churn from 7% to 5%.
That decision then shapes the roadmap. The team might prioritize a cancellation-flow study, fix a weak part of the product, or test a re-engagement campaign. Those initiatives can change as the team learns more, while the outcome stays fixed.
This is where durable OKRs matter. A good product OKR gives the team room to adjust the agile roadmap without rewriting the goal whenever an experiment fails or priorities shift.
Also Read: 100+ KPI Examples
Product strategy is the set of choices about who the product is for, what problem it solves, and why anyone would pick it over the alternatives. A product OKR is one step toward executing that strategy in a single quarter. Strategy sets the direction and holds for a year or more. The OKR states what should change next.
Roman Pichler, who writes and teaches on product strategy, puts strategy first of the three. His argument is that strategy is the decision-making framework that tells you which objectives are even worth pursuing. Without it, you have no basis for choosing between two credible objectives, so the loudest stakeholder usually wins.
That gives you a filter. When a senior stakeholder hands you an objective, check it against the strategy before you accept it. Pichler writes:
Don’t blindly accept objectives put forward by senior stakeholders.
If the objective doesn’t move the product toward the users, problems, or business goals your strategy names, it belongs to someone else’s plan.
The reverse holds too. A quarter where every KR turns green while the strategy stops working means you measured the wrong outcome.
Product OKRs usually fail for four reasons, all of which are baked in during planning week: a feature written as the objective, watermelon status reporting, too many objectives at once, and KRs with no named owner.
The biggest OKR mistake may happen after the OKR is written.
Teams spend days agreeing on objectives, debating targets, and getting leadership approval. Once the quarter starts, attention shifts back to sprint plans, releases, and whatever becomes urgent that week.
That loss of clarity is a broader workplace problem, too. Gallup found that only 46% of U.S. employees clearly know what’s expected of them at work.
OKR theater starts when the framework stays visible but stops guiding decisions. The objective remains in the tracker, yet the roadmap changes around it. Quarter-end arrives, and the retro is the first time anyone reads the KRs aloud.
The fix is structural, not motivational: Step 6 below sets the review rules, and the tracking section shows what the weekly check looks like.
Once the objective is clear, test each KR by what it measures:
For product OKRs, outcome KRs are usually the strongest because they show whether the work changed anything meaningful. But an outcome metric only works when the team can measure it well. A new product, an early experiment, or a poorly instrumented workflow may not have enough data yet.
In those cases, use the strongest measure you can defend. A meaningful proxy can work for the quarter, provided the team knows what it represents and what it leaves unanswered.
Here’s how that looks in practice:
| Weak KR | Why it falls short | Stronger KR |
|---|---|---|
| Launch the new onboarding flow | Measures delivery, not impact | Raise day-7 activation from 34% to 50% |
| Run 20 customer interviews | Counts activity, not learning | Validate or reject 3 of the 5 riskiest roadmap assumptions |
| Improve app performance | Has no baseline or target | Cut p95 load time from 4.2s to under 2s by quarter end |
| Increase engagement | Leaves “engagement” undefined | Raise weekly active teams using 3+ core features from 22% to 35% |
A common mid-quarter problem is discovering that a KR can’t be measured because the analytics event was never set up. Add the missing instrumentation, use a temporary proxy if needed, and document why the measurement changed.
To set product OKRs, start with the company goal and identify the product outcome your team can influence. Then define the KRs, test whether the targets hold up, connect initiatives to them, and decide how the team will review progress once the quarter begins.
We’ll use an example: a PM at a B2B invoicing SaaS whose company objective is to become the default billing tool for small agencies.
Start by asking: What change in the product or in user behavior would materially support this organizational goal?
Suppose the invoicing team’s internal data shows that agencies that send their first invoice within seven days retain at a higher rate. That gives the team a plausible product lever: help more new customers reach that milestone.
The logic becomes:
Become the default billing tool for small agencies → More agencies reach value during their first week → Improve first-week activation.
This step also helps define what the product team should own. A company goal like “increase annual revenue by 30%” may depend on pricing, sales, acquisition, expansion, and the product itself. The product OKR should focus on the part of that system that the team can materially influence.
If you can’t explain that connection in a sentence or two, the OKR may be too far removed from the company priority.
Turn that product focus into a qualitative objective.
For our invoicing team:
Objective: Help new agencies reach their first billing milestone quickly.
This gives the team direction without prescribing how to get there. “Redesign onboarding,” by comparison, already assumes the solution. “Improve onboarding” swings too far the other way because it doesn’t make clear what improvement means.
Before keeping an objective, check three things:
That final test matters for durable OKRs. The objective should remain useful even when the first solution doesn’t work.
Now decide what evidence would convince the team that the objective is working.
For the invoicing SaaS, some KRs might be:
Each KR, in this case, has a baseline, target, and defined population.
A set of KRs should give you a fuller picture of whether the objective is working. In this example, one KR tracks activation, another tracks onboarding friction, and a third tracks retention. If all three KRs are slight variations of activation, you may miss side effects or weak spots elsewhere in the experience.
Keep the rest of your product metrics on the KPI dashboard. Only promote the few that directly define success for this objective into KRs.
A KR can look precise and still be weak. Numbers create confidence, but they don’t guarantee that the metric is useful.
Run each KR through these checks:
| Check | What to ask |
|---|---|
| Baseline | Do we know where this metric stands today? |
| Target | Would reaching this number represent meaningful progress? |
| Measurement | Can we calculate it consistently during the quarter? |
| Influence | Can this team materially affect the result? |
| Trade-off | Could chasing this metric harm another part of the product? |
The trade-off check deserves attention. Imagine the invoicing team cuts time-to-first-invoice by removing several setup steps. Activation improves, but billing errors rise. The team has technically moved one metric while worsening the customer experience.
Guardrail metrics can catch that. If the KR rewards speed, for example, keep an eye on error rates, support volume, or another measure that could deteriorate as a side effect.
And check the target itself. A target that the team expects to hit with its current trajectory may tell you little about what needs to change. At the other extreme, a number pulled from ambition alone gives the team no credible basis for planning. Use historical movement, available capacity, user data, and the size of the opportunity to make the target defensible.
Quick Resource: Need a clearer view of the customer experience? Map the full journey before you lock your KRs. Use our free Customer Journey Mapping Tool to spot friction, handoffs, and weak points that your primary metric may miss.
Once you know the outcome and how you’ll measure it, decide which bets could move the numbers.
For the invoicing team, the roadmap might include:
Make the expected connection explicit. Which KR should each initiative affect, and what would you expect to see if the bet works?
Suppose the guided walkthrough launches in week three. By week six, usage of the walkthrough is high, yet first-week activation is still flat. That tells the team something important: people are using the feature, but it isn’t producing the intended outcome.
The team can now revise the experience, test a different intervention, or stop investing in that idea. The KR continues to provide direction while the roadmap changes underneath it.
The OKR now needs an operating rhythm.
Before kickoff, decide:
A lightweight cadence could include a short weekly KR check and a deeper monthly review of the initiatives behind it.
The weekly conversation doesn’t need another status presentation. Look at the current number, its direction, and any evidence that changes the team’s confidence. Then decide whether the current work still makes sense.
At quarter-end, you can add formal scoring if it helps. Google, for example, grades OKRs on a 0.0–1.0 scale, with individual KRs contributing to the overall objective score. Your team can use another system. What matters more is consistency.
Product OKRs should match the problem the team is trying to solve. An activation team needs different evidence from a retention, reliability, discovery, or expansion team. The examples below show what a strong OKR can look like, why the KRs fit the problem, and how to adapt the structure using your own baselines and targets. We’ll also cover real-world examples where it fits, so you can see some in action.
An activation OKR helps when users sign up, but too few reach the behavior that signals early product value. That behavior will vary by product. For an invoicing app, it might be sending the first invoice. For an analytics platform, it could be connecting a data source and viewing the first useful report.
Start by defining that activation event. Then measure how many users reach it, how quickly they get there, and whether that early success carries into continued use.
Illustrative example
Suppose a B2B invoicing platform finds that sending the first invoice is its clearest activation milestone.
Objective: Help new agencies reach value during their first week.
Key Results:
These KRs cover different parts of the activation journey. One tracks how many users reach the milestone, another measures how quickly they get there, and the third checks whether activated users continue using the product.
Ready-to-use template for activation OKRs
Objective: Help [user segment] reach [meaningful product value] sooner.
What this looks like in practice: Blip, the company behind Brazil’s BLiP chatbot platform, defined activation as publishing and testing a user’s first chatbot. Their baseline activation rate was 28.45%, with most drop-off at the publish step (55% abandoned there). After redesigning the guided onboarding flow, activation rose to 63.74%, a 124% increase, and time to value improved by 9.7x. The structure mirrors what we discussed: one KR on completion rate, one on speed-to-value.
A feature adoption OKR fits when a capability has shipped, but usage is still shallow or inconsistent. The goal is to understand whether eligible users are adopting the feature, returning to it, and getting enough value from it to make it a part of their workflow.
That means looking beyond launch-day clicks. A feature can attract plenty of first-time use and still fail to stick.
Illustrative example
Suppose a project management platform launches a new automation builder, but only a small share of active teams use it more than once.
Objective: Make workflow automation part of how teams manage recurring work.
Key Results:
Ready-to-use template for feature adoption OKRs
Objective: Make [feature/capability] a regular part of how [user segment] completes [job or workflow].
What this looks like in practice: GitHub ran a randomized trial with Accenture to test one thing. Would Copilot become a daily habit, or just one more installed extension? Adoption came quickly: 81% of developers installed the IDE extension the same day they received a license, and 96% accepted a suggestion that day. Repeat use held up too, with 67% using it at least five days a week. But the strongest signal came downstream, where pull request merge rate rose by 15% and successful builds rose by 84%.
A self-serve activation OKR works when users can sign up on their own but still need support, onboarding calls, or manual help to reach value. The aim is to make the core setup path clear enough that users can complete it independently and still reach the right activation milestone.
That means you need more than a lower support-ticket count. Fewer tickets could also mean users gave up before asking for help.
Illustrative example
Suppose a customer support platform offers self-serve onboarding, but many new accounts contact support before they finish setup.
Objective: Help new teams complete setup and reach value on their own.
Key Results:
Together, these KRs check whether users can finish setup independently, reach the behavior that signals value, and do both with less support.
Ready-to-use template for activation journey OKRs
Objective: Help [user segment] complete [setup or activation journey] independently.
An expansion OKR fits when customers already get value from the core product but haven’t adopted other useful workflows or products in the suite. The goal is to deepen product usage to create more value for the account and support commercial growth later.
A strong expansion OKR should therefore look at behavior before revenue alone. You want to know whether customers discover the next use case, adopt it, and continue using it.
Illustrative example
Suppose a marketing platform has strong adoption of its email product, but few existing customers use its automation tools.
Objective: Help existing customers get value from a second core workflow.
Key Results:
Ready-to-use template for expansion OKRs
Objective: Help [existing customer segment] get more value from [second workflow, feature, or product].
What this looks like in practice: HubSpot started as a marketing platform. Most early customers used only that one hub. Over time, the company added Sales Hub and Service Hub, making cross-adoption its main growth lever. The payoff showed up in retention. Net revenue retention rose from 88% at IPO to a peak of 115% during the years when multi-hub growth was fastest.
Make sure you track how many accounts adopt a second workflow, check whether they continue using it, and monitor how that affects expansion revenue.
A trial conversion OKR fits when people enter the product, but too few reach the experiences that make a paid plan worth choosing. The team needs to identify the behaviors that separate stronger trial users from the rest, then help more users reach those points before the trial ends.
Illustrative example
Suppose a 14-day collaborative reporting product notices that the users who end up paying after a trial do two key things during their trial: they connect a real data source (like Google Sheets or a database) and they invite a teammate to collaborate on a report.
Objective: Help trial teams experience the value of collaborative reporting before the trial ends.
Key Results:
Ready-to-use template for trial conversion OKRs
Objective: Help [trial user segment] reach enough value to make a confident purchase decision.
A retention OKR fits when users reach early value but fade soon after. The team needs to spot what retained users keep doing, then measure whether more new users pick up those same habits.
Illustrative example
Say a product team finds that many new workspaces finish setup but go quiet within a month. Cohort data shows that the ones that stick assign tasks, post updates, and loop in teammates during their first few weeks.
Objective: Help newly activated teams build a lasting collaboration habit.
Key Results:
These KRs split the outcome from the habits behind it. The first shows whether teams stay. The other two show whether the team is working together often enough to explain that staying.
Ready-to-use template for retention OKRs
Objective: Help [activated user segment] build a lasting habit around [core product value].
What this looks like in practice: Duolingo built its growth model around how learners move between activity states. The company keeps an eye on whether users stay active, drift away, or come back. This helps the growth team understand the habits that drive or hinder retention among Daily Active Users (DAU). In Q2 2024, the company reported that more than 20% of its daily active users had streaks longer than one year.
An engagement OKR fits when users keep coming back, but only use a narrow slice of the product. The goal is to measure whether they complete deeper workflows that reflect real product value.
Illustrative example
Say a project management tool has healthy weekly use, but most teams only create and close one-off tasks.
Objective: Help active teams manage more complex work in the product.
Key Results:
These KRs focus on depth of use. They show whether teams are moving past basic activity and using the product for more involved work.
Ready-to-use template for engagement depth OKRs
Objective: Help [active user segment] get deeper value from [core workflow].
A product quality OKR fits when reliability or speed starts getting in the way of the work that users came to do. The KR should name the affected workflow, the technical problem, and the user impact.
Illustrative example
For example, an analytics platform slows down for large customers once dashboards contain more than 100,000 records.
Objective: Make large dashboards reliable enough for daily reporting.
Key Results:
Ready-to-use template for product quality OKRs
Objective: Make [critical workflow] more reliable for [affected user segment].
What this looks like in practice: Pigment, a growing planning platform, ran into slow bug-fix cycles as its engineering team scaled. After moving bug tickets into ClickUp, cycle time dropped by 83%. Each bug now sat in a visible workflow stage, which made it easy to spot where tickets were stalling. The lesson applies broadly to quality KRs: a performance gain means more when you can trace it to a workflow step that users experience directly.
A bug-reduction OKR fits when defects pile up faster than the team can fix them, especially when serious issues keep reaching customers. The goal should cover how fast you recover and whether fewer bugs escape in the first place.
Illustrative example
Say a SaaS platform has grown fast, but bugs filed by customers now sit open for over a week. Critical ones keep coming back after releases.
Objective: Make customer-facing defects rarer and faster to resolve.
Key Results:
Ready-to-use template for quality OKRs
Objective: Make [critical product area] more dependable for [affected users].
One thing to watch: Closing 500 old bugs can make a dashboard look healthy while customers keep hitting fresh ones. A stronger product OKR tracks whether serious issues get resolved faster, escape less often, and stay fixed.
A launch OKR fits when success depends on more than shipping on time. The team needs to know whether the right audience discovered the release, tried it, and moved far enough into the product to show interest.
Illustrative example
Suppose a B2B analytics platform launches a forecasting feature for finance teams. The feature is available to 2,000 eligible accounts, but the team cares more about adoption among active finance users than broad launch traffic.
Objective: Help finance teams adopt forecasting as part of monthly planning.
Key Results:
Ready-to-use template for product launch OKRs
Objective: Help [target segment] adopt [new capability] for [specific job].
A positioning OKR fits when prospects understand the product differently from how the team wants it to be understood. You may see this in low conversion among a target segment, repeated comparisons with the wrong competitors, or sales calls spent explaining what the product actually does.
Illustrative example
Suppose a B2B workflow platform wants to sell to operations leaders, but win-loss interviews show that prospects still see it mainly as a simple task manager.
Objective: Make the product’s operations use case clear to high-fit buyers.
Key Results:
Ready-to-use template for positioning OKRs
Objective: Make [product or capability] clearly understood as [desired position] by [target segment].
What this looks like in practice: Mailchimp spent years being known as an email tool. By 2019, it had roughly $700 million in revenue and 11 million active customers, but buyers still saw it as a way to send newsletters. The product already offered landing pages, ads, and automation. The problem was that nobody knew. That same year, the company launched a full repositioning as an all-in-one marketing platform for small businesses. Revenue hit $1 billion soon after, and Intuit acquired the company in 2021 for about $12 billion. The capability was already there. What changed was how buyers understood it.
A discovery OKR fits when the team has a strong idea but weak evidence. The goal is to stress-test the riskiest bets and reach a clear call on what deserves real investment.
This is a learning OKR. Unlike an activation or retention OKR, the team may not yet have a meaningful behavioral metric to move. In that case, the KRs should define what evidence must exist and what decision that evidence should enable.
Illustrative example
Say a B2B finance platform is weighing an automated cash flow forecast feature. Before locking in a quarter of engineering time, the team needs to learn three things: do finance managers actually struggle with this, would they trust an automated output, and what decisions would they use it for.
Objective: Build enough evidence to decide whether automated cash flow forecasting deserves a product investment.
Key Results:
These KRs measure what the team learns and what it decides based on that evidence. Running 20 interviews only counts as activity. You can talk to 20 people and still have no answer to the core question.
Ready-to-use template for product discovery OKRs
Objective: Reduce uncertainty around [product opportunity] enough to make a confident investment decision.
Track product OKRs through a consistent review rhythm that keeps the KR, work, and latest evidence in view. Weekly checks help teams catch drift early; deeper reviews show whether the current initiatives are still worth pursuing.
Check the current value, recent trend, and confidence in the target. Keep the conversation focused on what changed in the metric. A KR review shouldn’t become another sprint status meeting.
For a fuller cadence, see our guide on how to track OKRs.
Track the result and the work on separate lines. Have the KR owner report the number and the initiative lead report delivery. If the two reports diverge, that’s the agenda for the deeper monthly review.
Some results, like retention or expansion revenue, take weeks to move. Pick a credible leading signal to judge direction early. Make sure that the signal has a documented link to the final outcome.
If an initiative has been live long enough to judge and the KR stays flat, revisit the bet. That could mean tweaking the approach, trying something new, or killing the initiative. The KR stays the decision anchor either way.
Baselines can be wrong, tracking can break, and market conditions can shift. If a KR needs to change, record what changed, why, and who agreed. That keeps the history clean and makes the final review more useful.
Product OKRs drift when the metric lives in one place and the work meant to move it lives somewhere else. A team sets a retention target in a spreadsheet, tracks sprint work on a board, and reviews progress in a slide deck. By week three, nobody is sure which initiatives map to which KR. ClickUp closes that gap by consolidating KRs, roadmap items, sprint work, and reporting into a single workspace.
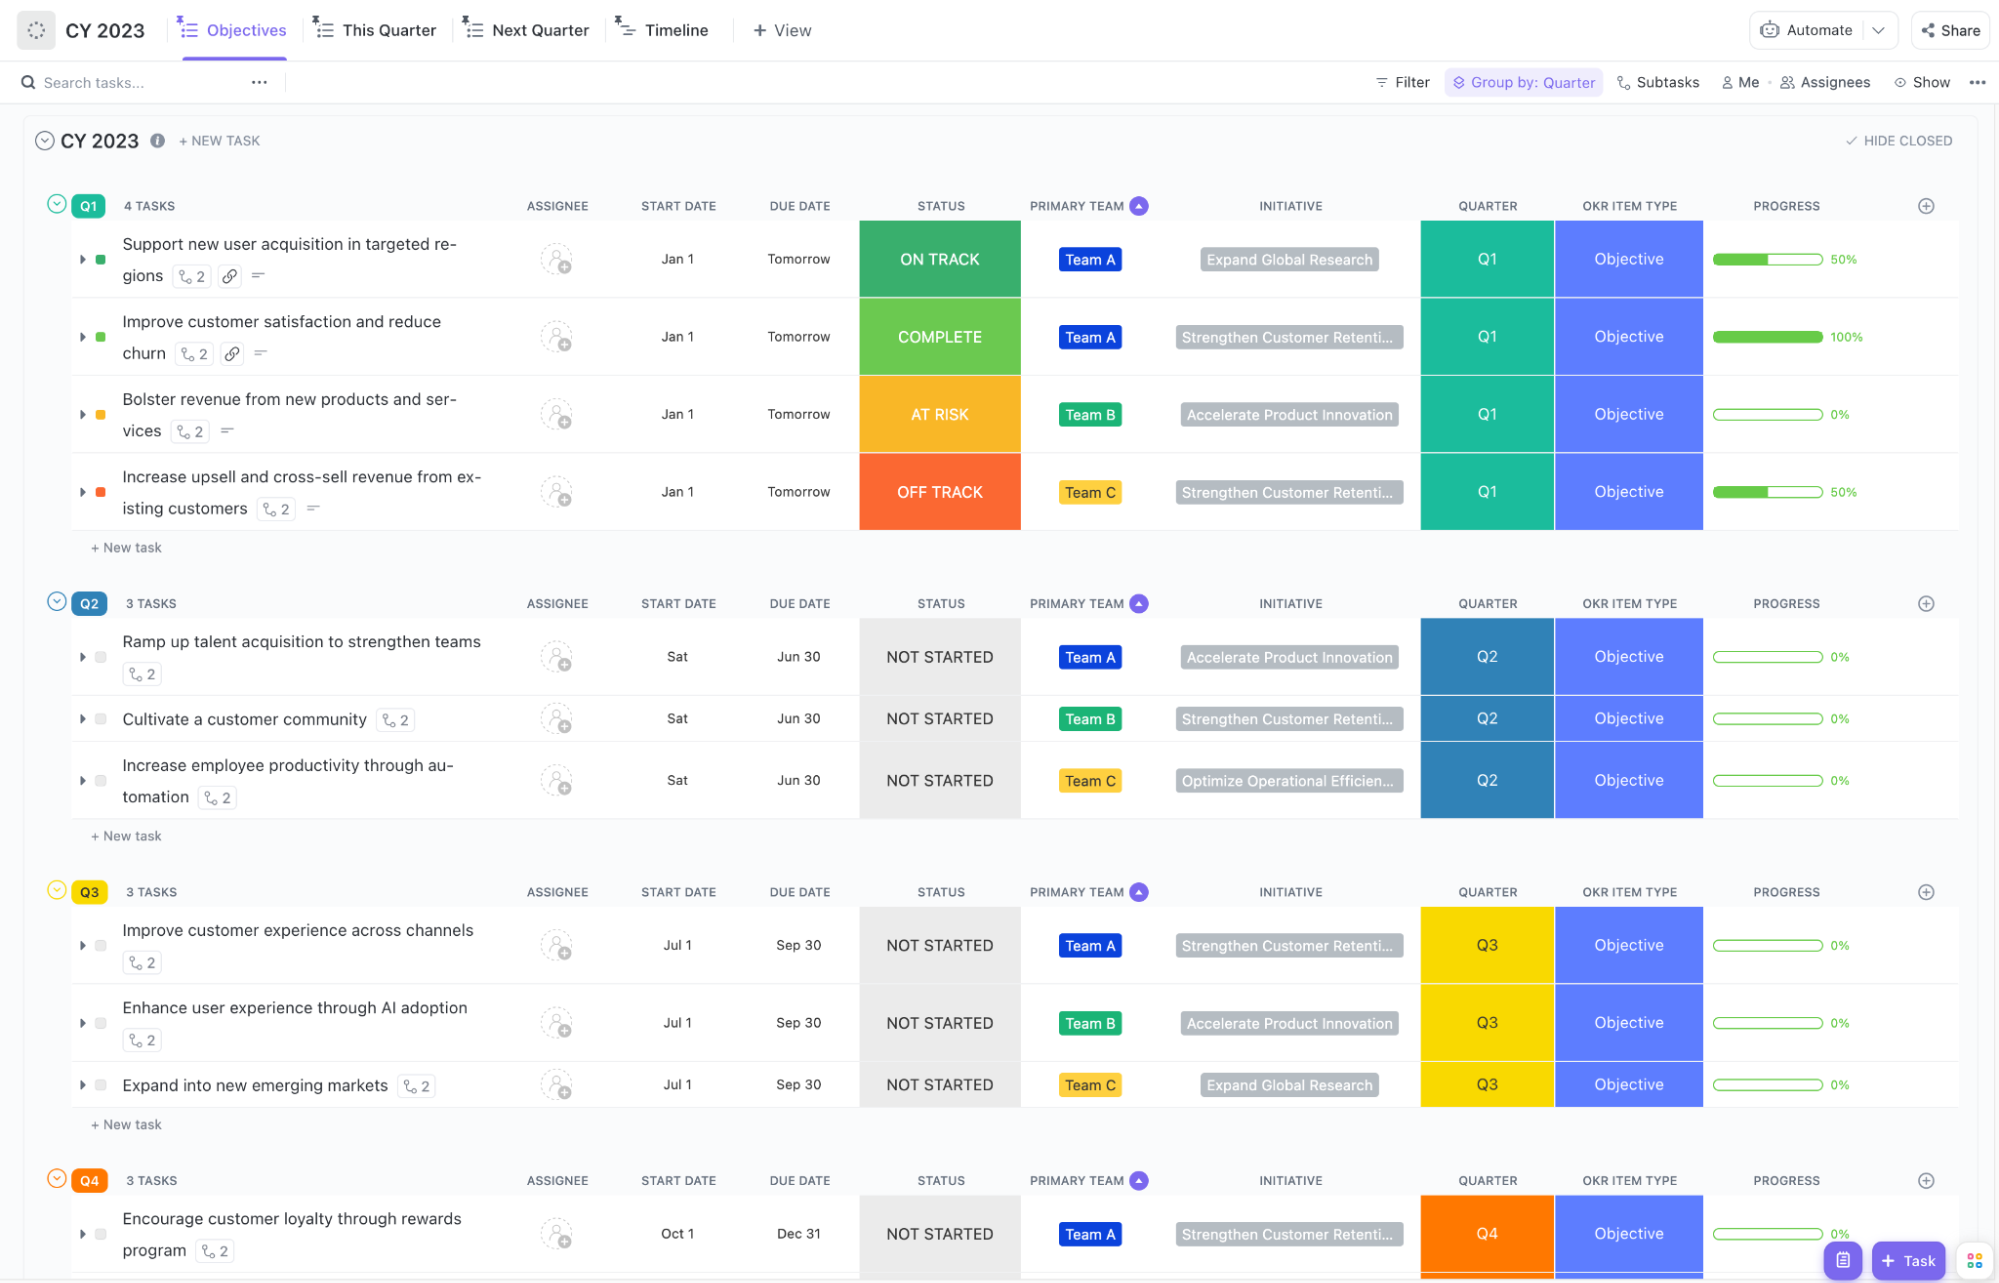
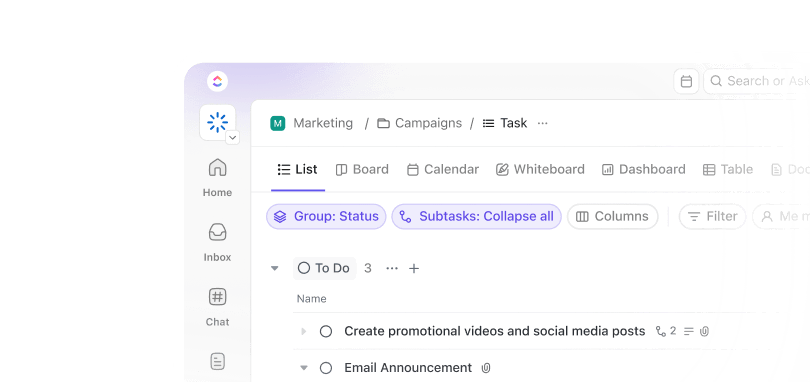
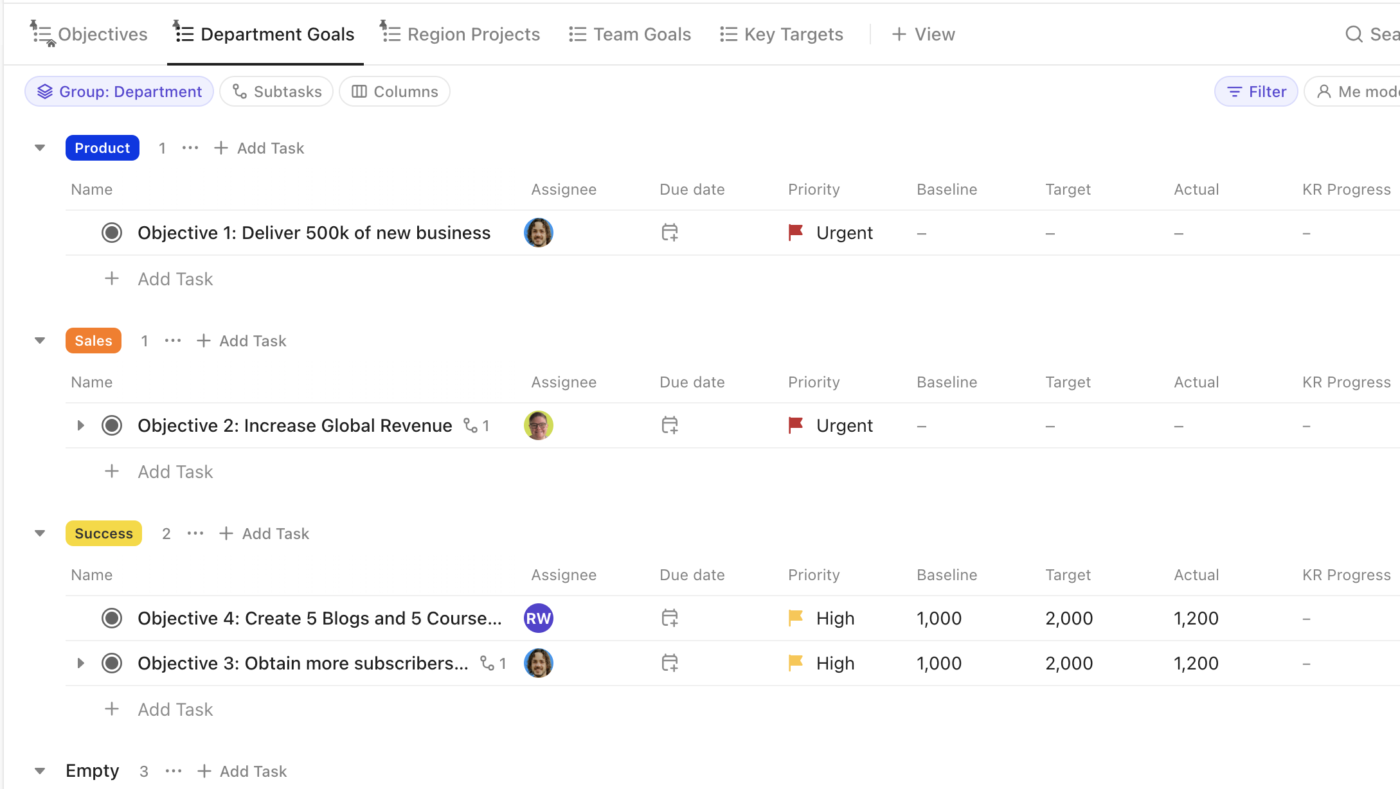
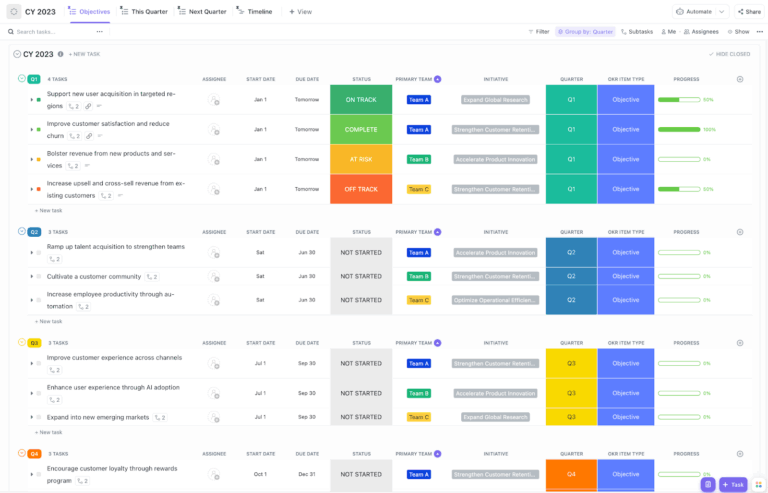
Structure your OKRs in one view with ClickUp List View. Group by owner, status, or a custom “Objective” field so the team can see at a glance every KR, its current value, and who’s driving it. Add filtered views for different slices, such as at-risk KRs and team-specific KRs.
Add essential details using ClickUp Custom Fields so you can track baseline, current value, target, owner, confidence level, and review date right on the work. You can also set a numerical target on a KR and let progress roll up automatically as the linked tasks close.
Connect KRs to the work. ClickUp Relationships link each KR task to the sprint work, roadmap items, or experiments that contribute to it. When a linked initiative ships but the KR stays flat, the gap is visible in one click.
Keep strategic context in Docs. Capture the reasoning and context behind your objectives in ClickUp Docs. Link it to your OKR List, so the team can reference the strategic context without cluttering the task structure.
Track progress with ClickUp Dashboards. Build an OKR view that shows the current KR value, owner, related initiatives, blockers, and weekly notes in one place. Add a chart or table card that shows trend, status, and related task data. It provides real-time context for the weekly review.
Automate the housekeeping. ClickUp Automations handle the small checks that slip once the quarter gets busy. Set rules to flag drops in confidence levels, assign follow-up tasks when a review date arrives, and trigger notifications when status changes.
For a ready-to-ship structure, use the ClickUp OKR Template. It gives teams a pre-built layout for objectives, KRs, owners, progress tracking, and review dates. Teams that want to move fast can start here and adapt the fields as they learn what their specific OKRs need.
ClickUp Brain further helps with the review itself. It reads across your workspace to summarize what changed since the last check, surface blocked work, and highlight where progress has stalled. The weekly review can start with what matters, and the team spends less time piecing the story together.
Best for: Product teams that want OKRs living alongside the work and the reporting layer.
Skip it if: You need a dedicated OKR platform built for company-wide cascading across dozens of teams, formal coaching workflows, and centralized goal governance. Purpose-built tools like Lattice, Perdoo, or Quantive go deeper into org-wide alignment ceremonies.
Prefer a visual walkthrough? Watch how to manage OKRs in ClickUp here:
Product OKRs prove their value once the quarter gets messy. Keep the objective clear, choose KRs you can measure with confidence, and review them often enough to catch drift before it compounds.
The strongest setup is simple: a small number of objectives, clear baselines, named owners, and a regular check on whether the current initiatives are moving the numbers. If the evidence changes, the work can change with it.
Keep the OKRs close to the work that drives them. That makes it easier to spot when a target needs review or when a weak bet should be replaced.
If you want a starting point, use ClickUp to connect your tasks and roadmap work behind each KR, and adjust the structure to fit your team. Explore ClickUp for free.
Leadership owns the company objective; the product team writes the product OKR, and each KR has a named owner. In Marty Cagan’s product operating model, leaders bring the problems and empowered teams choose the solutions, so a product OKR handed down with the initiatives already decided defeats the purpose. Shared ownership of a KR is the most common accountability failure: reviews happen, nobody is on the hook, and the drift surfaces too late to fix.
Committed, aspirational, and learning. Committed OKRs must be delivered in full, with resources adjusted to make that happen. Aspirational OKRs deliberately set the bar past what the team can execute in a quarter and carry forward until achieved. Learning OKRs aim at evidence, which is what a product discovery OKR usually is. Product teams tend to run one committed KR alongside one aspirational one, and problems start when both are scored the same way.
On stretch goals, 0.6 to 0.7 on Google’s 0.0-1.0 scale. Former Google SVP Laszlo Bock has explained that a score of 1.0 usually means the target was too easy, while 0.6-0.7 signals real ambition. Committed KRs are the exception; those are expected at 1.0. Score the KRs, then use them to judge the objective, and record why a KR was missed rather than only what it scored.
Keep them separate. Google’s own OKR guide states that “OKRs are not synonymous with performance evaluation” and treats a score as a summary of what someone worked on rather than a rating. The same guide puts the sweet spot at 0.6 to 0.7 on its 0.0-1.0 scale, so a well-set Key Result is built to fall short. Attach a bonus to that number, and owners start picking targets they know they can hit.
Quarterly OKRs are common because three months gives teams enough time to run several initiatives, observe results, and adjust course. But the right cycle depends on the metric. Activation can move within days or weeks, while retention, enterprise adoption, hardware, or infrastructure outcomes may need longer. Annual objectives can provide direction, while quarterly KRs define the expected progress in the current cycle.
Two to three objectives per quarter, each with two to four key results, so no more than 8-10 KRs total per team. John Doerr’s guidance in Measure What Matters caps it at 3-5 objectives with 3-5 KRs, and product teams should sit at the low end because each KR needs a weekly metric review. FranklinCovey research found that only 15% of employees can name their organization’s top goals, largely because there are too many to remember.

Sudarshan Somanathan
Max 29min read

Praburam Srinivasan
Max 22min read

Manasi Nair
Max 21min read

© 2026 ClickUp