


Still downloading templates?
There’s an easier way. Try a free AI Agent in ClickUp that actually does the work for you—set up in minutes, save hours every week.
Sorry, there were no results found for “”
Sorry, there were no results found for “”
Sorry, there were no results found for “”

Marketing dashboards aim to transform data into actionable insights. Yet, for many marketers, they remain a source of confusion rather than clarity.
This disconnect comes at a cost.
Data-driven companies are 23 times more likely to acquire customers, 6 times more likely to retain them, and 19 times more likely to be profitable.
Despite this potential, many marketers struggle to realize these benefits in practice.
The root of the problem often lies in how we build and use marketing reporting dashboards.
This guide bridges that gap. It explores how to construct a marketing analytics dashboard that drives strategic decision-making through powerful marketing KPIs.
Marketing dashboards are centralized, visual representations of your marketing data designed to provide real-time insights into performance across various channels and campaigns.
Unlike static reports, marketing dashboards offer dynamic, interactive interfaces that allow quick analysis and decision-making.
These dashboards consolidate data from multiple sources, offering a holistic view of your marketing ecosystem.
They transform raw data into visually compelling charts, graphs, and metrics, enabling you to:
By presenting complex data sets in an accessible format, these dashboards democratize data across an organization.
This accessibility fosters a data-driven culture, aligning marketing efforts more closely with overall business objectives.
Marketing dashboards, when implemented effectively, offer significant advantages that can transform your marketing operations. Here’s how they make a difference:
By providing a clear view of which campaigns and channels are delivering the best results, marketing dashboards enable you to allocate your budget and team efforts more effectively.
This data-driven approach to resource management can significantly boost your marketing productivity metrics.
📌 Example
Imagine you’re running multiple ad campaigns across social media, email, and PPC channels. With a marketing dashboard, you quickly spot that your Facebook ads have a higher engagement rate and better conversion cost than your PPC campaigns. Armed with this insight, you shift some of your budget and team focus from PPC to Facebook.
Real-time data visualization allows you to spot underperforming campaigns quickly. This agility means you can pivot strategies or reallocate resources before a significant percentage of your budget is wasted on ineffective initiatives.
Creating a KPI dashboard clearly communicates marketing’s impact on business objectives. This visibility is crucial for securing budget approvals and demonstrating marketing’s strategic value to C-suite executives.
Marketing dashboards provide a clear line of sight from tactical execution to strategic impact. This transparency justifies marketing spending. It also positions the marketing team as a strategic partner in driving business growth.
With comprehensive data at your fingertips, you can:
📌 Example
Your dashboard might show that email open rates are highest on Tuesday mornings, guiding your decision to schedule important announcements for this time slot.
Automated data aggregation and visualization significantly reduce the time spent on manual reporting. This efficiency allows your team to focus on analysis and strategy rather than on data compilation.
The effectiveness of your marketing dashboard hinges on the metrics you choose to include. While specific metrics may vary based on your business goals, here are some key areas to consider.
These high-level metrics provide a snapshot of your marketing activities’ overall impact on the business:
ROI clearly shows the financial return generated by marketing efforts, while CAC and CLV together illustrate the long-term value created by customer acquisition strategies.
The MQL to SQL conversion rate bridges the gap between marketing and sales, highlighting the quality of leads.
When tracking content marketing KPIs, focus on:
Analyzing these KPIs helps refine your content creation and distribution strategies. You can then confirm that resources are allocated to the most effective content types and channels.
Assess your online presence with these crucial indicators:
Understanding traffic sources helps refine channel strategies and allocate resources effectively across digital platforms. It can even help you improve website design, content, and user experience.
Gauge your social media performance through:
These metrics help understand brand perception and audience engagement across platforms, identifying which platforms work best for your brand and what content resonates with your audience.
Email marketing remains one of the most effective channels for direct customer communication. Optimize your email campaigns by tracking:
Focusing on these metrics helps you craft emails that not only support your business goals but also deliver real value to your audience.
For a more sophisticated analysis, consider including:
They provide nuanced insights into customer behavior and long-term marketing impact, enabling more precise strategy adjustments and budget allocation.
📌 Example
Imagine you’re leading marketing for a SaaS company launching a new feature. You’re running email campaigns, ads, and social posts. Here’s how these tools help:
Creating a powerful marketing dashboard is crucial for tracking performance, visualizing data, and making informed decisions.
Here’s a TL;DR guide to building an effective marketing dashboard:
ClickUp Dashboards offer the perfect solution to achieve this.

Part of ClickUp’s all-in-one project management platform, they can be customized to fit virtually every type of functional reporting—from monitoring budgets and expenses for your Accounts team to tracking granular campaign performance and the return on ad spend for the Marketing team.
Before ClickUp, communicating the status and performance of our global and regional marketing campaigns to our business units was far from optimal. With our new Dashboards, we’re saving time and our stakeholders have real-time access to the information they need, whenever they need it.
Let’s see step-by-step how you can use the Marketing Project Management Software by ClickUp to build custom marketing dashboards.

Once you have a ClickUp account, create a dedicated marketing Workspace in ClickUp.

Invite your team members and assign them roles based on their responsibilities. Set up ClickUp Folders for different marketing functions (e.g., Content Marketing, Social Media, PPC Campaigns, etc.)
Create ClickUp Lists for different types of campaigns under each folder.
Add ClickUp Tasks within each list that represent specific actions or deliverables, like “Send newsletter” or “Create Facebook ad.”

Use Custom Fields in ClickUp for each task to note and track important data, like budget, reach, engagement, or task status. You can assign numerical or dropdown values to track performance. These fields make it easier to generate reports and compare metrics across tasks.
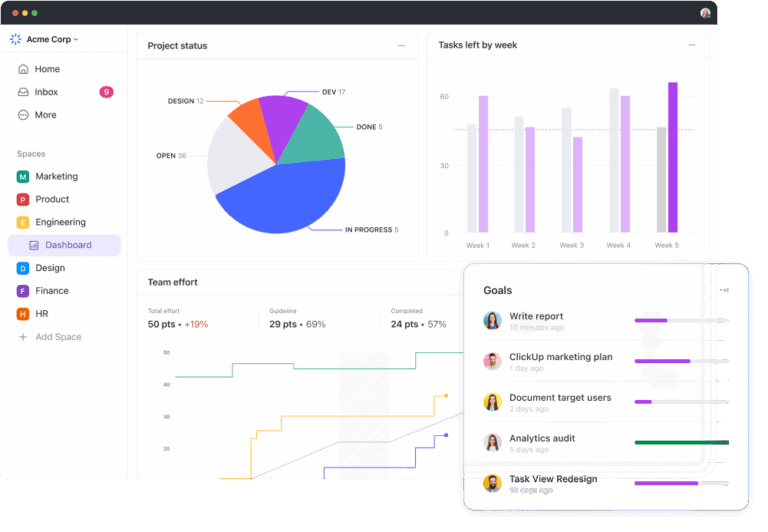
Now that your Workspace is set up, it’s time to start building the customizable dashboard.
Within ClickUp, your dashboard functions as the central hub for marketing operations.
Go to ClickUp’s Dashboard view and create a new dashboard for your marketing metrics.
Add customizable Cards to display your Custom Fields, tasks, and achievements in one view. Use charts to visualize campaign performance and track progress over time, and time-tracking cards to monitor productivity and ensure efficient resource allocation across your marketing initiatives.

Enable automatic updates to ensure your dashboard always reflects the latest information, providing real-time insights for quick decision-making and agile campaign adjustments
You can also set up ClickUp Goals to monitor progress toward specific marketing objectives. Whether it’s lead generation, conversion rates, or content production, you can visualize your team’s progress at a glance.

By centralizing these key metrics and tasks, your marketing team gains a comprehensive view of all ongoing efforts, fostering better coordination and strategic alignment.
The new, integrative dashboards are an amazing help! Now, I can drill down right into my tasks from the dashboard graph views. Very helpful!
Also Read: 10 Best AI Tools for B2B Marketing
If you think ClickUp’s dashboards are great but don’t capture every data point from all your analytics tools, don’t worry. With ClickUp’s 1000+ integrations, you can create a powerful analytics ecosystem that combines ClickUp’s project management capabilities with insights from your specialized marketing analytics tools.
This approach allows you to:
Here’s how key ClickUp Integrations can enhance your marketing intelligence:
HubSpot integration
HubSpot’s Integration with ClickUp enables you to blend two powerful data dashboards.

This integration allows you to:
Mailchimp integration
Boost your email marketing efforts by integrating Mailchimp with ClickUp:
Google Workspace integration
Enhance collaboration and document management using ClickUp’s Google Workspace Integration.

With this, you can:
Google Tasks integration
With the Google Tasks Integration with ClickUp, you can:
Zoom integration
Manage virtual meetings better using the Zoom Integration with ClickUp.

This enables you to:
Zapier integration
Automate workflows between ClickUp and thousands of other apps through Zapier’s Integration with ClickUp:
This centralized approach provides you with an improved and unified marketing ecosystem where information flows freely between tools.
Once you’ve set up your custom marketing dashboards in ClickUp, you’re well-positioned to monitor and analyze your marketing performance effectively.

ClickUp’s Dashboards, reporting features, and integrations provide a powerful ecosystem for marketing teams to track, visualize, and analyze their performance effectively.
Here’s how you can leverage these capabilities:
Effective marketing dashboards come in various forms, each designed to meet specific needs and objectives. Now that you have an idea of how to build one for yourself, here are some inspirational and powerful examples from across the industry to enhance them.
The Google Ads dashboard monitors and optimizes paid search campaigns, providing real-time data on ad performance, budget allocation, and ROI.
It offers actionable insights to refine targeting, improve ad quality, and maximize the effectiveness of your paid search marketing strategy.
Here are a few important metrics to include:
A Google Analytics dashboard provides insights into your website’s performance and user behavior. Key metrics to monitor are:

You can easily find Google Analytics report templates to help you track these metrics effectively. This dashboard is crucial for understanding how users interact with your website and identifying areas for improvement in user experience and conversion optimization.
The Hootsuite dashboard centralizes social media management across multiple platforms, streamlining content scheduling, engagement tracking, and audience insights.
It provides a comprehensive view of social performance, facilitating efficient team collaboration and strategic decision-making.

Important metrics to include are:
This dashboard helps you understand which platforms are most influential for your brand and what types of content resonate best with your audience.
The Mailchimp dashboard streamlines email marketing campaigns, offering intuitive design tools, audience segmentation, and automated workflows. It provides comprehensive analytics on campaign performance, enabling data-driven optimization of email strategies.

These are the key metrics to include:
A marketing report dashboard, as outlined in ClickUp’s Marketing Report Template, offers a broader view of your marketing efforts.
Its key features include:
A marketing timeline dashboard in the Marketing Timeline Template by ClickUp visually represents your marketing activities and their impact over time.
This dashboard typically includes:
This template helps ensure that your marketing strategy is consistent and that your team is working towards the same goals.
While marketing dashboards offer numerous benefits, they come with their own set of challenges. Understanding these hurdles is crucial for effective implementation and use of your dashboard. Here are the key challenges you might encounter:
Addressing these challenges requires a combination of technical solutions and organizational change management.
Invest in proper data governance processes, provide ongoing training for team members, and foster a data-driven culture to overcome these hurdles and realize the full potential of your marketing dashboards.
To maximize the impact of your marketing dashboards, consider implementing these best practices:
By implementing these best practices, you’ll ensure that your marketing dashboards remain valuable to drive meaningful results for your organization.
Throughout this blog, we’ve explored how marketing dashboards can significantly improve your decision-making process and strategy execution.
By visualizing key metrics, you gain clearer insights into your marketing performance and can more effectively demonstrate your team’s value.
Remember, the best dashboard is one that evolves with your needs. Start simple, focus on what matters most to your business, and refine as you go.
Want to step up your marketing efforts with intuitive dashboards?
Give ClickUp a try! It might just be the tool you’ve been looking for.

© 2026 ClickUp

There’s an easier way. Try a free AI Agent in ClickUp that actually does the work for you—set up in minutes, save hours every week.