Sorry, there were no results found for “”
Sorry, there were no results found for “”
Sorry, there were no results found for “”
A project isn’t quite the right fit, but the revenue is hard to turn down. If you’ve run an agency or worked inside one, you’ve watched this call get made more than once.
Wrong-fit work is the obvious leak. The less obvious leaks show up on projects that fit perfectly well. An extra revision goes unbilled. One late approval throws off next week’s schedule. Your team stays busy while margins get thinner.
It’s easy to dismiss these as edge cases, but the data says otherwise. In Ignition’s agency research, 78% of agencies said they rarely or only sometimes charge for out-of-scope work. And 57% estimated that scope creep costs them $1,000 to $5,000 every month.
Agency productivity may seem like a moving goalpost. But really it comes down to how much delivered work actually gets billed. This guide follows a project from the first proposal to the final payment and shows you where the leaks are.
A full calendar tells you the agency has work. Whether that work is profitable depends on five handoffs: sold, scoped, scheduled, delivered, and billed.
Track five numbers alongside them: utilization, realization, project margin, revenue per employee, and net margin. If projects keep missing margin, trace the loss back to the first point where the plan stopped matching the work.
That could be an underpriced sale, loose scope, overbooked capacity, uncharged revisions, or completed work that never made it onto the invoice. Your fix should address the handoff that broke first.
Marketing agency productivity measures how efficiently an agency turns paid capacity into profitable client work. That capacity includes billable hours, but also senior review, project management, revisions, coordination, and idle time that the agency still pays for. Looking only at output misses all of that.
A team can ship twice as many assets and still hurt project margin if the work needs extra senior hours or three rounds of free revisions. Likewise, hitting 90% utilization by working weekends doesn’t make the operation healthier. The team has put in overtime, which it will need to recover from, and that time comes out of future weeks or shows up as burnout.
Agency time also can’t be saved for later. An hour that goes unused this week can’t be sold next month. And a revision that wasn’t flagged as out of scope usually can’t be billed after the project delivery.
The better question, then, is how much of the capacity you paid for made it all the way to profitable, billable work?
Every project passes through five stages: sold, scoped, scheduled, delivered, and billed.
Together, they form a chain from the first proposal to the final invoice. They can help you find where a project lost money, but only when you treat them as handoffs.
A promise made during sales becomes an estimate during scoping. The estimate becomes a staffing plan. The staffing plan becomes the work your team delivers, and that work eventually becomes an invoice.
At every handoff, assumptions can shift. A client adds another stakeholder. Work priced for a mid-level strategist starts pulling in a senior lead. None of those changes would necessarily break the project. The problem starts when the work changes, but the price and scope stay the same.
To find where that happened, check each handoff separately.
| Link | Check this | Evidence to pull |
|---|---|---|
| Sold | Did the fee, timeline, and promised outcome make sense before delivery began? | Proposal, pricing model, discount history, expected margin |
| Scoped | Did the estimate account for revisions, dependencies, meetings, and senior review? | Scope of work, original estimate, change requests |
| Scheduled | Was the work assigned to people who actually had the time and skills available? | Capacity plan, workload, PTO, overlapping commitments |
| Delivered | Where did actual effort exceed what the project was priced to absorb? | Time logs, revision history, estimate vs. actual, role mix |
| Billed | Did the agency charge for everything it delivered and collect what it invoiced? | Write-offs, unbilled overage, discounts, outstanding invoices |
Say a campaign was sold for $20,000 on the assumption that it would take 120 hours, with two rounds of revisions. By closeout, the team had logged 155 hours. “The project ran over” tells you almost nothing. You need to look at what changed along the way.
Perhaps the scope never defined what counted as a revision. Or the team delivered the additional work without opening a change request, and finance wrote off the difference because the client never approved the overage. Those are very different problems, and they need different fixes.
The five handoffs show you where a project’s economics changed. Five metrics explain how much that change costs, and whether the same thing is happening across other projects.
They are billable utilization, realization, project margin, revenue per FTE, and net margin. Each one looks at the business from a different angle, and each one can mislead you when you read it alone.
| Metric | Formula | What it tells you | Watch out for | Benchmark |
| Billable utilization | Billable hours ÷ available hours × 100 | How much paid capacity reaches client work | Too low: excess capacity or weak pipeline. Too high: burnout and no room for delays | Most agencies target 70–89% (SparkToro) |
| Realization | Actual invoiced value ÷ standard billable value × 100 | How much of the value delivered becomes billable revenue | Write-offs, discounts, absorbed scope, and over-servicing | Track the trend over time |
| Project margin | (Project revenue − direct delivery cost) ÷ project revenue × 100 | Whether the engagement itself makes money | Clients or project types consistently falling below target | Average of 35% (Promethean Research) |
| Revenue per FTE | Annual revenue ÷ total FTEs | How much revenue the agency supports per employee | Headcount growing faster than revenue | Track the trend over time |
| Net margin | After-tax profit ÷ revenue × 100 | What remains after the whole business is paid for | Overhead consuming otherwise healthy delivery margins | Average of 13%; 19% for studios under 10 employees, 8% for agencies with 50+ (Promethean Research) |
Note: For more metrics beyond these five, see our breakdown of marketing agency KPIs.
Utilization tells you how much of the team’s time is spent on client work. Realization picks up later and asks how much of that work the agency actually bills. Read together, they catch a team that looks fully booked but is spending its hours on work the agency later writes off.
A quick way to read the two:
Start with the role. A delivery specialist spends more of the week on client work than a creative director, who also reviews projects, manages people, and helps win business.
In SparkToro’s agency survey, 39% of agencies that set utilization targets aimed for 70–79% for a typical mid-level team member. Another 35% aimed for 80–89%.
Calculate the target from the hours each person actually has available after PTO and holidays. For someone with 1,840 available hours, a 75% target comes to about 1,380 billable hours a year.
We cover the calculation in more detail in our guide to resource utilization metrics and methods.
Project margin tells you whether each engagement made money after paying for the people and contractors who delivered it.
A 35% project margin means that for every $100 a client pays, $35 is left after direct delivery costs. That $35 still has to cover everything else the agency pays for: sales, leadership, finance, software, office space, and the team’s non-billable time.
Promethean Research found that among the 59% of agencies that tracked it, the average project margin was 35%. Zooming out, the average after-tax net margin across agencies stood at 13%. So on a typical project, about 22 of every 35 cents goes to running the agency, and 13 cents is profit.
That gap is why project margin matters. Promethean also found that agencies without project-level tracking usually see the problem only when it shows up in the P&L, after the pricing, scope, or staffing decision has already happened.
To track it, run this checklist at project closeout. Write down which check caused the biggest drop in margin. Then update the estimate for the next similar project.
| Check | Compare | If it’s off, look at |
| Hours | Estimated hours vs. logged hours, by phase | Scoped or delivered |
| Role mix | Planned hours by role vs. actual hours by role (especially senior time) | Scheduled |
| Revisions | Revision rounds in the scope vs. rounds delivered | Scoped |
| Scope changes | Approved change requests vs. extra work done without one | Delivered or billed |
| External costs | Budgeted contractor and tool costs vs. actual | Sold or scoped |
| Billing | Work delivered vs. work invoiced, plus any write-offs | Billed |
Revenue per FTE is total annual revenue divided by the number of full-time employees. Say an agency with 20 FTEs brings in $3 million a year. Its revenue per FTE is $150,000. Each person’s salary, benefits, and share of overhead has to come out of that $150,000, and whatever is left over is profit.
The number is most useful as a trend. If headcount rises while revenue per FTE falls, the agency is adding people faster than it’s adding revenue. Check utilization, pricing, service mix, and how much senior time goes to lower-value work.
That pattern showed up across the industry last year. In Promethean Research’s 2026 report, revenue per full-time employee fell for the first time in years, which the researchers read as weaker efficiency across much of the market.
For media-heavy agencies, gross revenue can inflate the number. Client ad spend and other third-party costs pass through the books as revenue, but the agency doesn’t keep that money. Use Agency Gross Income (AGI) per FTE instead: remove the pass-through costs first, then divide what’s left by total FTEs.
Not automatically. Faster work only improves revenue per FTE if the agency keeps some of the time it saves, and clients are pushing the other way.
In AgencyAnalytics’ survey of 494 marketing agencies, 44% said clients now expect faster turnaround, and 30% said clients see agency services as costing less than a year ago, most likely because they assume AI should lower agency fees.
One agency owner on Reddit asked the question many are weighing: if AI can already do much of the work “faster and cheaper with similar quality,” should agencies pass those savings to clients, or keep them to protect margins?
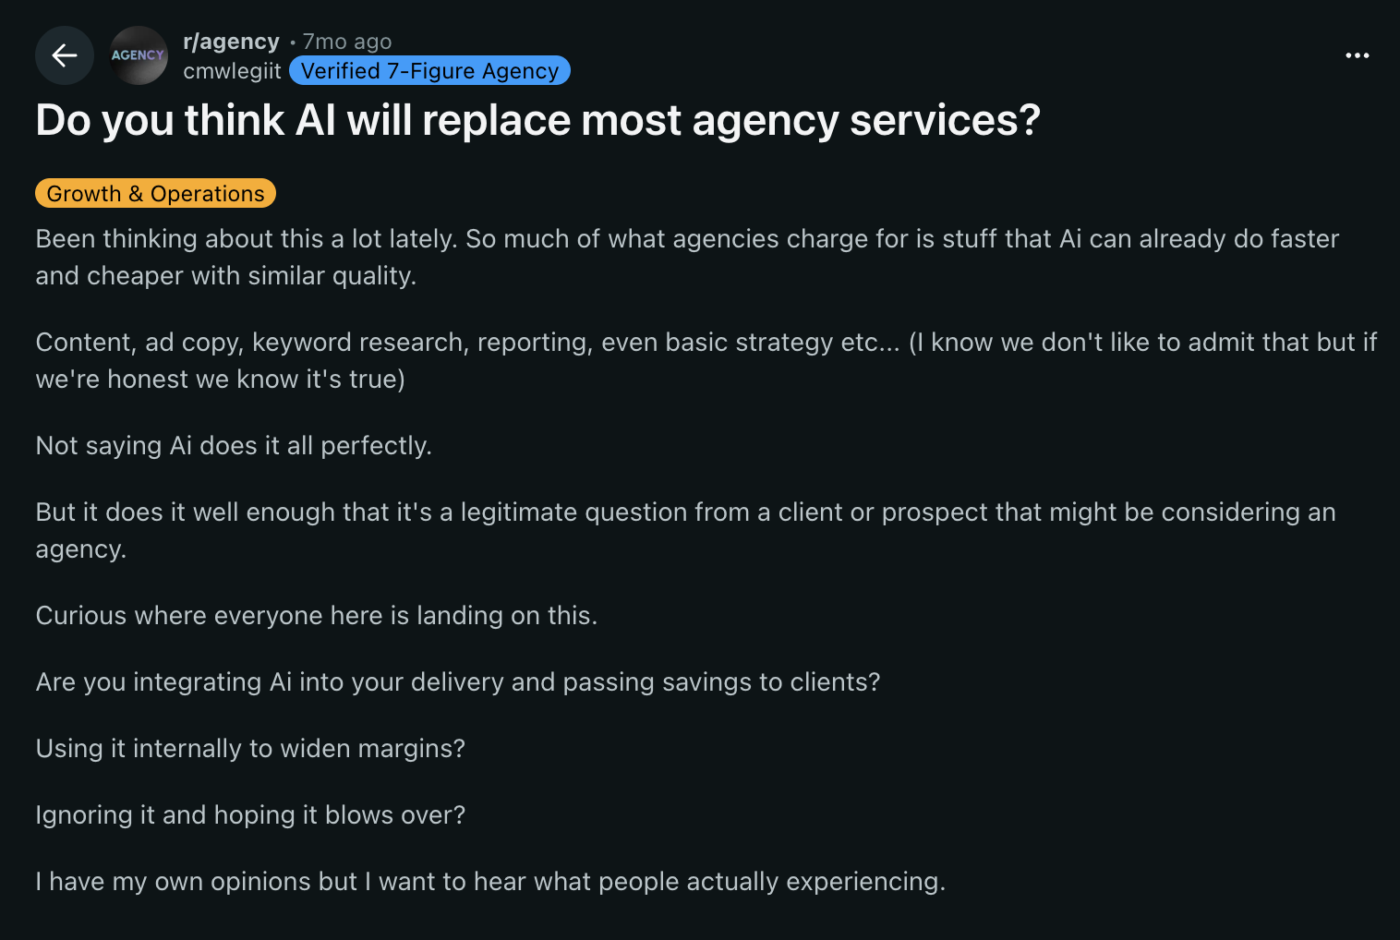
Neither answer works on its own. Pass the savings along, and the agency’s fee drops just as its effort does. Keep them without reinvesting in higher-value work, and clients eventually notice they’re paying the same rate for less hands-on time.
AI can remove the administrative drag around a decision. The gain only reaches the margin when the agency captures it through stronger pricing, less rework, or work the team couldn’t have taken on before.
The first four metrics measure time, billing, projects, and revenue per person. Net margin is the only one that includes your overhead.
That cost tends to rise as an agency grows. Imagine an agency that earns $3 million and spends $600,000 on overhead, so 20% of revenue goes to running the business. A year later, revenue is $3.5 million, and overhead is $875,000, or 25%. Project margins can look exactly the same, but the net margin drops by five points. Promethean Research saw the same pattern across the industry: studios with fewer than 10 employees averaged a 19% net margin in 2025, while agencies with 50 or more employees averaged 8%.
A rising overhead share doesn’t automatically mean you should cut costs. A new sales hire, a finance lead, or a new project management system may be a deliberate investment. Decide in advance how long revenue has to catch up. Net margin shows you whether it did.
Read the report: Revenue can grow while margins stay flat. Our latest report on agency profitability looks at how agencies are restructuring their operating models to close that gap.
The most effective way to improve a marketing agency’s productivity is to follow a project from the first proposal through delivery and billing, and fix each handoff along the way.
Before kickoff, record the fee, expected delivery cost, planned hours, contractor spend, and target margin. Then decide how far the margin can fall before the project needs a review.
To forecast the mid-project margin, add the cost of hours already logged to the estimated cost of the remaining work, and compare that total to the fee. If a project was priced to close at 35% and is now forecasting 30%, the team should revisit scope, staffing, timeline, or pricing before executing on the rest.
That threshold should reflect why the agency took on the project. It may accept a thinner margin to build a strategic account, enter a new market, or gain experience in a service it plans to sell again. Record the reason and how much margin the agency is prepared to give up.
That way, when your team reviews the forecast, it can tell a planned trade-off apart from a project that’s actually in trouble.
An estimating library is a running record of what past projects actually took, organized by type of work. It helps you build the next estimate using real numbers instead of guesses. And it can be as simple as one spreadsheet or table.
Each time a project closes, add the results from the closeout checklist in the project margin section. Include two more details: how long client approvals took, and the main reason for any large gap between the estimate and the actual.
Once you have three to five similar projects, look for patterns and update the next estimate. If 5 landing-page projects consistently need 18 design hours but the template assumes 12, change the template.
A sound estimate can still run late or over budget if the people needed to deliver it are already booked. Plan capacity before promising a deadline, while you can still change the scope or staffing.
Start with each person’s actual availability, not their 40-hour week.
In Rize’s analysis of tracked agency time, coordination alone (messaging, email, meetings, task management, and admin) took about 7 hours per person each week. Subtract that, plus PTO, pitches, management work, and current client commitments, and you have the time someone can actually give a new project.
Leave some of that time unassigned. A fully booked schedule has no room for a delayed approval, a sick day, an urgent client issue, or a task that runs over its estimate. Be sure to put this availability in one shared view so sales and account teams can check it before they commit to dates.
Pro Tip: If capacity planning still starts with headcount and a spreadsheet, try the ClickUp Resource Planning Template. It offers Workload, Calendar, Gantt, and other views for matching assignments with available resources.
Every time a client asks for extra work, make one of these three calls:
An agency can also choose to absorb the work, to protect a relationship or correct a mistake of its own. That’s a commercial decision. But those choices get harder when the original brief itself turns out to be wrong.
A manufacturing client hired Coalbanks Creative for a recruitment video. Three weeks into production, the team discovered that employee retention was the underlying problem. Coalbanks later described the restart as an $8,000 mistake and strengthened its discovery process. A better discovery process can catch such a mismatch earlier.
Put the recurring steps into your default workflows, including discovery questions, task sequence, estimates, approval stages, QA checks, revisions, and reporting.
Let the exceptions guide the process improvement. If people regularly have to work around the template, find out what has changed. An outdated process costs time too, especially when every project manager has to make the same adjustment independently.
In ZenPilot’s State of Agency Operations, documented processes and accountability correlated with more reliable follow-through (0.59) across 2,893 complete responses. Well-organized tools had a slightly higher correlation of 0.65.
The data shows a correlation, not a cause, but it reinforces a point. People need a dependable way to carry out recurring steps, so they can focus their attention on client context and creative decisions.
The records created between project stages matter as much as the stages themselves.
If a client pushes launch by a week, who’s in charge of updating the delivery? If a change request adds six hours, how does finance learn what to bill? If approval arrives by email, where does the production team see that work can continue?
The table below answers them.
| Information | Where it’s recorded | Who updates it | When |
| Signed scope and pricing | Contract or scope of work | Account lead | Every time a change is approved |
| Tasks, owners, and delivery dates | Work management system | Project manager | When the delivery plan moves |
| Client approvals | The task or doc the approval affects | Whoever receives the approval | As soon as it arrives |
| Estimates and time spent | Time-tracking system | Each team member | Daily or weekly |
| Invoices and payment status | Accounting system | Finance | At each billing cycle |
Choose where each decision affecting scope, time, or money is recorded, and make the update rule clear. People who depend on approvals and records should be able to find them without hassle.
For example, before Finance closes the invoice, the project owner must reconcile approved change requests, billable overages, expenses, and delivered work against the final scope. If they write off anything, they need to record why.
Delivery work slows down when everyone on an account is expected to watch for messages all day.
In Rize’s tracked data, messaging took more of an agency’s week than meetings: about 2.4 hours per person, compared with 1.7 hours for meetings and calls. Each interruption stretches production work, and that shows up later as actual hours running over the estimate.
To avoid this, a creative team can reserve 10 a.m. to 1 p.m. for production while the account lead covers Slack and email. A live campaign issue, publishing error, or approval blocking same-day delivery gets escalated immediately. General feedback waits until the window ends.
Set clear expectations, like, “We’ll acknowledge messages within two business hours, and anything affecting a live campaign or same-day launch will be escalated immediately.” Coverage can rotate between account leads or project managers. Keep the current owner, response window, and escalation rules visible to the whole account team.
Also Read: AI Capacity Planning
A five-person studio can solve a capacity clash in one conversation. At 500 people, the same decision can cross several teams, budgets, and reporting lines. Read these examples for both the operating model and the scale around it.
Performance and media agencies need enough flexibility to move when client priorities, channel mix, or spend changes.
Keep the core team focused on steady work, then add capacity when demand spikes. A shared specialist, contractor, or smaller flex team can cover a temporary need without turning every busy quarter into another permanent hire.
And keep an eye on the agency economics alongside campaign performance. A strong client result can still consume more strategic or specialist capacity than the commercial model was built to support.
The weekly review should answer three questions:
Independent media agency Apollo Partners describes itself as “small by design.” Founder Eric Perko told LBB that staying smaller lets the agency remain nimble, keep senior thinkers close to the work, and move without the bureaucracy of a much larger network.
Lesson: Capacity doesn’t always need to grow with billings. A smaller media team can preserve speed and senior involvement when the operating model is designed around that constraint.
For a smaller creative agency, the harder staffing question is which capabilities deserve a permanent seat on the team.
Hold on to the people who carry the agency’s core craft, client knowledge, and recurring work. Then build reliable access to specialists whose skills are needed occasionally. It could be web development, research, production, copy, motion, or another niche capability.
The external bench needs the same care as internal capacity. Track who already knows the agency’s standards, which projects they’re suited to, and how much onboarding each person needs before they can contribute. A specialist who joins quickly but needs the core team to explain every decision hasn’t created as much capacity as the headcount suggests.
New York agency Skaggs Creative recently listed a team of seven in a Founder Reports interview. Its delivery model combines two senior designers, a junior designer, two freelancers, and long-standing external partners across backend development, copywriting, and market research. Some of those developer relationships have lasted more than a decade.
Lesson: A small core team doesn’t have to mean narrow capability. Long-standing specialist relationships can give a creative agency range without rebuilding the team for every brief.
At full-service agencies, productivity depends heavily on what happens between teams. Creative, media, CRM, analytics, production, and strategy can each meet their own targets while the wider engagement slips away. One person needs ownership of the combined scope and commercial picture.
Make your cross-team dependencies visible before delivery starts. If media needs creative by Tuesday, CRM needs audience data by Thursday, and both depend on client approval, then those dates belong in the same plan.
Profitability also needs a second view at this scale. Review the client as a whole, then look at the service lines underneath it. One discipline can absorb far more effort than planned, while the total account still looks acceptable.
Ovative Group is an independent full-funnel media, measurement, and creative firm with more than 500 employees. As the agency expanded, teams amassed spreadsheets, email threads, and standalone tools across client work. Project visibility suffered above all.
Ovative moved that work to ClickUp, giving executives and team leads a shared view of project health, workloads, bottlenecks, and progress. The change contributed to a 30% increase in team efficiency and a 50% reduction in errors during ad builds.
Lesson: Once an agency starts coordinating hundreds of people across media, creative, measurement, and client delivery, cross-team visibility becomes part of delivery capacity. A delay inside one discipline has to surface before it becomes everybody else’s problem.
Marketing agency productivity becomes harder to track when scope, capacity, time, and delivery are spread across separate tools. Every handoff creates another place for context to drift and another step before anyone can see what changed.
We use ClickUp to keep those parts of the work in one workspace. Our own marketing teams run this way every day, and the same setup translates naturally to agency work, where priorities shift, specialists are shared, and margins depend on catching problems early.
Here’s how we do it:
Our team keeps campaign details, working documents, creative assets, and final deliverables in the same ClickUp workspace. Once a campaign is planned, we break it into ClickUp Tasks, assign owners and dates, and use Custom Fields and statuses to carry the context people need during delivery.
The approved brief or statement of work can live in ClickUp Docs alongside the Tasks delivering it. When something changes, the agreement and the affected work stay close enough to update together. That proximity is the important part.
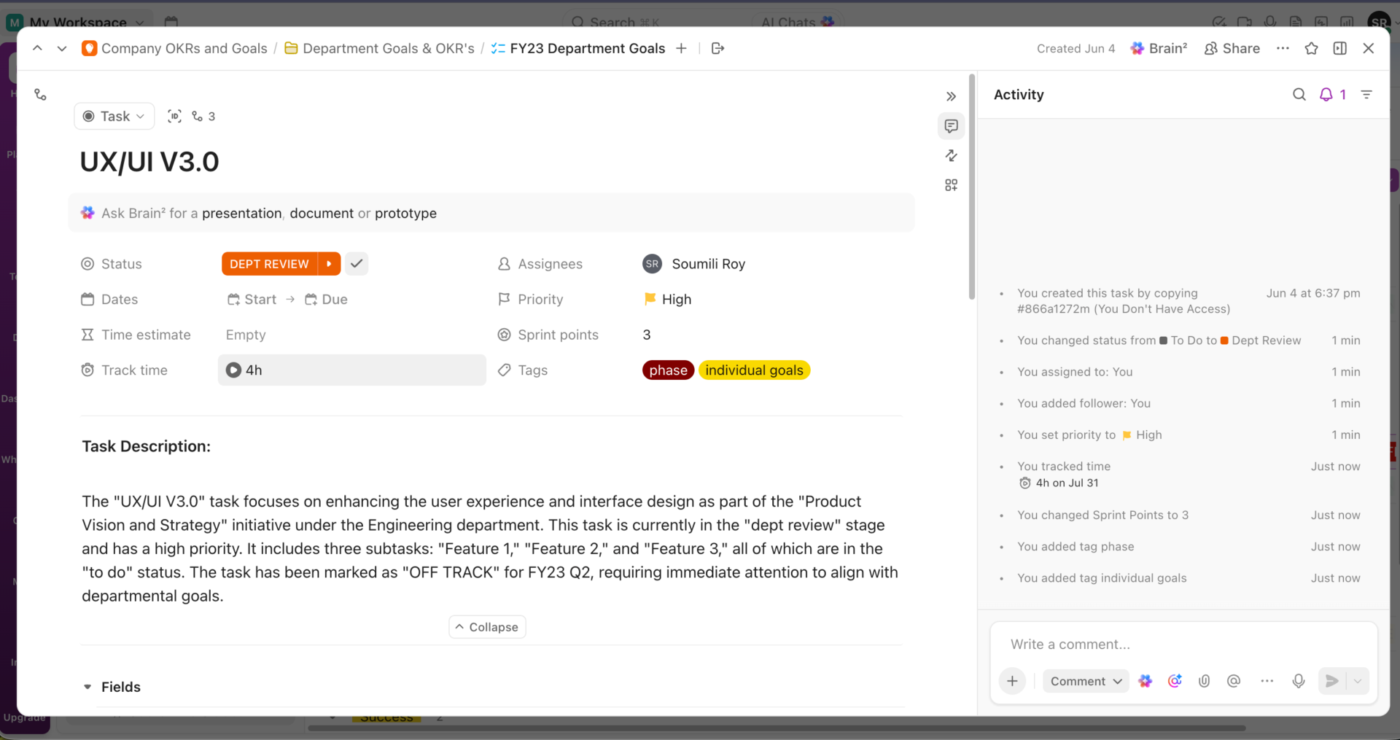
ClickUp’s Workload and Team views help us plan marketing resources and see team capacity across active work. When several heavy assignments land on one person at once, we can see the concentration early enough to move work before the deadline becomes a warning.
ClickUp Workload View can map Time Estimates against each person’s capacity, including working schedules, holidays, and time off.
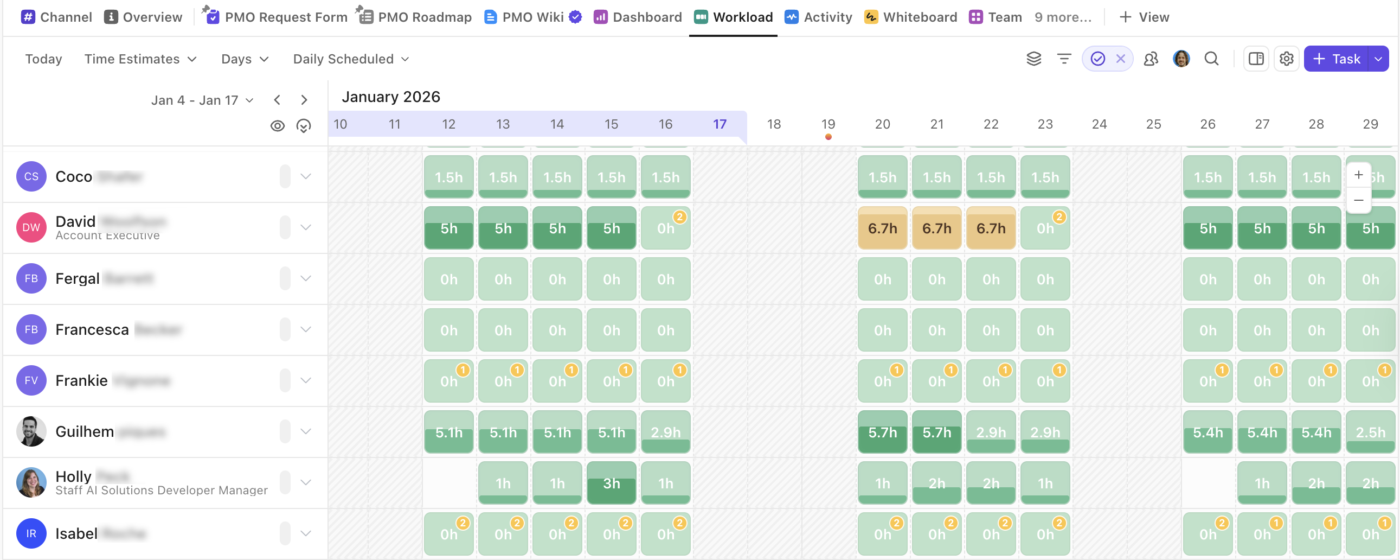
Once delivery starts, tracked time can sit beside those estimates.
Watch: Agency productivity shouldn’t come from squeezing more hours out of the team. This walkthrough shows how agencies can tighten planning, visibility, and workload management without turning capacity gains into burnout.
Adding a chatbot to a workflow is easy. What we wanted was AI that understood the work around it. Our team uses Brain² to summarize feedback threads, pull together campaign information, and extract takeaways from retrospectives. Across cross-functional teams, we also use it to surface capacity risks and dependencies that deserve attention.
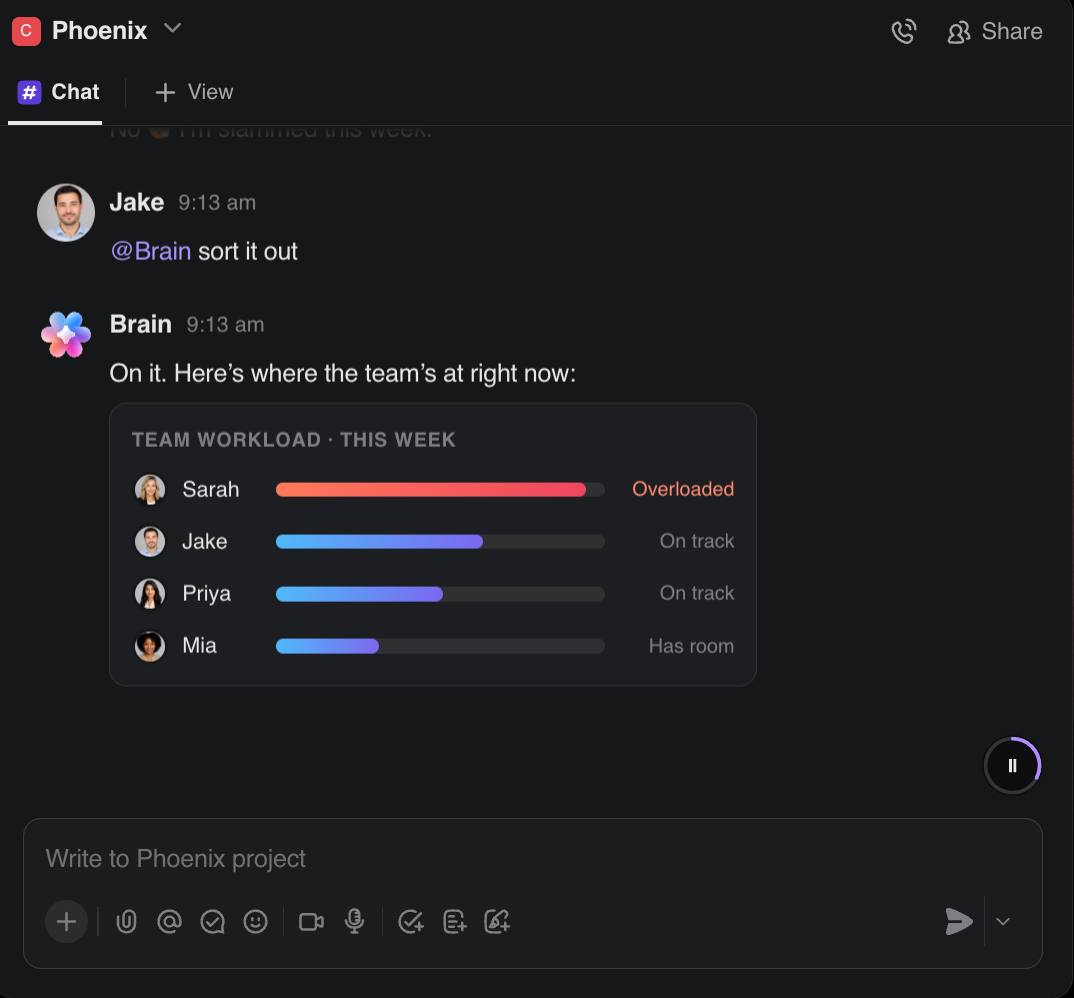
In an agency review, that could surface overdue approvals, projects nearing their estimates, or the history behind a delayed deliverable, before someone spends half an hour assembling the context manually.
And when the same checks repeat, ClickUp Super Agents take over. They’re contextual AI teammates that can run workflows using the same Workspace information the team is already working from. A Scope Creep Detector, for example, can track additions against the original project scope before extra work disappears into delivery.
We use ClickUp Dashboards to bring the work behind the numbers into one place. Time Reporting cards can show estimated and tracked time together, grouped by team, project, or client work, while Billable Report cards can separate billable from non-billable time.
When we need a workflow-specific calculation, Formula Fields can work with fields like Time Tracked, Time Estimated, numbers, and currency values.
Best for: Agencies managing several clients, shared specialists, and recurring delivery workflows that need scope, capacity, time, approvals, and reporting connected in one workspace.
Skip it if: You’re a very small shop with a handful of straightforward projects and your current setup already gives you a reliable view of workload and delivery without much reconciliation.
Pick one project that closed this quarter and compare what you priced with what it actually cost.
Look at the hours, the revision rounds, the change requests, and anything written off. The biggest gap tells you where to make your first change: the estimate template, the capacity check before sales commits to a date, or the rule for handling extra requests.
To see how big that gap is across the whole agency, run your numbers through the Agency Profitability Calculator. Enter your team size, billable rate, utilization, and tools, and it estimates how much margin you’re losing each year and where most of it is going.
Don’t wait for the final P&L. Compare the project’s current tracked hours, role mix, contractor costs, approved scope changes, and expected revenue against the original estimate while work is still active. The goal is to catch a project that has moved far enough from the plan that someone needs to intervene.
Yes, internally. Time tracking doesn’t have to determine what the client pays. It tells you what the work costs the agency to deliver. A $10,000 retainer can look healthy until you discover that the account consistently consumes far more strategist, creative, or leadership time than the price was built to absorb.
This is still a live question among agency owners, even after years in business. The answer depends on the pricing model. Time-and-materials work can bill meetings, calls, and account management directly if the contract allows it. Retainers and fixed-fee projects often absorb them into the agreed price.
Either way, track the time internally. If those activities consume 10–15 hours a month, they belong in the cost of serving the client even when they never appear as separate invoice lines. Billability decides what gets invoiced. Profitability still has to account for the work.
Review delivery signals weekly and financial results monthly. Weekly, look for estimate overruns, scope additions, resource changes, delayed approvals, and unbilled work while there’s still time to respond. At month-end or project close, reconcile those signals against revenue and direct delivery cost.
Start with the client or project level. That’s where you can see whether paid capacity turned into profitable work. Then use the other two as diagnostics. Employee metrics such as utilization show whether you’re using capacity well, while service-line profitability reveals whether a particular offer is consistently harder or more expensive to deliver.

Manasi Nair
Max 24min read
Manasi Nair
Max 20min read

Sudarshan Somanathan
Max 22min read

© 2026 ClickUp