
Have you ever wondered how your target audience reacts to your published content? Or does your content achieve your objectives and attract the right audience in the first place?
Your content strategy must be data-driven to attract suitable leads and gain traction. The level of audience engagement on a platform fluctuates for various reasons, often impacting your marketing efforts.
However, when you dissect and measure strategies with your target audience, content marketing becomes easier.
Content Marketing Key Performance Indicators (KPIs) act as your live radar, offering real-time insights into how your content influences audience behavior. These marketing KPIs help you polish your brand’s image and drastically increase conversion rates.
If you’re here to learn what KPIs to measure, let’s start with the 20 most crucial metrics to make or break your content strategy.
Top 20 Content Marketing KPIs to Track in 2023
What are Content Marketing KPIs?
Content Marketing KPIs (Key Performance Indicators) are measurable values used to gauge the effectiveness and success of a content marketing strategy. They help you track specific goals and objectives, such as engagement, conversions, or audience reach, to assess your content marketing performance further.
Content marketing campaign KPIs act as quality checks for assessing how well your content strategy is doing. Picking the right KPIs hinges on the goals of your content strategy.
Tracking and analyzing these metrics regularly helps you make smarter choices to improve your content’s performance using data.
Why is Setting Content Marketing KPIs Important?
Key performance indicators clear the path to success by setting data-driven objectives and guaranteeing they align with larger corporate goals.
- Direction clarity: Tracking KPIs provides direction and focus by highlighting the critical performance areas relevant to your business. Marketing KPIs help set goals for the tasks to achieve your marketing objectives
- Audience insights: Monitoring KPIs helps you understand how your target audience views your material and how they interact with it
- Better collaboration: Clear KPIs foster better communication and collaboration among teams by creating a shared understanding of what needs to be achieved and helps the team work toward these objectives
Before you decide on content marketing campaign KPIs, you must know the different types. This way, you can pick metrics that fit your business goals, making it easier to measure success accurately and create better strategies.
Types of Content Marketing KPIs
Content marketing KPIs cover metrics that gauge how well content marketing objectives and strategies perform. They’re split into four types, each looking at specific aspects of content marketing effectiveness.
Type 1: Content marketing KPIs for brand awareness
These KPIs measure the impact of strategies designed for brand visibility and recognition. They track metrics like organic website traffic, page views, backlinks, brand mentions, referral sources, and media coverage.
Looking at these metrics helps you understand how well your content marketing efforts boost brand recognition. Match these with your business goals to track brand awareness and keep tweaking your strategy for better results.
Type 2: KPIs for managing engagement in content marketing
Tracking metrics such as audience interaction on social media platforms, including likes, shares, and comments, provides insights into content resonance.
Checking session duration, click-through rates, time on page, and newsletter signups tells you how engaged people are with your content.
These metrics measure engagement for content marketers and steer your content strategies toward making more captivating material for your audience.
Type 3: KPIs to enhance your lead generation and sales with content marketing
Checking conversion rates, customer acquisition costs, and the number of qualified leads from content engagement is crucial for insights. Following leads from the start to the sale is essential to assess how well your content marketing program performs.
Are people turning their interest into action, clicking links, and buying after signing up? The ultimate goal is to increase brand awareness and turn interested visitors into customers, so you need to understand how your audience reacts to your content.
Type 4: Role of KPIs in retention through content marketing
Retention rate helps you trace progress and find the loopholes hindering customer loyalty. Retention tracking helps you discover if your content keeps readers engaged in the long run.
Metrics like customer retention rate, lifetime value, repeat purchase rate, and net promoter score give us an idea of how happy and loyal customers are. Monitoring these KPIs helps us see how well your content maintains customer connections.
There are hundreds of KPI metrics to monitor, but not all might fit your content marketing campaign goals. Define your content goals before a marketing campaign to get a head start.
20 Content Marketing KPIs
Here’s a list of 20 content marketing KPIs indicating how well your content marketing strategy works.
Content marketing KPIs for brand awareness
While brand awareness campaigns might not rapidly increase revenue, they increase brand awareness, recall, and visibility. Consequently, as your brand gains recognition, it becomes simpler for your target audience to recognize it when purchasing.
Craft content that resonates with your company’s goals, values, and mission to boost brand awareness. Ensure it’s engaging to attract audiences who need to get familiar with it.
Here are some crucial performance metrics to monitor for your brand awareness campaigns:
1. Website visits and page views
Website visits indicate the number of times users land on your site, reflecting overall traffic and interest. Meanwhile, page views measure the number of pages users explore during their visits.
Tracking these metrics offers insights into user engagement and interaction with your content. More organic traffic or website visits imply increased exposure and visibility to a broader audience.
Additionally, higher page views suggest users explore multiple sections of your site, indicating deeper engagement and interest in your brand’s content and offerings.
Track pageviews on key landing pages to see how well your content attracts visitors and boosts brand visibility and recognition.
2. Inbound links (backlinks) and PR mentions
Backlinks, or inbound links, are hyperlinks from other websites that direct traffic to yours. These links can positively impact a site’s SEO (search engine optimization) by indicating credibility, authority, and relevance to search engines.
A backlink reflects how another website verifies the applicability and relevance of your content and entices its readers to visit your page. These links act like votes of confidence, boosting your website’s authority and drawing in organic traffic.
Track the number and quality of these links using tools like SEMrush or Ahrefs. Analyze the sites linking to you—are they relevant and reputable, and do they drive traffic and conversions?
PR or public relations mentions, from industry blogs to major news outlets, are like megaphones for your message. Tools like Google Alert, Brand24, or Meltwater amplify these mentions, revealing valuable insights on performance.
Sign up with these tools, and look at who’s talking, where they’re talking, and what sparks engagement.
3. Social shares
It’s considered social sharing when people share or repost content with their network on platforms like Facebook, Twitter, LinkedIn, Instagram, etc. Social sharing helps increase content reach, boosts visibility, and can bring more traffic to your original content.
Every share on your post acts like a mini-vote. Inspect which content generates high share counts to understand what resonates with your audience.
Look beyond the numbers and focus on who’s sharing your content. The individuals or groups sharing your content matter because they indicate the eventual audience that fits your Ideal Customer Profile (ICP).
Do they include industry influencers, loyal customers, or potential new leads? Knowing this reveals who your content resonates with most, guiding you in targeting and shaping future content for better KPI outcomes.
4. Tags and mentions
When people tag or mention your brand on social media, they discuss or reference it in their posts or comments.
Let’s say someone tags your brand in a shared photo or mentions your brand in a tweet or comment. Each mention boosts your message, showing who’s talking, where, and what clicks with the audience.
It’s like a live feedback loop, giving insight into how much your brand sparks natural conversations, helping measure awareness and brand sentiment.
Loads of mentions, particularly positive ones, signal that your content is resonating. If influencers are talking about you, your brand’s authority is rising. However, don’t brush off negative mentions. They’re chances to improve and earn trust.
5. Referrals
Website visitors who land on your website by clicking a link from another website, social media platform, or any online source besides a major search engine are referrals. You get referral traffic when users are directed to your site from another website through a clickable link.
By monitoring referral traffic, you’ll understand how well your marketing, partnerships, backlinks, and overall online presence perform. When tracking referrals, focus on two primary metrics: engagement and conversion.
To see how people interact with your content, use Google Analytics to track website traffic and real-time user behavior, like where they’re coming from and what they’re doing. Check out Facebook, Twitter Analytics, and Instagram Insights for social media engagement.
Use unique tracking links for each piece of content or referral campaign to measure their performance accurately. Regularly review your referral data to identify trends, understand what’s working, and adjust your content strategy.
KPIs for managing engagement in content marketing
Building an engaging and enduring relationship between your brand and its followers comes next in your content marketing plan.
How do you gauge your followers’ engagement with your brand’s message? Nowadays, people have lower attention spans, making creating engagement-worthy content necessary.
That’s why analyzing how people engage with your brand is essential by conducting an engagement campaign and watching out for the following KPIs:
6. Time-on-page
Google Analytics reveals the time every visitor spends on your web page. It’s a clear signal of how your content lands with your audience.
If people spend a lot of time on your content, that’s a good sign—it’s exciting and informative. Don’t stress if the bounce rate is high; look closely at particular pages to understand what’s happening.
If visitors spend little time on product pages, it could signal smooth navigation. But for longer content, consider adding attention-grabbing hooks or improving readability to keep them engaged.
Say you’ve got this massive 6000-word blog post about content workflow software. It receives 100,000 monthly views, but people stay around for 20 to 25 seconds on average. For a lengthy post, these figures indicate that your content isn’t holding the audience’s interest in your topic or writing style.
Tracking time spent on content helps you improve your strategy and forge a deeper bond with your brand step by step.
7. Average session duration
Average session duration tells how much time users spend on a website, mobile app, or platform per session. To work it out, you divide the total number of sessions during a specific period by the entire duration of all of the sessions.
Longer average times indicate your audience is hooked and finds your content valuable, which helps build brand loyalty, trust, and deeper customer relationships.
Track drop-off points within longer content. Are there specific sections losing their interest? Use this info to tweak your approach and update the content with more engaging material.
8. Click-Through Rates (CTRs)
Clickthrough rates track how many clicks a specific link gets compared to the total views, highlighting the difference between views and actual clicks. Higher CTRs boost brand engagement, lead generation, or sales.
However, low CTRs aren’t the end of the world. Take a closer look at the context. Do the CTAs need to be better positioned or clearer?
Use CTR data to identify areas that need improvement—experiment with A/B testing various CTAs and formats to improve engagement levels.
9. Newsletter signups
When someone signs up for your newsletter, they want to learn more about your company. It also means they trust your brand. An increase in your subscriber list indicates that your current business growth strategy works.
Track signup numbers across campaigns, social media, or web pages from your email delivery control dashboard. Analyze the themes and platforms and the demographics and interests of these signups to understand your ideal audience and tailor content accordingly.
10. Comments
Comments are the little yet insightful conversations your content incites—the more significant and positive the comments, the better for the brand.
Monitor the total number of comments across platforms and content types. High volume indicates engagement, while low volume might signal disinterest. Identify recurring themes, questions, and requests within comments to gain deeper insights.
This reveals gaps in your content strategy and opportunities to address audience needs directly. Use this data to refine future topics, address concerns, and personalize your brand’s Unique Value Proposition (UVP).
KPIs to enhance your lead generation and sales with content marketing
Lead generation campaigns are crucial because they bring potential sales prospects to the business. Here are some content marketing key performance indicators to monitor during your lead campaigns:
11. Customer Acquisition Cost (CAC)
Customer Acquisition Cost (CAC) covers all your marketing—not just content—to get new customers. It shows how much you must invest to bring in fresh customers consistently.
First, understand your CAC equation. Calculate CAC by dividing marketing and sales costs by the number of new customers acquired within a set period.
To calculate Customer Acquisition Cost (CAC), consider marketing and sales costs, including marketing efforts, promos, campaigns, and sales activities. Set a specific timeframe for your calculations.
Next, tally up how many new customers you’ve gained. Assign costs linked to customer acquisition, such as advertising, content marketing software, and team salaries. Choose a formula (usually total acquisition costs divided by new customers) for CAC calculation.
Track CAC across content formats, channels, and campaigns. Identify the most cost-effective sources of new customers to learn which content resonates with your target audience and drives conversions.
12. Number of subscribers
Subscribers willingly sign up to receive updates, newsletters, or content from you regularly.
They actively stay informed about news, offerings, or updates by providing their contact details, such as email addresses or preferred communication channels.
Track subscriber acquisition from different channels (organic, paid, referrals) and content types (blog posts, emails, social media). Identify periods of rapid increase or unexpected declines to understand how your efforts generated leads and what works with your audience.
13. Form responses
The filling of forms indicates active engagement from potential leads and functions as key performance indicators (KPIs) in content marketing campaigns. They strengthen content strategy and gather information about a potential customer.
Monitor the percentage of users who start and complete your forms. Low completion rates indicate questions need clearer, relevant content or better form design. Analyze which forms perform best to understand what content encourages engagement and valuable data collection.
Look at responses to analyze common answers, recurring themes, and patterns. Doing this will reveal your audience’s values, pain points, and content expectations.
14. Cost Per Lead (CPL)
Cost per lead (CPL) showcases what content performs better and on what platform. Divide your total marketing spend (creation, distribution, promotion) by the number of leads generated within a specific period.
Track each CPL across different content formats, channels, and campaigns. Compare CPL to metrics like click-through and conversion rates to identify bottlenecks in your funnel.
Based on these insights, optimize your strategy to generate leads: invest more in high-quality content, refine low-performing areas, and prioritize formats that convert efficiently.
15. Conversion rates
Determine conversion rates by the number of people reacting positively to your campaigns.
How different formats (blogs, ebooks, webinars) convert audience members into specific actions (purchases, downloads, signups) to determine which content type has the highest ‘pull.’
Conversion tracking reveals how many referrals become paying customers. Track the number of people who land on your website or platform from a referral source and how many take the desired action (e.g., purchasing or signing up for a newsletter).
Segment these audience data based on demographics, interests, and journey stages. Analyze conversion rates for each segment to understand which content resonates with each and refine your targeting for optimal results.
Role of KPIs in retention through content marketing
Forbes asserts that investing in retaining current customers is five times less expensive than attracting new ones. The below KPIs demonstrate the genuine significance of a retention campaign:
16. Customer Retention Rate (CRR)
The proportion of users who stop doing business with your company after their first purchase defines CRR.
Estimate churn by dividing the number of customers lost in a period by the total number of customers at the beginning of that period. This reveals the rate at which your content fails to engage existing customers.
Analyze customer behavior before and after churn. Identify content consumption patterns, engagement levels, and last interactions to decipher where your content falls short of fulfilling customer needs.
Use the churn insights to tailor content to existing customers. Address their pain points with relevant themes, formats, and calls to action.
17. Customer Lifetime Value (CLV)
Customer Lifetime Value is a content marketing KPI that calculates the total revenue you should anticipate from a single client throughout your partnership.
To calculate CLV, you estimate the revenue from a customer by multiplying their average purchase value with the average number of purchases in a year, then multiply that by the average length of time they stay as a customer.
18. Expansion MRR (Monthly Recurring Revenue)
Expansion MRR from existing customers refers to the extra money your product makes from upsells, cross-sells, and add-ons.
Look into the additional monthly revenue generated from existing customers through upsells, cross-sells, and add-ons to find out who’s engaged with your brand and receptive to loyalty.
Identify what triggers your customers to spend more. Is it exclusive content offers, personalized recommendations, or strategic pricing models? The insights you get here will help you and your team replicate success and target upsell efforts.
19. Net Promoter Score
Net Promoter Score (NPS) is a KPI that measures the loyalty and satisfaction of your target audience. Typically, it uses a scale to measure their responses.
Ask your audience, “On a scale of 0 to 10, how likely are you to recommend our content to others?” Simple and direct, it reveals how your content resonates and drives loyalty.
Group customers into three groups based on the responses: Promoters (scoring 9-10), Passives (scoring 7-8), and Detractors (scoring 0-6). Calculate NPS by subtracting the detractors from the promoters. The resulting percentage score can range from -100 to +100, indicating customers’ sentiment and loyalty towards the brand.
Track your NPS across various content types, platforms, and demographics. Identify passionate promoters and frustrated detractors, as the former validate your efforts and the latter indicate blind sports.
Address the necessary concerns based on feedback, and fine-tune your content strategy.
20. Repeat Purchase Rate
This KPI calculates the proportion of repeat business from customers to your overall clientele. This indicator broadly indicates your customer commitment and measures your client retention.
Divide the number of customers who make repeat purchases within a specific timeframe by the total number of customers. This reveals the percentage of customers your content successfully turns into long-term buyers.
Track the repeat purchase behavior across different content types, channels, and campaigns. Pick out what themes, formats, and offers resonate most with your repeat customers to learn what content fosters loyalty and drives continuous engagement.
How to Track Content Marketing KPIs?
Remember, data alone isn’t the treasure—the quality of the insights you uncover is critical. So, dive deeper and analyze your insights thoroughly.
ClickUp changes the way you track content marketing KPIs. It moves you from scattered spreadsheets and isolated tools to a unified, action-oriented command center.
As an all-in-one project management software that fosters teamwork, ClickUp lets you ideate, track KPIs, organize, and collaborate on marketing tasks.
Explore powerful features such as Goals, Whiteboards, and Docs. With customizable fields, dashboards, reports, and pre-built KPI tracking templates, ClickUp empowers you to monitor content marketing KPIs effectively.
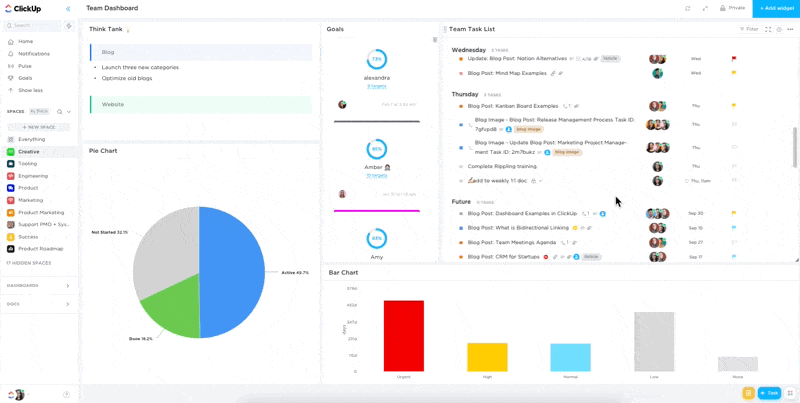
ClickUp Goals

ClickUp Goals is a powerful tool for monitoring KPIs. Begin by setting up a ‘Goal.’ Clearly define the precise outcome you desire with this goal, ensuring it follows the SMART criteria: Specific, Measurable, Achievable, Relevant, and Time-bound.
Determine the metrics that best measure your progress toward the goal. Ensure the metrics are specific and actionable, providing clear insights into your performance.
For each KPI, create a Target within your Goal. Specify the desired level of achievement for each metric within the timeframe of your goal. ClickUp allows you to set various target types.
You get to customize the metrics you choose to track those objectives:
- Number: Create a range of numbers and track increases or decreases between them
- True/False: Use a Done/Not Done checkbox to mark your Target complete
- Currency: Set a monetary Goal and track any increases or decreases
- Task: Track the completion of a single task or an entire List
ClickUp offers various ways to track your progress toward your goals and targets. Use the progress bars to represent the completion percentage for each target visually. Explore the charts and graphs to visualize trends and performance over time.
Use the ClickUp Dashboards to combine various goals and targets into a single overview.
Review your progress regularly and analyze the data collected from your KPIs. Identify areas for improvement and adjust your strategies accordingly.
The ClickUp Reporting features provide valuable insights to help you make data-driven decisions.

Collaborate with your team by assigning tasks through the ClickUp Tasks and track progress with your shared goals. Choose from our library of over 1000+ strategic marketing plan templates to break down your budgets, goals, and other critical content KPIs in one place.
Sign up for free today and improve your team’s best performance and tracking goals!


Everything you need to stay organized and get work done.

Recent Articles
How to Scale a Marketing Team: A Phase-by-Phase Guide 
How to Scale a Marketing Team: A Phase-by-Phase Guide
Best Marketing Portfolio Examples and How To Make One
Best Marketing Portfolio Examples and How To Make One
Evergreen Content Examples that Boost Long-Term Traffic
Evergreen Content Examples that Boost Long-Term Traffic
