

Are you weary of manually spending countless hours building marketing reports over spreadsheets?
You spend hours importing marketing data from multiple campaigns across multiple platforms and third-party tools, such as business intelligence tools, Google Analytics, email marketing, performance metrics, etc. This data must be cleaned and copied into a visual format so your stakeholders or clients can understand the findings.
Understandably, this process is frustrating, time-consuming, prone to errors, and overwhelming. In addition, when it reaches decision-makers, the data is already a few days old, leading to slow and ineffective decision-making.
That’s where digital marketing reporting software can come to your rescue.
Marketing reporting software automates the data reporting process for busy teams by collecting data from multiple marketing channels and software. It provides insights into key metrics such as website traffic, leads generated, signups, and conversion rates to analyze your campaign’s performance.
We have done the hard work for you and compiled a list of the top ten automated marketing reporting tools and their key features, limitations, and reviews to help you make the right choice.
Keep reading to select the perfect tool that meets your requirements and propels your business to the next level.
What Should You Look for in Marketing Reporting Software?
Here are a few things to consider when choosing marketing reporting software to ensure it meets your data collection and business goals.
- Channel and campaign management: As a marketer, you often run multiple campaigns on different channels. Managing diverse campaigns with a single reporting tool improves your marketing team’s productivity and efficiency
- AI capabilities: With AI and automation capabilities, a marketing reporting software solution makes reporting more straightforward. Look for platforms with built-in AI marketing tools to create copies, project summaries, and progress updates
- Integrations: Ensure your marketing tool integrates with diverse marketing platforms, channels, and data sources, including social media channels, Google Analytics, Google Search Console, Google Data Studio, SEO tools, and business intelligence platforms
- Data visualization: The marketing reporting tool should convert your marketing data into a visually appealing, cross-platform, and detailed marketing report without having to train data models
- Data reporting: Look for marketing reporting platforms that let you build reports using graphs, charts, tables, and widgets. Also, ensure that the chosen platform enables you to create digital marketing reports covering your preferred client reporting metrics.
- Ease of use: Choose a marketing reporting tool with a user-friendly and ergonomic interface. Regardless of their level of expertise, all team members must be able to create reports and comprehend the results
- Cost: If you are starting a digital marketing agency, look for digital marketing reporting software that charges an upfront cost or monthly fees without additional setup costs. While most tools charge an upfront/monthly fee, account for the extra fees for exceeding usage limits, adding additional users, or accessing premium features
The 10 Best Marketing Reporting Software Solutions to Use
1. ClickUp

Marketing teams today have more channels, campaign types, and data sources to monitor. As a marketer, figuring out how to measure data, prioritize what matters, and organize it all can become overwhelming.
The good news is that with ClickUp, your marketing project and planning tool, all those initiatives no longer have to live in spreadsheets.
Next-generation teams use ClickUp’s Marketing Management Software to plan, ideate, execute, and report on all projects and campaigns in one platform, making it an all-in-one marketing reporting tool.

Writing marketing reports can be a time-consuming task. However, you can significantly speed up the process with ClickUp Brain, your AI-powered brainstorming partner. With a few clicks, you can easily summarize notes, conversations, and meetings and create reports.
ClickUp Brain also helps you write faster, check spellings, and draft quick replies to messages, all while maintaining your desired tone.
In addition, ClickUp Brain for marketing teams helps you brainstorm and create content in minutes. It can create blog outlines, generate creative briefs for your design and content teams, suggest ideas for your social media posts, and craft email campaigns that drive conversions.
Using the ClickUp Marketing Reporting Template, you can identify high-level growth opportunities and ensure alignment between strategy and execution. It helps your marketing team understand the target audience, measure and visualize campaign performance, and write reports quickly with AI using accurate data.
Use ClickUp Dashboards to build visually appealing and insight-rich reports from your marketing data. You can customize your reports with widgets, custom fields, and the KPIs and metrics you want to track. Dashboards provide real-time data, perfect for stakeholder and client reporting, and make it easy to communicate your marketing performance effectively.
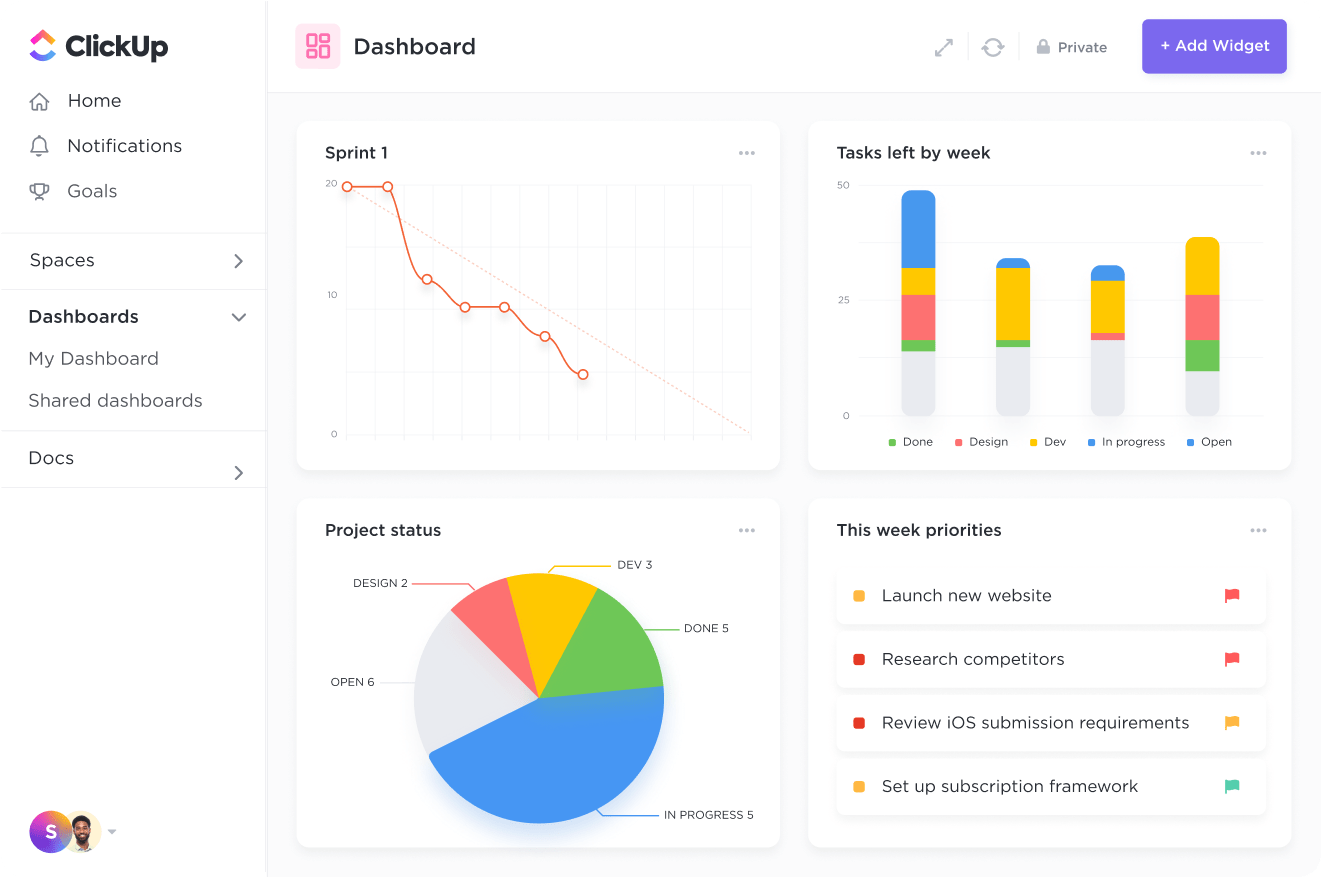
Connect ClickUp to your marketing tech stack to collect data and gather insights with 1000+ ClickUp integrations. Reduce the data transfer errors and ensure your marketing report has real-time data.
Here are the top features that make ClickUp the best marketing reporting tool for marketing agencies, teams, and professionals.
ClickUp best features
- ClickUp Dashboards: Tailor your ClickUp Dashboard to perfectly fit your unique requirements, whether for email marketing, SEO, Google analytics, content marketing, or other purposes
- ClickUp Brain: Use ClickUp Brain to quickly and easily summarize your notes, write compelling copies, and create insightful reports in no time

- ClickUp Whiteboard: Scope and deliver campaigns that impact revenue, promote awareness, and help meet the marketing goals and KPIs with ClickUp Whiteboards
- Integrations: Integrate your communication and collaboration tools easily. Marketers can leverage the benefits of integrations with Hubspot, Google Suite, Salesforce, etc.
- Market research templates: Add structure to your research process with ClickUp’s market research templates. They have questions and fields for collecting data relevant to your market/audience
ClickUp limitations
- Advanced features like ClickUp Brain are available to paid users
ClickUp pricing
- Free Forever
- Unlimited: $7/month per user
- Business: $12/month per user
- Enterprise: Custom pricing
- ClickUp Brain is available on all paid plans for $5 per Workspace member per month
ClickUp customer ratings
- G2: 4.7/5 (9400+ reviews)
- Capterra: 4.7/5 (4000+ reviews)
2. AgencyAnalytics

If you run a digital marketing agency, AgencyAnalytics helps you create custom dashboards and reports using data from various marketing campaigns, such as paid ads, SEO, and social media campaigns.
With AgencyAnalytics marketing analytics software, building custom client marketing reports doesn’t take all day, thanks to its pre-built templates and drag-and-drop report builder.
AgencyAnalytics best features
- Access all client data from SEO, PPC, social, email, call tracking, etc., in a single, intuitive interface for faster report generation
- Build tailored dashboards with features like custom metrics, customizable widgets, drag-and-drop report builder, embeddable content, and more
- White label your marketing reports using your logo and branding elements
AgencyAnalytics limitations
- Creating reports using detailed segmentation and multiple metrics without manual data input is highly challenging
AgencyAnalytics pricing
- Freelancer: $12/month per client campaign
- Agency: $18/month per client campaign
- Enterprise: Custom pricing
AgencyAnalytics customer ratings
- G2: 4.7/5 (200+ reviews)
- Capterra: 4.8/5 (100+ reviews)
3. DashThis

DashThis is a marketing reporting software that allows users to create customizable, all-in-one dashboards and reports to track and analyze marketing performance metrics from various channels in one place. It provides a centralized platform for monitoring KPIs such as website traffic, social media engagement, advertising campaign performance, and more.
With over 34 native integrations, you can seamlessly connect all your marketing data sources and generate any type of impactful digital marketing report you want.
DashThis best features
- Import unlimited client accounts, data sources, and users to the platform to make your marketing agency life more effortless
- Share your reports with anyone within your organization or outside your team using email, URL, or even a PDF
- Add all your data, including custom data sources, with the CSV file import system
DashThis limitations
- The steep learning curve for first-time users
- Compared to other popular marketing reporting tools, DashThis’s pricing is on the higher side
DashThis pricing
- Individual: $49/month for three dashboards
- Professional: $149/month for ten dashboards
- Business: $289/month for 25 dashboards
- Standard: $449/month for 50 dashboards
DashThis customer ratings
- G2: 4.8/5 (70+ reviews)
- Capterra: Not enough reviews
4. Cyfe

One challenge in-house marketing teams face is communicating the wins related to performance metrics with the leadership. Directly importing data from different tools, such as Google Analytics, social media platforms, or any other analytics tool, would make the reports complex since each platform shows different metrics.
Cyfe’s marketing data reporting software connects your organization’s multiple data sources and visualizes them in an easy-to-use dashboard to communicate the ongoing value.
Cyfe best features
- Share and highlight campaign insights anywhere you want, like portals, websites, blog posts, and social media analytics with embedded analytics
- Use Cyfe’s white-label solutions to generate reports with customized features under your brand name. These features include tailor-made dashboard backgrounds, domain names, personalized URLs to guide your client’s stakeholders to dashboards, etc. You can also add vital data metrics and benchmarking metrics to report growth
- Transform complex data into stunning visualizations using a variety of chart types, such as multi-chart, cohort, Gantt, funnel, and more
- Gather data from any data source using 100+ integrations and 250+ metrics included within Cyfe for faster, accurate marketing reports
Cyfe limitations
- Limited visualizations and customizations for creating marketing reports
- The lack of adequate built-in integrations makes data sourcing from marketing channels harder
Cyfe pricing
- Starter: $19/month for one user and two dashboards
- Standard: $29/month for two users and five dashboards
- Pro: $49/month for five users and ten dashboards
- Premier: $89/month for unlimited users and 20 dashboards
Cyfe customer ratings
- G2: 4.3/5 (60+ reviews)
- Capterra: 4.6/5 (70+ reviews)
5. Klipfolio
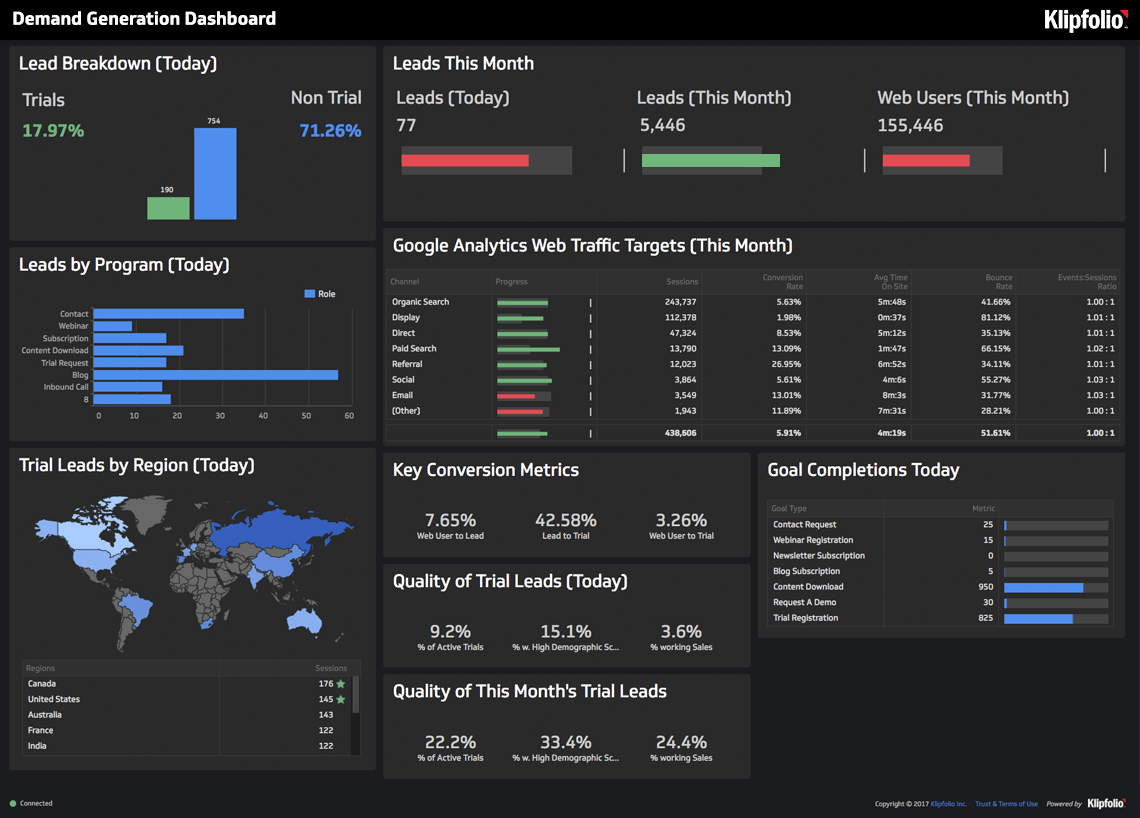
Klipfolio Klips lets you create custom dashboards and reports without a data warehouse.
Data teams use Klipfolio’s PowerMetrics to create and store metrics from popular file formats and data services. Regardless of where your data is coming from, visualize and analyze business-critical data.
Klips, on the other hand, is used by business teams to build real-time dashboards and set goals to monitor the team’s progress.
In organizations where cross-functional teams (such as data and business) use insights to make decisions, Klipfolio’s automated reporting is the best choice.
Klipfolio best features
- Use themes by Klipfolio to tailor the look and feel of the dashboards while using HTML, CSS, and JavaScript for deeper dashboard customizations
- Convert dbt projects into metric catalogs for business users to analyze, visualize, and share metrics and build custom dashboards. This Powermetrics feature makes it ideal for organizations with data-heavy reports
- Whether your data is in the cloud, spreadsheets, or on-premise servers, 100+ pre-built connectors in Klips and multiple data source integrations in Powermetrics help you connect all your data to glean insights
Klipfolio limitations
- Users should have technical knowledge to use Powermetrics well
Klipfolio pricing
- For agencies:
- Starter: $54/month
- Lite: $120/month
- Pro: $240/month
- Premier: $800/month
- For businesses:
- Grow: $142/month
- Team: $284/month
- Team+: $570/month
Klipfolio customer ratings
- G2: 4.5/5 (250+ reviews)
- Capterra: 4.7 (150+ reviews)
6. Mixpanel
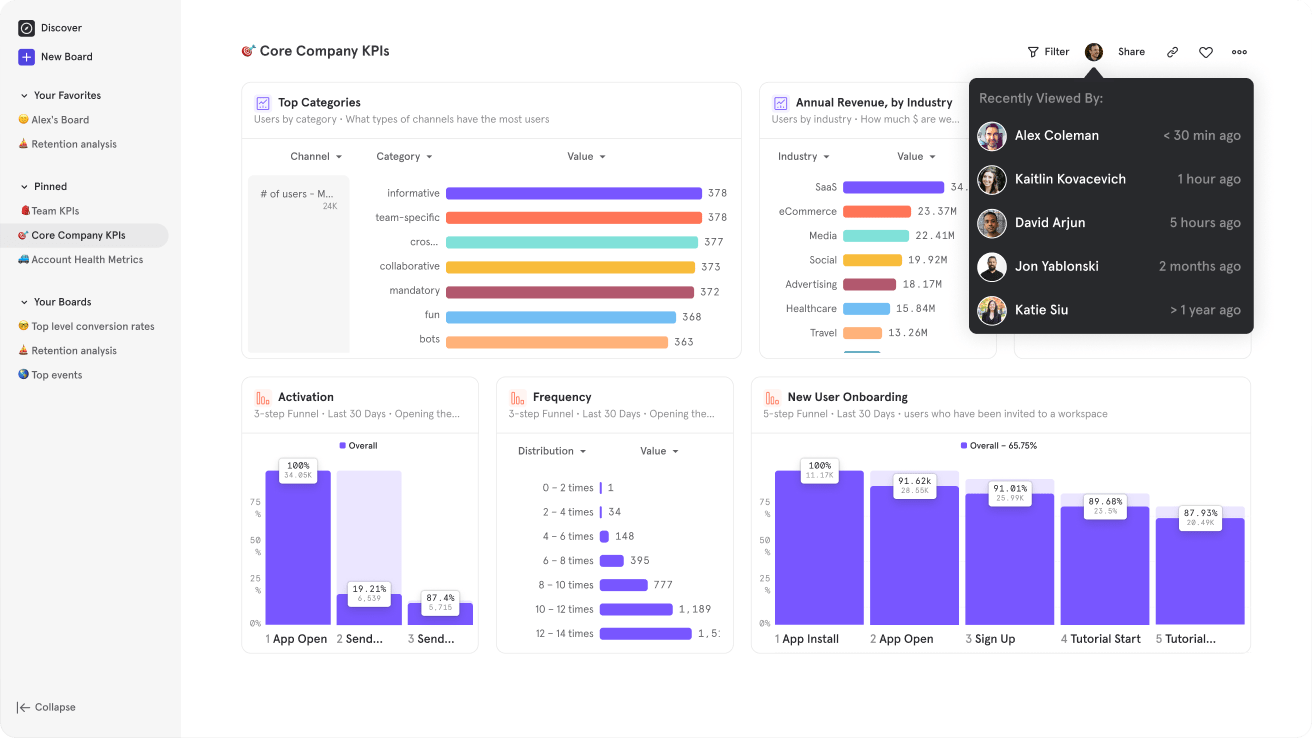
For agencies that want to go beyond tracking campaign data, Mixpanel is one of the best marketing reporting tools. It helps you monitor and understand critical metrics like user behavior on your app and website while analyzing user journeys.
Mixpanel’s product analytics enables product managers, designers, and developers to focus on product discovery and improvement.
Mixpanel best features
- Uncover trends by slicing and dicing data on the platform and review live updates to understand what people are responding to right in your app
- Add your company’s product, marketing, and revenue data to Mixpanel within minutes to unlock unique, actionable self-serve insights
- Use Mixpanel’s SDKs to reliably track events from web apps, websites, or even from your backend servers
Mixpanel limitations
- Complex user interface
- Not ideal for smaller businesses that do not have product or development teams
Mixpanel pricing
- Starter: Free
- Growth: Starts at $24/month
- Enterprise: Contact for custom price
Mixpanel customer ratings
- G2: 4.6/5 (1000+ reviews)
- Capterra: 4.5/5 (100+ reviews)
7. Improvado
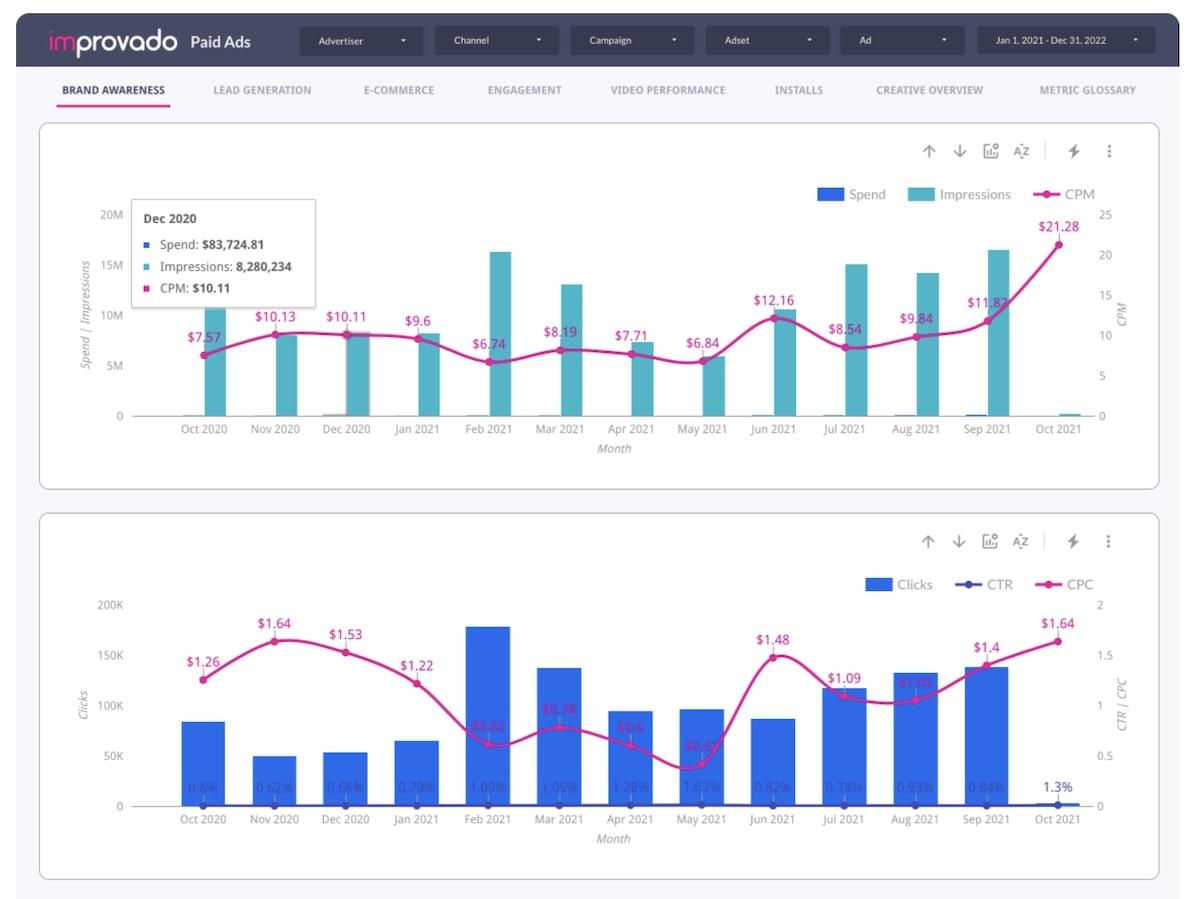
A marketing agency looking to deliver value to its clientele needs a powerful and feature-rich platform like Improvado. With Improvado, you can quickly automate complex marketing campaign data analysis and reporting.
Along with reporting, the tool lets you optimize your campaigns with data-backed insights into user behavior.
Improvado also offers pre-built data models, which build quality marketing datasets that can be used with business intelligence, AI, or as it is.
Improvado best features
- Use pre-built marketing plan templates to create custom reports
- Utilize Improvado AI Agent to converse with the platform, answer queries related to your marketing activities, and for data exploration, analysis, and interpretation
- Create auto data pipelines to source valuable data from 500+ channels, transform it, and store it in your preferred data warehouse
Improvado limitations
- Limited customization options for reports
- No data visualization option; you need to connect it to a separate BI tool
Improvado pricing
- Custom pricing
Improvado customer ratings
- G2: 4.5/5 (65+ reviews)
- Capterra: 4.5/5 (65+ reviews)
8. DataBox
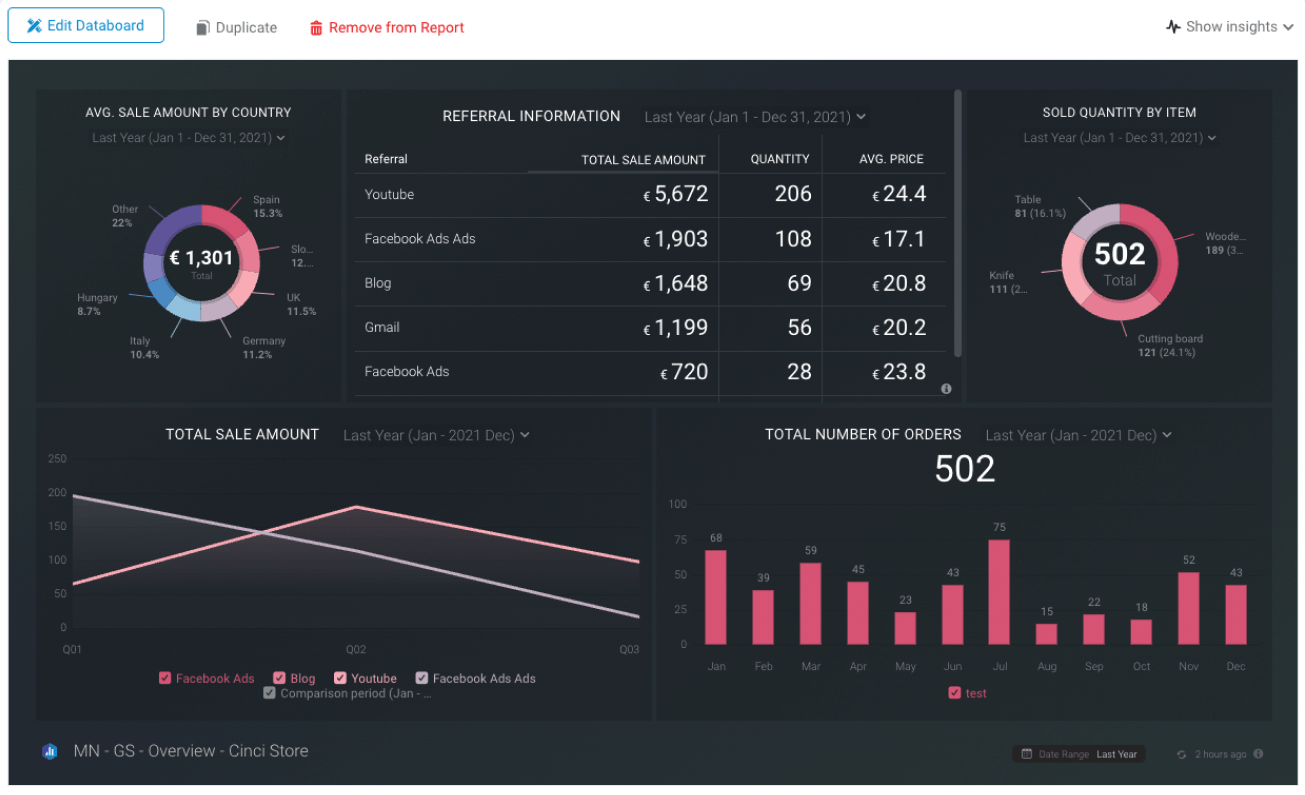
DataBox is comprehensive marketing analytics software for e-commerce, SaaS, and agencies. It monitors the most important business metrics, tracks revenue vs. goals, automates the data reporting process, sets sales and marketing goals (such as total sales, orders, or purchase ROAS), compares performance to other brands, and forecasts sales metrics.
DataBox best features
- Add dynamic data to your presentations that updates in real time. Embed essential dashboards, charts, and metrics to create a compelling and visual data story
- Monitor, exchange, and evaluate KPI and performance progress without requiring prior SQL or data science knowledge
- Analyze the best and worst-case scenarios when planning for the future. Use high forecasts to set ambitious goals and low forecasts to preempt any potential obstacles that may arise. Compare your estimates with your goals and historical data to ensure you’re on the right track
DataBox limitations
- Creating custom metrics in the query builder is not very user-friendly or intuitive
- The time-tracking capabilities need more finetuning and features
DataBox pricing
- Free: Forever for three users
- Starter: $59/month for five users
- Professional: $169/month for 15 users
- Growth: 399/month for unlimited users
- Premium: $999/month for unlimited users
DataBox customer ratings
- G2: 4.4/5 (180+ reviews)
- Capterra: 4.7/5 (190+ reviews)
9. Tableau

Tableau empowers teams and agencies with data integration, analytics, and insight generation capabilities.
Automate your data analysis, preparation, and governance with Tableau’s generative AI. Data teams use the visual analytics platform to simplify analytics in plain language, anticipate user questions, and accelerate time to insight.
As an analytics and reporting tool, Tableau is extensively used by enterprises and organizations with a data science team to create multiple reports with granular insights.
Tableau best features
- Get real-time visual analytics within the platform from almost any data source in the cloud or on-premise
- Simplify data analytics and insights generation with generative AI capabilities built into the platform
- Avail of extensive customization options to create dashboards precisely as you need for better KPI analysis from any marketing channel
- Create and receive custom data alerts
Tableau limitations
- Steep learning curve for beginners unfamiliar with data analytics and reporting tools.
- Takes more time to load when adding new elements or metrics to existing reports
Tableau pricing
- Tableau Creator: Custom pricing
- Tableau Explorer: Custom pricing
- Tableau Viewer: Custom pricing
Tableau customer ratings
- G2: 4.4/5 (2000+ reviews)
- Capterra: 4.5/5 (2200+ reviews)
10. quintly

quintly is a social media data analytics platform for brands and agencies looking to use social intelligence from multiple platforms to discover insights, increase reach, and build brand engagement.
Consumer brands and social media marketing agencies with a social-first digital marketing strategy use social data from quintly to access page-level data (follower data) and post-level data (interactions) for a detailed analysis of their content over time.
quintly best features
- Utilize 500+ social media metrics with an extensive library of customizable dashboards to analyze data in real-time and arrive at actionable insights with quintly’s client reporting tool
- Build and automate custom reports within minutes to share among your team or clients with private access controls
- Scale all your social media marketing efforts by conducting channel analytics, competitive benchmarking, content optimization, ad analytics, and more
quintly limitations
- The pricing structure can be confusing
quintly pricing
- Custom pricing
- Flat rate for all features + €15 per profile + €20 per user
quintly customer ratings
- G2: 4.7/5 (75+ reviews)
- Capterra: Not enough reviews
Also Read: The best market research templates to save your team time and effort
Your Marketing Reporting Software Must Collate Multiple Data Points for Actionable Insights
Congratulations on deciding to automate marketing reporting by moving it from spreadsheets and disjointed systems to online marketing reporting software.
When looking for digital marketing reporting tools, consider the data you need to collate for important metrics and your marketing team’s bandwidth.
Choose marketing reporting software if you need comprehensive reports from multiple tools. However, remember that you need a specialized in-house team member to interpret all the data and insights the tool generates.
If you’re just starting out with data visualization, beginner-friendly marketing reporting tools like ClickUp are the right fit. The pre-built report templates make it easy to plug and play the findings and share them with your leadership.
With its user-friendly interface, automation, customizable dashboards, drag-and-drop builder options, and extensive data source connections, ClickUp is your go-to marketing planning software and reporting tool.
Moreover, marketing and data teams can also benefit from ClickUp’s project management capabilities, which allow them to track and manage all their projects and tasks in one place.
Sign up on ClickUp for free to collate your marketing data and gain actionable insights.


